
Integrating Reliability and Sustainability: A Multi-Objective Framework
for Opportunistic Maintenance in Closed-Loop Supply Chain
Abdelhamid Boujarif
1 a
, David W. Coit
2 b
, Oualid Jouini
1 c
,
Zhiguo Zeng
1 d
and Robert Heidsieck
3
1
Industrial Engineering Laboratory (LGI) CentraleSup
´
elec, Paris-Saclay University, Gif-sur-Yvette, France
2
Department of Industrial and Systems Engineering, Rutgers University, U.S.A.
3
General Electric Healthcare, 283 Rue de la Mini
`
ere, 78530 Buc, France
Keywords:
Multi-Component Systems, Opportunistic Maintenance, Reliability, Economic Dependence, Structure
Dependence, Stochastic Dependence.
Abstract:
Closed-loop supply chains are at the forefront of sustainable industrial practices since they promote the reuse
of products through remanufacturing, recycling, and repair operations. Within this framework, repair centers
are increasingly considered an alternative source of spare parts. This creates a need to enhance repair oper-
ations to balance the reliability of repaired parts with sustainability. This paper, developed in collaboration
with GE Healthcare, presents a multi-objective framework incorporating spare part reliability post-repair esti-
mation into opportunistic maintenance decisions. This research uses real-world data and advanced modeling
techniques to refine maintenance strategies and provide a comprehensive solution that acknowledges compo-
nent interdependencies. By employing NSGA-III, the paper seeks to develop a decision-support mechanism
that recommends the proactive replacement of components, thereby enhancing the quality of repaired spare
parts.
1 INTRODUCTION
Nowadays, closed-loop supply chains (CLSCs) are
leading a paradigm shift toward embracing sustain-
able industrial practices. This transformation focuses
on giving products a second life through remanufac-
turing, recycling, and repair operations. Within this
framework, repair centers are increasingly viewed as
a second supplier of spare parts.
Maintenance protocols have conventionally used
new spare parts in critical domains, such as the med-
ical sector, to guarantee system fidelity. On the other
hand, in closed-loop supply chains, repaired parts are
treated equally to new ones. This assumption can oc-
casionally fall short of stringent reliability standards.
This can lead to increased equipment failures, which
impedes the circular efficacy of the supply chain.
Therefore, enhancing repair operations is neces-
sary to balance reliability and sustainability goals.
a
https://orcid.org/0000-0003-0641-9470
b
https://orcid.org/0000-0002-5825-2548
c
https://orcid.org/0000-0002-9498-165X
d
https://orcid.org/0000-0003-4937-4380
To this end, opportunistic maintenance emerges as
a strategic intervention. This methodology replaces
failed components and those approaching their end-
of-life to reduce the likelihood of future failures
proactively.
Nevertheless, existing opportunistic maintenance
models have often assumed components indepen-
dence. This presumption may not always align with
reality, where components deterioration is frequently
interdependent. Thus, recognizing and integrating
these dependencies is imperative for developing a ro-
bust maintenance framework that aligns with the dual
imperatives of reliability and sustainability within
closed-loop supply chains.
This paper, developed in collaboration with GE
Healthcare, proposes a framework to address this re-
search gap. We developed a multi-objective frame-
work that leverages estimating the reliability of a
spare part after repair and its use for maintenance
decisions. Our partnership with GE Healthcare en-
ables us to test and refine the proposed strategies us-
ing real-world data and sophisticated modeling tech-
niques. Through a nuanced analysis that captures the
interdependencies within the spare parts supply chain,
Boujarif, A., Coit, D., Jouini, O., Zeng, Z. and Heidsieck, R.
Integrating Reliability and Sustainability: A Multi-Objective Framework for Opportunistic Maintenance in Closed-Loop Supply Chain.
DOI: 10.5220/0012487400003639
Paper published under CC license (CC BY-NC-ND 4.0)
In Proceedings of the 13th International Conference on Operations Research and Enterprise Systems (ICORES 2024), pages 179-189
ISBN: 978-989-758-681-1; ISSN: 2184-4372
Proceedings Copyright © 2024 by SCITEPRESS – Science and Technology Publications, Lda.
179

we aim to provide a comprehensive solution to this
problem.
This research aims to develop a decision-support
mechanism that can enhance the quality of repaired
spare parts by recommending proactive replacement
of components. The study employs NSGA-III to
achieve this, which helps balance the various ob-
jectives of ensuring component longevity, maintain-
ing spare parts reliability, and achieving sustainabil-
ity goals. The ultimate goal of this research is to con-
tribute a unique perspective to the literature and estab-
lish a framework for maintenance strategies that can
be implemented across various industries to improve
both sustainability and reliability.
2 LITERATURE REVIEW
This work contributes to the body of knowledge in
three principal areas: the efficacy of Closed-Loop
Supply Chains (CLSCs), the strategic implementation
of opportunistic maintenance (OM), and the nuanced
reliability modeling of multi-component systems con-
sidering inter-component dependencies. The follow-
ing subsections explore these research streams, high-
lighting the intersectionality of these domains as they
pertain to this study’s objectives.
2.1 Closed-Loop Supply Chain
Efficiency
The concept of CLSCs originated in the 1990s, marks
a significant paradigm shift towards sustainable oper-
ations (van Nunen, 1995; Fleischmann et al., 1997;
Guide and Wassenhove, 2003). It represents the the-
oretical foundation for much of the recent discussion
on the circular economy (Agrawal et al., 2019). The
recovery processes integral to CLSCs, including re-
pair, remanufacturing, and recycling, have been es-
tablished as key drivers in reducing the demand for
virgin materials, curtailing energy use, and limiting
waste, thereby contributing to both environmental and
economic goals (Chen et al., 2021).
Strategic and tactical considerations, such as net-
work design and inventory management, dominate
the literature, highlighting the centrality of these fac-
tors in optimizing CLSC performance (Souza, 2013).
Within this strategic framework, (Gobbi, 2011) exam-
ined the influence of product residual value (PRV)
on recovery options, advocating for nuanced deci-
sions based on the residual value of returned products.
Scenario-based models for spare parts supply, such
as those developed by (Esmaeili et al., 2021), offer
a methodological approach to redesigning sales and
after-sales services within the CLSC, offering various
supply options. The challenges of uncertainty in sus-
tainable network design were tackled by (Guo et al.,
2022), who considered the return rates of first and
second-hand products. The valuation of remanufac-
tured products, assuming parity in quality with new
products, was explored by (Zhang et al., 2021b). Fur-
thermore, (Tahirov et al., 2016) presented a mathe-
matical model to compare production, remanufactur-
ing, and their combination within the CLSC frame-
work.
Despite the extensive research on CLSCs, there
remains a paucity of literature addressing the quan-
tification of repaired part quality and its consequen-
tial impact on the efficiency of the CLSC. This study
endeavors to fill this void, proposing a quantitative
model that factors in the reliability of repaired parts
to enhance the efficacy of the CLSC.
2.2 Opportunistic Maintenance
Opportunistic maintenance (OM) is recognized for
its preventive approach, which extends maintenance
activities beyond failed components to include those
at risk during opportunistic downtime (Haque et al.,
2003). A comprehensive review of OM strategies by
(Ab-Samat and Kamaruddin, 2014) covers literature
up to 2014, while (Diallo et al., 2017) focused on
maintenance strategies for second-hand products. The
literature identifies age-based and block replacement
as two prevalent OM policies. Age-based policies, as
outlined by (Jiang and Ji, 2002), advocate for replace-
ment based on the estimated lifetime of components.
However, few studies address age-replacement in
multi-component systems. The work of (Wang et al.,
2021) introduced an age-based OM model account-
ing for random repair times, while (Li et al., 2021)
proposed a maintenance strategy for wind farms that
considers both degradation failures and stochastic in-
cidents.
Block replacement policies are predicated on the
replacement of components in groups, based on var-
ious criteria such as remaining useful life and main-
tenance requirements (Rebaiaia and Ait-Kadi, 2022).
Research in this area has produced models that factor
in perfect and imperfect maintenance, as well as eco-
nomic and structural dependencies (Geng et al., 2015;
Gunn and Diallo, 2015). The literature on OM often
assumes component independence, with limited con-
sideration given to inter-component dependencies that
are critical in complex systems (Diallo et al., 2017).
The goal of this paper is to address this gap by incor-
porating economic, structural, and stochastic depen-
dencies into a comprehensive OM model.
ICORES 2024 - 13th International Conference on Operations Research and Enterprise Systems
180

2.3 Multi-Component System
Reliability Considering
Dependencies
Assessing the reliability of complex, interdependent
systems presents a formidable challenge. Stochastic
models, fault tree analysis (FTA), and Markov chains
are the primary methods employed in reliability esti-
mation (Wang et al., 2013; Zhang et al., 2021a; Fa-
zlollahtabar and Niaki, 2018; Bhangu et al., 2015).
(Kabir, 2017) highlighted the complexities involved
in FTA, necessitating the exploration of automated
methods for dependability synthesis. Markov mod-
els are another cornerstone technique used to evaluate
system states and transitions, exemplified by (Ahmad
et al., 2022) and (Issa and Hassan, 2023). However,
the limitations of Markov modeling in repairable re-
dundant systems were pointed out by (Simpson and
Kelly, 2002).
An alternative approach involves copula functions
and Nataf transformations to model the joint distri-
bution of survival functions for components (Navarro
and Durante, 2017; Lin et al., 2021). The work of
(Xiao, 2014) and (Lin et al., 2020) has advanced this
methodology, enhancing the evaluation of system re-
liability in complex scenarios. In this paper, we adopt
these advanced techniques, applying Nataf transfor-
mation to map the stochastic dependencies of com-
ponent failures, informed by historical repair data,
thus advancing the reliability estimation for multi-
component systems within the CLSC context.
3 MODELING AND PROBLEM
FORMULATION
In this section, we define the problem setting and
describe the opportunistic maintenance optimization
model developed for managing spare parts within a
Closed-Loop Supply Chain (CLSC). Our approach
aims to balance operational costs and system reliabil-
ity, under the constraints of economic, stochastic, and
structural dependencies.
3.1 Problem Description
We consider a CLSC framework where failed medical
equipment units, consisting of various components,
are replaced in the field with spare parts from an in-
ventory local to the client site. These failed units are
then sent to a repair center for thorough testing and
analysis. The objective is to identify and replace de-
fective components, and subsequently reintroduce the
refurbished spare parts into the supply chain for future
maintenance needs.
Within this system, maintenance decisions are
made opportunistically. Each time a unit fails and is
returned, the repair center is presented with a deci-
sion: to replace only the failed components or to also
proactively replace non-failed but aged components.
This decision aims to reduce the likelihood of future
failures and, in doing so, minimizes the long-term op-
erational costs while maintaining the reliability of the
spare parts within the CLSC.
This optimization problem is inherently dynamic;
each failure and subsequent repair decision resets
the life cycle of the affected components, creating
a new decision point. Unlike many existing models
that optimize the timing for preventive replacements,
this model introduces a single opportunity window to
make these decisions, aligning with real-world main-
tenance scenarios. The model accounts for three types
of dependencies that influence maintenance decision-
making:
• Economic Dependence: Where the collective
maintenance of a group of components incurs dif-
ferent costs compared to individual maintenance
actions, typically leading to cost savings when
multiple components are serviced simultaneously.
• Stochastic Dependence: Where the failure of one
component can have immediate, detrimental ef-
fects on the remaining components, potentially
accelerating their degradation or causing imme-
diate failure.
• Structural Dependence: Where components are
part of an interconnected assembly, necessitating
the disassembly of some parts to access others for
maintenance, as detailed in (Dinh et al., 2020).
This can impact both the duration of maintenance
activities and the condition of the components in-
volved.
The objective of this opportunistic maintenance op-
timization model is, then, to select a set of compo-
nents that need to be replaced preventively during
each maintenance opportunity. The model seeks to
minimize the maintenance cost, environmental im-
pact, and risk associated with spare parts repair, while
also minimizing the deviation from a predefined reli-
ability threshold.
3.2 Mathematical Formulation
To formally define the optimization model, let us in-
troduce the following notations:
Integrating Reliability and Sustainability: A Multi-Objective Framework for Opportunistic Maintenance in Closed-Loop Supply Chain
181

Parameters:
• ζ = [1, 2, 3, ..n]: set of components in the spare
part,
• Cost
c
: price of component c,
• M
c
: the average lifetime of component c,
• RV
c
=
cost
c
M
c
: residual value of component c,
• LC: labor cost,
• Cost
0
: logistic cost for each repair (shipping cost
to replace the LRU with a new one at the client
site),
• τ
c
: disassembling time for component c,
• a
c
: age of component c,
• R
c
(t): reliability function of component c,
• f
c
(t): probability density function of failure time
for component c,
• R
sys
(t;a
1
, a
2
, .., a
n
) = h(R
1
(t;a
1
), ..., R
n
(t;a
n
)):
reliability function of the spare part as a function
of reliability of its components,
• f
sys
(t;a
1
, a
2
, .., a
n
): probability density function
of system’s lifetime,
• T : planning horizon,
• r: interest rate,
• D = (D
i j
)
CXC
: disassembly matrix for the system,
• s
c
: state of component c,
s
c
=
1, if component c is in a failing state,
0, otherwise.
,
• S
price
: selling price of the spare part,
• R
min
: minimum required reliability.
One of the characteristics of spare parts reparation is
that the components may have different ages with a
large variance; the fragile ones usually would have
young ages, while the robust items would be an-
cient. Therefore, estimating the unit reliability is not
straightforward. We propose to express the unit’s re-
liability R
sys
as a function of components’ reliability
and ages. For example, for multi-independent units in
series, the reliability of the part can be expressed as
R
sys
(t) =
∏
c∈ζ
R
c
(t;a
c
).
Decision Variables: we define the binary decision
variable x
c
for each component c, with
x
c
=
1, if component c is replaced preventively,
0, otherwise.
Constraints: The model incorporates constraints
that ensure failed components are replaced correc-
tively 1 and the positive operational benefit 2.
x
c
+ s
c
≤ 1, ∀c ∈ ζ. (1)
S
price
−C
maintenance
> 0. (2)
Objective Functions: The multi-objective opti-
mization problem aims to minimize the following
costs:
min {C
maintenance
, C
environement
, C
risk
, R
deviation
}
(3)
s.t. S
price
−C
maintenance
> 0,
x
c
+ s
c
≤ 1, ∀c ∈ ζ,
x
c
∈ {0, 1}, ∀c ∈ ζ.
Maintenance Cost (C
maintenance
): This cost in-
cludes expenses due to corrective and preventive re-
placements (5 as well as labor costs involved in the
maintenance process:
C
maintenance
= C
r
+C
L
, (4)
where C
r
is the replacement cost calculated by sum-
ming the costs of components that are replaced either
correctively or preventively:
C
r
=
∑
c∈ζ
(x
c
+ s
c
) ×Cost
c
. (5)
C
L
represents the labor costs, which are proportional
to the disassembly time required to replace the com-
ponents. We use an approach developed by (Dinh
et al., 2020) to calculate the total maintenance time
for a component group. Based on the structure con-
nection between components, the disassembly matrix
D is constructed. The elements of the matrix are bi-
nary coefficients. The parameter D
i, j
= 1 if compo-
nent j must be disassembled to reach component i for
maintenance. The cumulative disassembling time of
a component c, denoted by τ
D
c
, can be defined as the
sum of disassembling times for all the components on
the path of disassembly (Eq. (6)).
τ
D
c
=
∑
k∈ζ
τ
k
× D
c,k
. (6)
For a group of components, there may be some in-
tersections between the disassembly path of different
items. As a result, the disassembly duration of the in-
tersection nodes must be counted only once, even if
it appears on several ones. Eq. (3.2) gives the total
disassembly time, denoted by τ
group
, of the replaced
components:
τ
group
=
∑
c∈ζ
(s
c
+ x
c
) × τ
D
c
(7)
−
∑
c∈ζ
τ
D
c
× max(
∑
k∈ζ
(s
k
+ x
k
) × D
k,c
− 1, 0),
where the first term represents the total disassembly
duration of all replaced components when they are
replaced separately; the second term is the time sav-
ing due to intersections among the disassembly paths.
ICORES 2024 - 13th International Conference on Operations Research and Enterprise Systems
182

Note that
∑
k∈ζ
(s
k
+ x
k
) × D
k,c
represents the total
number of components in the replaced group that have
component c on their disassembly path. In case there
is no intersection, the second part in Eq. 3.2 equals to
zero. Therefore, the total labor cost is the total repa-
ration time times the labor cost per time unit, i.e.,
C
L
= 2 × LC × τ
group
. (8)
Environmental Impact (C
environment
): The envi-
ronmental cost is associated with the waste of unused
remaining life of components that are replaced pre-
ventively:
C
environment
=
∑
c∈ζ
x
c
×
RV
c
R
sys
(0;a
1
(1 − s
1
), .., a
n
(1 − s
n
))
(9)
×
Z
+∞
0
t f
c
(t;a
c
)dt.
Risk Cost (C
risk
): The risk cost accounts for po-
tential failures within the planning horizon. When
a failure occurs, the logistic cost Cost
0
must be
counted. However, to compare the future payment
to the present time, its present value must be calcu-
lated. It means the amount of money that should be
deposited into the bank now at a specific interest rate r
to pay for an outlay C after duration T . At time t ≤ T ,
the conditional probability of failure after reparation
can be expressed as follows:
P(T
sys
< t) =
F
sys
(t; a
1
(1 − (x
1
+ s
1
)), .., a
n
(1 − (x
n
+ s
n
))
R
sys
(0;a
1
(1 − (x
1
+ s
1
)), .., a
n
(1 − (x
n
+ s
n
))
.
(10)
For the replaced components correctively or oppor-
tunistically (x
c
+ s
c
= 1), their age would be restored
to zero, while it won’t change for the other compo-
nents. So for a small variation of time, this probability
can be expressed using the calculated probability den-
sity function (pdf ) of the system f
sys
and the present
value of the logistic cost is Cost
0
× (1 + r)
−t
. Thus,
the total present value of the expected cost of failure
during the planning horizon, C
f
, can be expressed as
C
f ailure
=
Cost
0
R
sys
(0;a
1
(1 − (x
1
+ s
1
)), .., a
n
(1 − (x
n
+ s
n
))
×
(11)
Z
T
0
f
sys
(t; a
1
(1 − (x
1
+ s
1
)), .., a
n
(1 − (x
n
+ s
n
))
(1 + r)
t
dt.
Reliability Deviation (R
deviation
): This metric
quantifies the deviation of the part’s reliability from
the required minimum. The reliability of the part
is defined as the probability to survive the warranty
period T
warranty
given the components age after repair.
R
deviation
= 100 ×
max(R
min
−
R
sys
(T
warranty
;a
1
(1−(x
1
+s
1
)),..)
R
sys
(0;a
1
(1−(x
1
+s
1
)),..)
, 0)
R
min
.
(12)
4 SYSTEM RELIABILITY
MODELING CONSIDERING
STOCHASTIC DEPENDENCY
Computing the joint distribution of components’ life-
times is crucial for incorporating stochastic depen-
dency into optimization models. As reviewed in
Section 2, extant system reliability models that ac-
count for stochastic dependencies, such as Monte
Carlo simulations (Son et al., 2016; Issa and Has-
san, 2023; Ahmad et al., 2022), and copulas (Lin
et al., 2021; Navarro and Durante, 2017), are often
computationally intensive, rendering them impracti-
cal for high-dimensional problems. To surmount this
challenge, we introduce a dimensionality reduction
technique that computes the joint distribution of de-
pendent components’ lifetimes, subsequently utiliz-
ing Nataf’s transformation to accommodate the de-
pendencies among clusters of components.
4.1 Components Clustering
The construction of dependent clusters begins by cal-
culating covariance coefficients between each pair of
components from historical repair data. A distance
matrix H = (h
i, j
) is derived from the correlation co-
efficients R = (ρ
i, j
); (h
i, j
= 1 − |ρ
i, j
| ∀i, j). This
inverse relationship ensures that stronger dependen-
cies correspond to shorter distances. Components are
then clustered using the Agglomerative Hierarchical
Clustering algorithm, a common hierarchical cluster-
ing method that groups objects based on similarity
(Sasirekha and Baby, 2013).
The reliability distribution for each cluster is then
constructed, considering each cluster as an indepen-
dent ’super component’. The failure of any individual
component within a cluster implies the failure of the
entire cluster. The system reliability function under
the independence assumption is given by:
R
∗
sys
(t) =
∏
g∈ζ
R
g
(t;a
g
) (13)
We assess the configurations based on the likeli-
hood and the number of components per group, aim-
ing to select a threshold δ that minimizes group size
and maximizes the likelihood of the system’s time-
to-failure distribution. Analogous to the Akaike In-
formation Criterion (AIC), we formulate an index to
Integrating Reliability and Sustainability: A Multi-Objective Framework for Opportunistic Maintenance in Closed-Loop Supply Chain
183

evaluate the optimal solution. For a statistical model
with k parameters and a maximized likelihood func-
tion L, the AIC is AIC = 2k −2ln(L). The objective of
AIC is to minimize the number of parameters k while
maximizing the likelihood. In our case, we consider k
as the maximum number of components per group.
4.2 Nataf Transformation
Upon establishing the optimal grouping configuration
as detailed in Section 4.1, the Nataf transformation
is employed to compute the joint distribution of each
component group. Pioneered by (Liu and Der Ki-
ureghian, 1986) and further innovated by (Lebrun
and Dutfoy, 2009), the transformation is a statisti-
cal method for dealing with correlated random vari-
ables by mapping them from their original distribu-
tion space to a standard normal space.
u = T
N
(X) = T
3
◦ T
2
◦ T
1
(X) (14)
where :
T
1
: X → W = [F
x
1
(x
1
), ..., F
x
n
(x
n
)]
T
T
2
: W → Z = [Φ
−1
(w
1
), ..., Φ
−1
(w
n
)]
T
T
3
: Z → U = L
−1
Z
Φ
−1
(.) is the inverse CDF of the standard normal vec-
tor Z, F
x
i
is the CDF of the component x
i
, and L rep-
resents the lower triangular matrix obtained from the
Cholesky decomposition of R
Z
= (ρ
Z
i, j
) the correla-
tion matrix of the standard normal vector Z. The joint
probability of random vector X is then formulated as
follows:
P(X ≤t) = P(X
1
, X
2
, ..., X
n
≤ t)
= Φ
R
Z
(Φ
−1
(F
x
1
(t)), Φ
−1
(F
x
2
(t)), ..., Φ
−1
(F
x
n
(t)))
(15)
The correlation matrix of the random vector X, de-
noted by R
X
, is transformed into a standard normal
space using a linear search technique as described by
(Li et al., 2008; Xiao, 2014). The search is iteratively
refined until the difference between b and a falls be-
low a predetermined error threshold ∆.
The joint probability density function for a group
of components in a serial system, represented by the
survival function R
g
(t) can be expressed as follows:
R
g
(t) = P(min
c∈g
(X
c
) ≥ t) (16)
= P(
\
c∈g
X
c
≥ t)
= 1 − P(
[
c∈g
X
c
≤ t)
= 1 −
∑
c∈g
F
c
(t) +
∑
1≤c
1
≤c
2
≤n
g
P(X
c
1
, X
c
2
≤ t) + ...
+ (−1)
k
∑
1≤c
1
≤c
2
...≤c
k
≤n
g
P(X
c
1
, X
c
2
, ..., X
c
k
≤ t)
= 1 +
∑
1≤k≤n
g
(−1)
k
∑
1≤c
1
≤c
2
...≤c
k
≤n
g
P(X
c
1
, X
c
2
, ..., X
c
k
≤ t)
This approach simplifies the computational process
and enables system reliability evaluation for high-
dimensional problems involving multiple dependent
components.
5 INDUSTRIAL CASE STUDY
We present in this section an application of the de-
veloped model based on a real industrial case from
our industrial partner GE Healthcare. GE Healthcare
(GEHC) is one of the global leaders in sales and ser-
vices of medical systems, notably those of medical
imaging with 4 million of millions systems installed
in more than 160 countries. Because of the criticality
of its products (medical devices) and the technologi-
cal characteristics of its components, GE Healthcare
offers a maintenance service to its customers. The
service’s main objective is to ensure its products’ re-
liability (reducing the failure rate occurrence) while
reducing unavailability simultaneously. As the spare
parts are expensive and also because of diposal the
failed parts directly will create circularity problems, a
CLSC is implemented in GEHC.
In this study, we implement the developed OM op-
timization model on the power supply of MRI ma-
chines, and investigate the strategy impact on the effi-
ciency of the CLSC. The considered spare part com-
poses of 11 components connected in series. Figure 1
and Table 1 represent the physical structure between
components and the disassembling order and the nec-
essary operation times for each component, respec-
tively. For example, components 4, 5, and 7 must be
disassembled before component 10 can be replaced.
Table 2 represents the purchase price for new compo-
nents and their average useful life Mul in (U.T).
Table 1: Components’ dismantling time.
Component C1 C2 C3 C4 C5 C6 C7 C8 C9 C10 C11
Disassembling
time (U.T)
3 1 1.5 0.2 2 4.5 9 4.5 1 1 1
GEHC spare parts supply chain is so particular
ICORES 2024 - 13th International Conference on Operations Research and Enterprise Systems
184
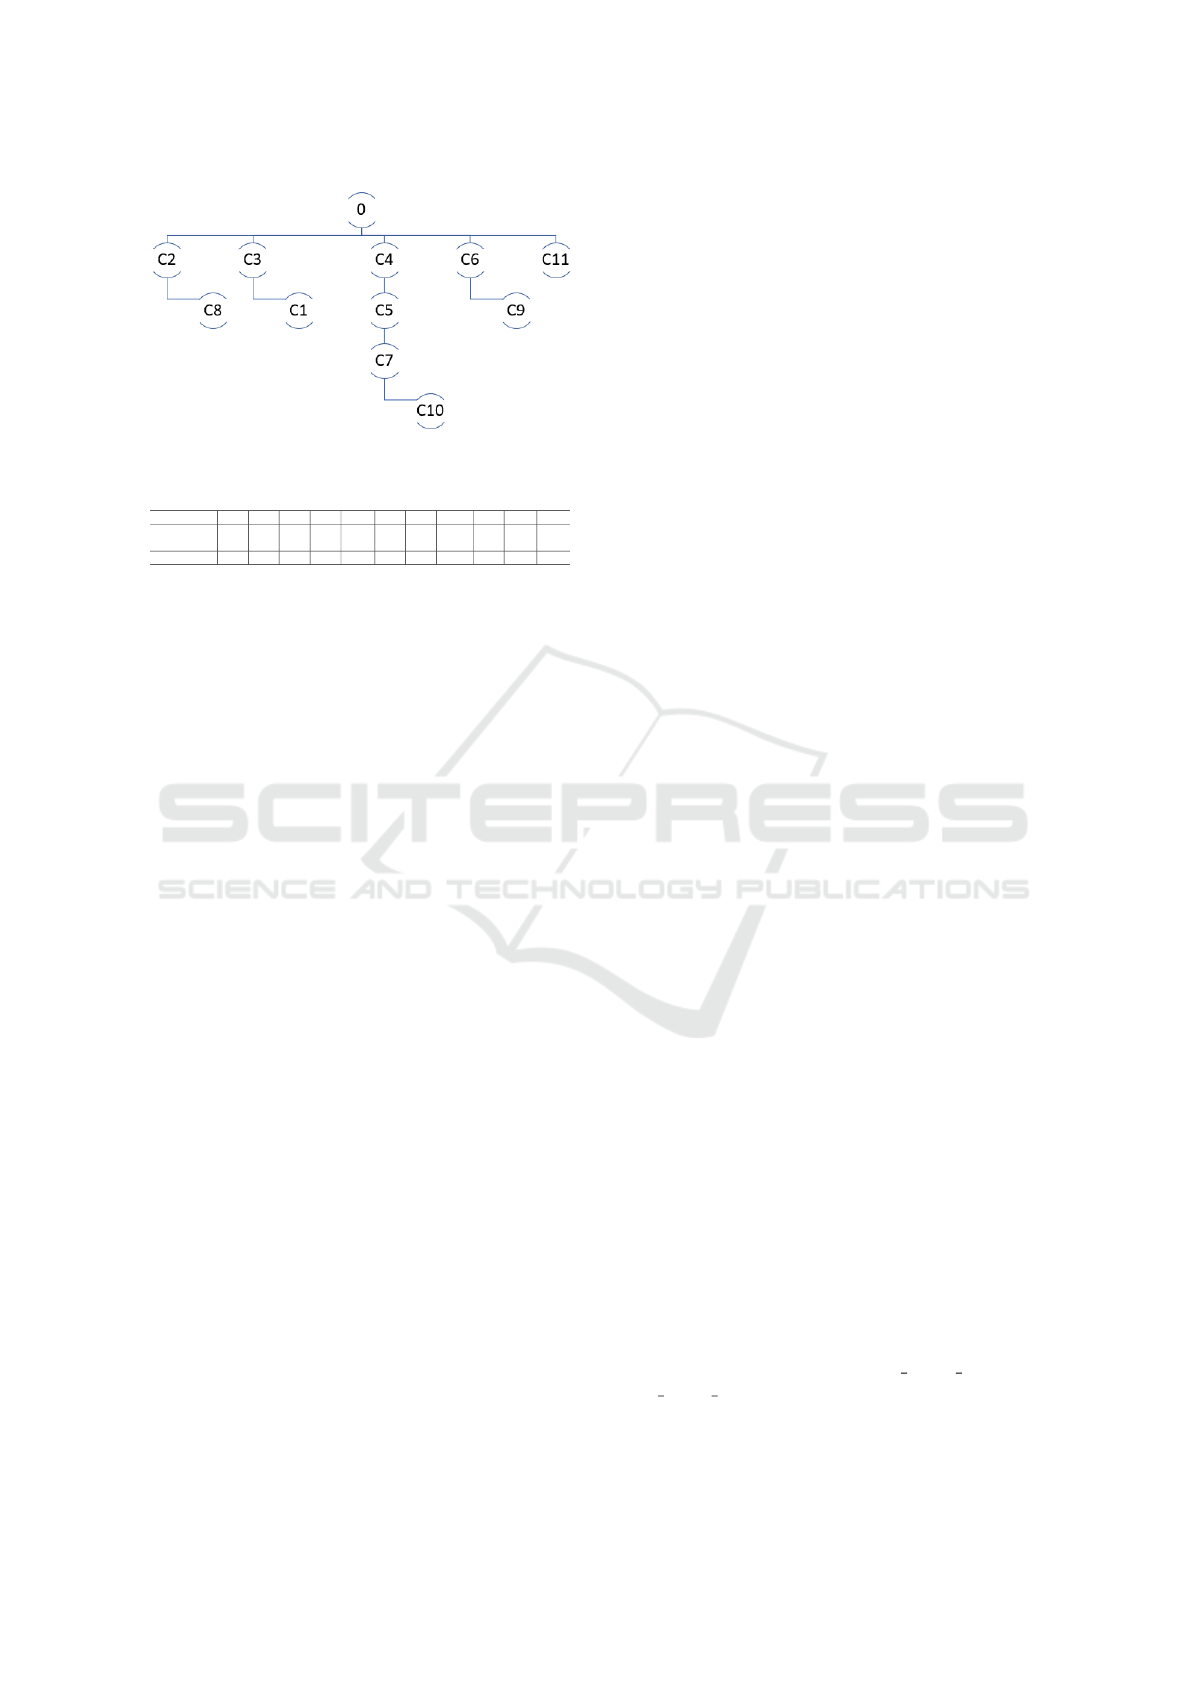
Figure 1: System’s structure.
Table 2: Costs parameters.
Component C1 C2 C3 C4 C5 C6 C7 C8 C9 C10 C11
Component
cost (U.C)
22 24 6 43 140 2 34 23 6 9 8
Mul (U.T) 71k 22k 54k 44k 1.5k 16k 68k 183k 37k 58k 24k
because its efficiency mainly depends on the qual-
ity of their repaired parts. The repair center provides
around one thousand of repaired power supply per
year to maintain Thousands of MRI systems. Be-
sides, depending on forecasted demand and stock lev-
els, one part can be reallocated multiple time to dif-
ferent warehouses around the world before being in-
stalled on a system which makes gathering parts’ life-
time challenging. Different information systems and
databases are used to store maintenance and logistic
data. We developed an algorithm to extract repair in-
formation and lifetime data for each replaceable unit
(LRU).
We have collected 13200 operating time and
maintenance records for 7514 spare parts. 3490 LRUs
were repaired multiple times. We consider the oper-
ating time of the functioning parts as censored. We
randomly selected 120 LRUs that was repaired multi-
ple times with different ages and multiple failed com-
ponents. We apply the optimization model on the se-
lected parts for a planning horizon of 730 Unit of time
(U.T). The remaining records are used to build System
reliability functions. Table 3 represents an example
of the data format. Column ID and Repair Number
are the part’s serial number and repair record. The
functioning parts are marked with value 1 in column
Censored. Column Time to failure represents the
observed time to event before each repair. The re-
maining columns represent the failed components. A
value equal to 1 for a component C
i
represents its fail-
ure.
In implementing the opportunistic maintenance
model delineated by equations (3), we estimate the
lifetime distributions from the data detailed in table
3 and take into account the stochastic dependencies
as detailed in section 4. Due to the complex nature
of the problem, an analytical solution remains elusive
for two primary reasons. Firstly, the failure cost eval-
uation in equation (11) requires calculating the con-
ditional reliability post-maintenance, which compli-
cates any attempt to linearize the objective function.
Moreover, the problem is classified as NP-hard be-
cause each component presents two potential scenar-
ios, leading to 2
n
possible configurations for a system
with n components. To navigate this computational
complexity and derive a near-optimal solution for the
opportunistic maintenance strategy, we employ the
Non-dominated Sorting Genetic Algorithm (NSGA).
This algorithm is particularly adept at handling multi-
objective optimization problems since it provides a
set of Pareto-optimal solutions representing the trade-
offs among the objectives. The decision-making pro-
cess will involve selecting the most appropriate solu-
tions based on the operational goals and constraints of
the CLSC.
6 RESULTS AND ANALYSIS
This section reports the results of our opportunistic
strategy on the test subset. First, we present the per-
formance of the clustering method described in sec-
tion 4 to model dependency in 6.1. Then, we present
the trade-off between different objectives and their
impact on decisions in section 6.2. Finally, we present
the opportunistic maintenance effect on parts’ relia-
bility in section 6.3.
6.1 Reliability Functions Under
Dependency
To build a system reliability model under dependency,
we select replacement records for the failed parts
and compute the correlation matrix between compo-
nents replacement using the Pearson method (Li et al.,
2012). Figure 2 shows the obtained correlation ma-
trix. Visually examining the results reveals that there
are different grouping possibilities. We can either
group C1, C2, with C3 and C7 with C10 or focus
on grouping only C1 with C3 and consider the re-
maining components independent. The grouping al-
gorithm presented in Section 4.1 is then used to de-
termine the best grouping strategy by maximizing the
likelihood and minimizing the number of components
per group. The results of the grouping algorithm are
given in Table 4, where threshold and groups rep-
resent the minimum correlation level selected and
the formed groups, respectively; N
super comp and
Max comp group are the number of formed groups
and the maximum number of components per group.
It can be seen from Table 4 that the best threshold for
Integrating Reliability and Sustainability: A Multi-Objective Framework for Opportunistic Maintenance in Closed-Loop Supply Chain
185
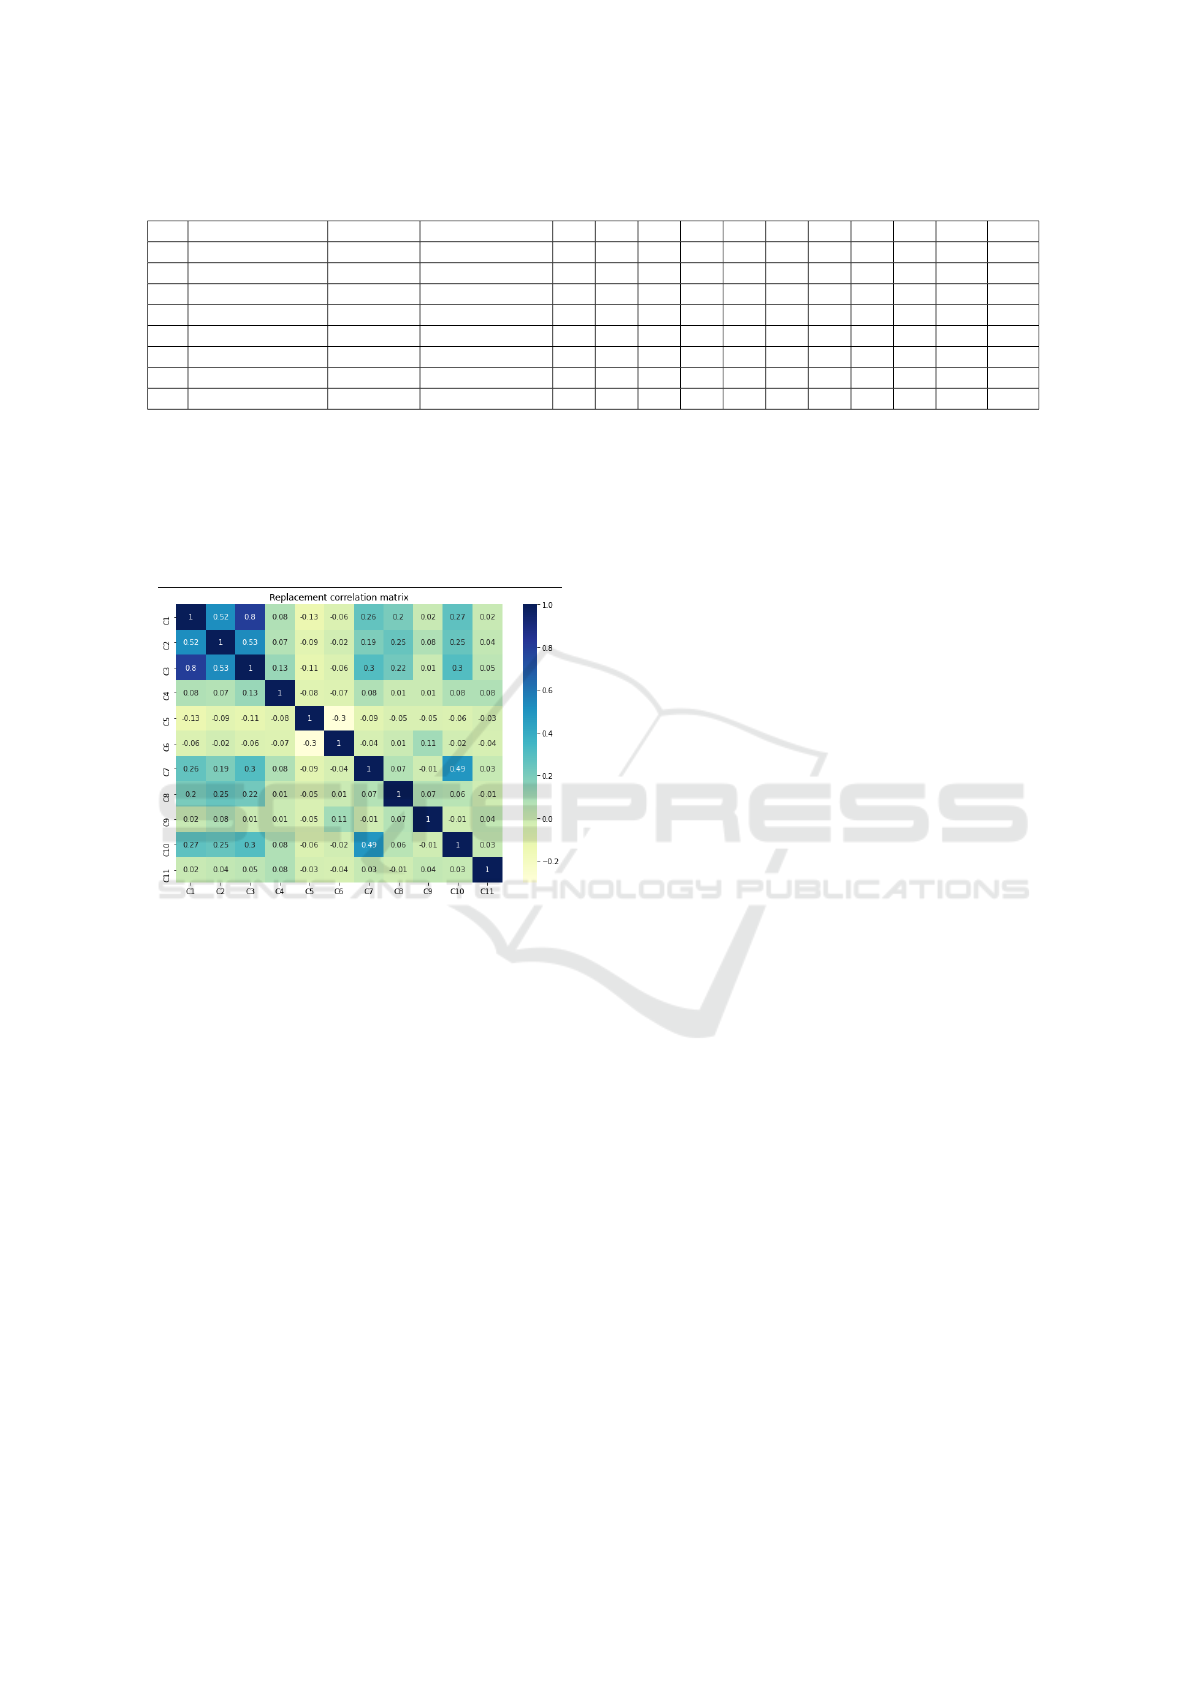
Table 3: Example of data format.
ID Repair Number Censored Time to failure C1 C2 C3 C4 C5 C6 C7 C8 C9 C10 C11
1 0 0 1260 0 0 0 1 1 0 0 0 0 0 0
1 1 0 1319 0 0 0 0 1 0 0 0 0 0 0
1 2 1 969 0 0 0 0 0 0 0 0 0 0 0
2 0 0 2159 0 0 0 0 1 0 0 0 0 0 0
2 1 1 1410 0 0 0 0 0 0 0 0 0 0 0
3 0 0 399 0 0 0 0 0 0 0 0 0 0 0
3 1 0 508 0 0 0 0 1 0 0 0 0 0 0
3 2 1 2628 0 0 0 0 0 0 0 0 0 0 0
grouping components is 0.6 because it maximizes the
loglikelihood and minimizes the number of compo-
nents per group. It can be verified that by grouping
like this, the resulting marginal distributions can sat-
isfy the positive definite constraint needed for apply-
ing Nataf transformation.
Figure 2: Correlation matrix.
The system reliability is then calculated based on
Eq. (16) considering the stochastic dependencies and
the forming clusters. Figure 3 shows the result and
compare it to the empirical estimations directly from
data. As we can see, the computed system lifetime
distribution from the proposed model fits well the em-
pirical data.
6.2 Pareto Frontier Analysis and
Decision-Making Insights
The radar charts in figures 4 and 5 portray the Pareto
optimal solutions for two studied parts derived from
our multi-objective optimization framework. These
charts serve as a graphical elucidation of the trade-
offs between competing objectives within the context
of opportunistic maintenance scheduling.
Interpretive Analysis. Each axis on the radar
chart quantifies an objective: maintenance costs
(C
maintenance
), environmental impacts (C
environment
),
risk levels (C
risk
), net benefits, the number of to-
tal replacements, and regulatory compliance penal-
ties (R
penalty
). The shape and reach of each solution’s
polygon on the chart indicate its performance across
these objectives. The farther a vertex extends from the
center, the higher the value in that specific objective,
thus facilitating a comparative analysis of the trade-
offs involved.
Equilibrium and Trade-Offs. The essence of the
Pareto frontier in a multi-criteria context is the bal-
ance between objectives. For instance, solutions that
extend towards the periphery for net benefit illustrate
a preference for financial optimization, potentially at
the expense of elevated risk. Meanwhile, solutions
with a more even distribution of vertices suggest a
more balanced approach, likely representing an equi-
librium amidst the conflicting objectives.
Managerial Implications. The model provides
profound insights into the strategic allocation of re-
sources for maintenance. It highlights the necessity
of a nuanced approach that transcends singular objec-
tive optimization:
• Solutions skewed towards net benefit might res-
onate with profit-maximizing agendas, albeit with
a vigilant eye on the rise in risk cost.
• Eco-centric solutions emphasize sustainability,
aligning with environmental compliance and so-
cial responsibility mandates.
• Risk-averse profiles cater to scenarios where the
cost of failure or downtime is prohibitive, under-
scoring the need for meticulous risk management.
• The minimization of R
penalty
reflects compliance-
centric strategies vital for adhering to regulatory
frameworks and avoiding fiscal penalties.
Conclusion. In conclusion, the Pareto frontiers un-
derscore the multifaceted nature of decision-making
in maintenance strategy optimization. Through a vi-
sual and quantitative articulation of trade-offs, the
model endows decision-makers to discern a balanced
ICORES 2024 - 13th International Conference on Operations Research and Enterprise Systems
186
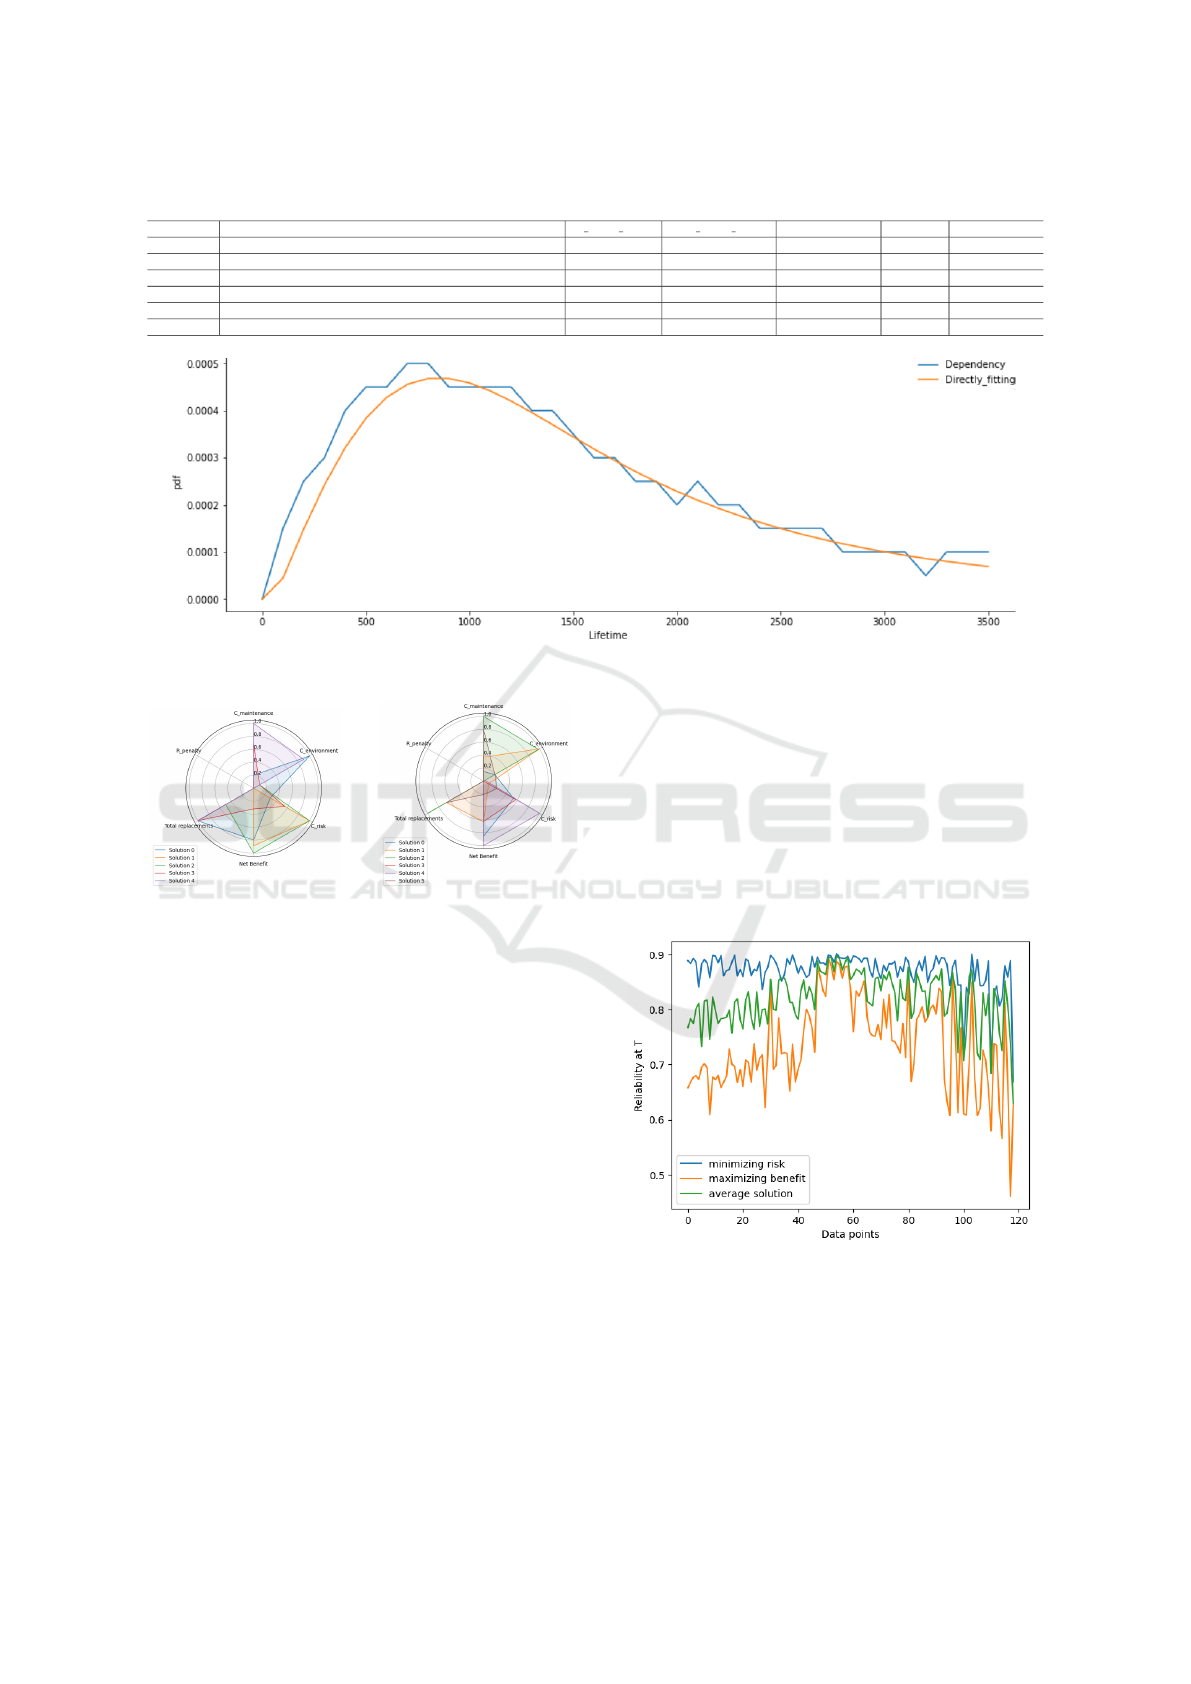
Table 4: Grouping components results.
Threshold Groups N super comp Max comp group Positive definite AIC Loglikelihood
0.6 (C1,C3) 10 2 1 10571.19 -10567.19
0.1 (C1,C2,C3,C7,C10) 7 5 0 10578.31 -10568.31
[0.4,0.5] (C1,C3); (C7,C10) 9 2 1 10583.59 -10579.59
[0.2,0.3] (C1,C2,C3);(C7,C10) 8 3 0 10591.78 -10585.78
[0.7,0.9] (C1);(C2);(C3);(C4);(C5);(C6);(C7);(C8);(C9);(C10);(C11) 11 1 1 10593.28 -10593.28
0 (C1,C2,C3,C4,C7,C10); (C5,C8,C11); (C6,C9) 3 6 0 26482.69 -26470.69
Figure 3: Modeling failure distribution under dependency.
Figure 4: Pareto frontier
for the first case.
Figure 5: Pareto frontier
for the second case.
and holistic strategy that aligns with the broader spec-
trum of operational objectives.
6.3 Impact on the Reliability of the
Repaired Spare Parts
Figure 6 compares the reliability at the end of the hori-
zon plan T .Adopting a proactive maintenance strat-
egy has significant implications for the reliability of
components after their horizon period. The model’s
performance is intrinsically linked to the manage-
ment’s risk tolerance. Preferences that lean towards
maximizing benefits could adhere to the minimum
quality constraints, yet this approach carries an inher-
ent risk of failure, potentially leading to lower relia-
bility post-warranty.
Conversely, a strategy focused on minimizing risk
would enhance the reliability to its highest attainable
level, albeit at the cost of reduced benefits. This con-
servative approach ensures a robust system that main-
tains performance beyond the horizon period, mitigat-
ing the likelihood of over-quality.
An average solution, representing a balance be-
tween the two extremes, offers a compromise that
aligns with intermediate managerial risk preferences.
This equilibrium point provides a performance be-
tween maximizing benefits and minimizing risks.
This midpoint strategy can be particularly advan-
tageous for sustaining moderate reliability while
achieving reasonable benefits, effectively balancing
the trade-offs between risk, cost, and reliability.
Figure 6: Impact of OM strategy on reliability at T
warranty
.
Decision-makers need to consider the long-term
implications of their chosen maintenance strategy on
the reliability of parts. As the warranty period con-
cludes, a maintenance plan overly focused on imme-
diate benefits may result in increased costs due to fail-
ures and replacements. In contrast, prioritizing relia-
Integrating Reliability and Sustainability: A Multi-Objective Framework for Opportunistic Maintenance in Closed-Loop Supply Chain
187

bility can lead to sustained performance and reduced
long-term expenses, aligning with the overarching ob-
jectives of reliability-centered maintenance practices.
7 CONCLUSIONS AND
PERSPECTIVES
This research has presented a multi-objective opti-
mization framework for opportunistic maintenance
within Closed-Loop Supply Chains, focusing on the
medical systems domain. By integrating NSGA-
III, an advanced evolutionary algorithm, our model
handles the intricate balance of maintenance costs,
environmental impacts, risk, net benefits, total re-
placements, and regulatory penalties. The empiri-
cal results, underpinned by real-world data from GE
Healthcare, have demonstrated the efficacy of the pro-
posed model in navigating the complex trade-offs in-
herent in maintenance strategy optimization.
The Pareto frontiers elucidated through radar
charts visualize the trade-offs among competing ob-
jectives, empowering decision-makers to identify
strategies that align with their specific operational
goals and risk appetites. Whether the preference is
for cost minimization, risk aversion, or environmental
sustainability, the model offers the flexibility to tune
the maintenance strategy accordingly.
We have also highlighted the chosen maintenance
strategy’s significant impact on the parts’ reliability
after the warranty period. The preference towards
maximizing benefits may lead to cost efficiencies in
the short term but can result in lower reliability post-
warranty. Conversely, a risk-averse approach that pri-
oritizes part reliability ensures system robustness but
may compromise on immediate financial benefits.
In summary, this study contributes a novel per-
spective to the literature on maintenance strategy opti-
mization within CLSCs and sets a precedent for future
research. Future work will aim to refine the optimiza-
tion framework further and explore its applicability
across different industry sectors, thereby broadening
the impact of this research.
ACKNOWLEDGEMENT
We would like to thank Didier Rault and Stephane
Borrel from GE HealthCare for their helpful discus-
sions and results validation. The research of Zhiguo
Zeng is financially supported by ANR under grant
number ANR-22-CE10-0004 and partially supported
by the chaire of Risk and Resilience of Complex Sys-
tems (Chaire EDF, Orange and SNCF). The partici-
pation of David Coit in this research is partially fi-
nanced by the international visiting grant from Cen-
tralesup
´
elec, and the Bourses Jean d’Alembert from
Universit
´
e Paris-Saclay.
REFERENCES
Ab-Samat, H. and Kamaruddin, S. (2014). Opportunistic
maintenance (om) as a new advancement in mainte-
nance approaches: A review. Journal of Quality in
Maintenance Engineering, 20(2):98–121.
Agrawal, V. V., Atasu, A., and Van Wassenhove, L. N.
(2019). Om forum—new opportunities for operations
management research in sustainability. Manufactur-
ing & Service Operations Management, 21(1):1–12.
Ahmad, H. H., Almetwally, E. M., and Ramadan, D. A.
(2022). A comparative inference on reliability estima-
tion for a multi-component stress-strength model un-
der power lomax distribution with applications. AIMS
Math, 7:18050–18079.
Bhangu, N. S., Pahuja, G., and Singh, R. (2015). Appli-
cation of fault tree analysis for evaluating reliability
and risk assessment of a thermal power plant. Energy
Sources, Part A: Recovery, Utilization, and Environ-
mental Effects, 37(18):2004–2012.
Chen, H., Dong, Z., Li, G., and He, K. (2021). Re-
manufacturing process innovation in closed-loop sup-
ply chain under cost-sharing mechanism and different
power structures. Computers & Industrial Engineer-
ing, 162:107743.
Diallo, C., Venkatadri, U., Khatab, A., and Bhakthavatcha-
lam, S. (2017). State of the art review of quality, re-
liability and maintenance issues in closed-loop supply
chains with remanufacturing. International Journal of
Production Research, 55(5):1277–1296.
Dinh, D.-H., Do, P., and Iung, B. (2020). Maintenance op-
timisation for multi-component system with structural
dependence: Application to machine tool sub-system.
CIRP Annals, 69(1):417–420.
Esmaeili, N., Teimoury, E., and Pourmohammadi, F.
(2021). A scenario-based optimization model for
planning and redesigning the sale and after-sales ser-
vices closed-loop supply chain. RAIRO-Operations
Research, 55:S2859–S2877.
Fazlollahtabar, H. and Niaki, S. T. A. (2018). Fault tree
analysis for reliability evaluation of an advanced com-
plex manufacturing system. Journal of advanced
Manufacturing systems, 17(01):107–118.
Fleischmann, M., Bloemhof-Ruwaard, J. M., Dekker, R.,
Van der Laan, E., Van Nunen, J. A., and Van Wassen-
hove, L. N. (1997). Quantitative models for reverse
logistics: A review. European journal of operational
research, 103(1):1–17.
Geng, J., Azarian, M., and Pecht, M. (2015). Opportunis-
tic maintenance for multi-component systems con-
sidering structural dependence and economic depen-
ICORES 2024 - 13th International Conference on Operations Research and Enterprise Systems
188

dence. Journal of Systems Engineering and Electron-
ics, 26(3):493–501.
Gobbi, C. (2011). Designing the reverse supply chain: the
impact of the product residual value. International
Journal of Physical Distribution & Logistics Manage-
ment, 41:768–796.
Guide, V. D. R. and Wassenhove, L. N. (2003). Busi-
ness aspects of closed-loop supply chains, volume 12.
Carnegie Mellon University Press Pittsburgh, PA.
Gunn, E. A. and Diallo, C. (2015). Optimal opportunistic
indirect grouping of preventive replacements in mul-
ticomponent systems. Computers & Industrial Engi-
neering, 90:281–291.
Guo, Y., Shi, Q., and Guo, C. (2022). A fuzzy robust pro-
gramming model for sustainable closed-loop supply
chain network design with efficiency-oriented multi-
objective optimization. Processes, 10(10):1963.
Haque, S. A., Kabir, A. Z., and Sarker, R. A. (2003). Opti-
mization model for opportunistic replacement policy
using genetic algorithm with fuzzy logic controller.
In The 2003 Congress on Evolutionary Computation,
2003. CEC’03., volume 4, pages 2837–2843. IEEE.
Issa, L. A. A. A. and Hassan, Z. A. H. (2023). Application
of markov models to maintenance-required systems.
In AIP Conference Proceedings, volume 2591, page
050012. AIP Publishing LLC.
Jiang, R. and Ji, P. (2002). Age replacement policy: a multi-
attribute value model. Reliability Engineering & Sys-
tem Safety, 76(3):311–318.
Kabir, S. (2017). An overview of fault tree analysis and
its application in model based dependability analysis.
Expert Systems with Applications, 77:114–135.
Lebrun, R. and Dutfoy, A. (2009). An innovating analysis
of the nataf transformation from the copula viewpoint.
Probabilistic Engineering Mechanics, 24(3):312–320.
Li, D.-Q., Wu, S.-B., Zhou, C.-B., and Phoon, K. (2012).
Performance of translation approach for modeling
correlated non-normal variables. Structural safety,
39:52–61.
Li, H., L
¨
u, Z., and Yuan, X. (2008). Nataf transformation
based point estimate method. Chinese Science Bul-
letin, 53(17):2586–2592.
Li, M., Jiang, X., and Negenborn, R. R. (2021). Op-
portunistic maintenance for offshore wind farms with
multiple-component age-based preventive dispatch.
Ocean Engineering, 231:109062.
Lin, S.-W., Matanhire, T. B., and Liu, Y.-T. (2021). Copula-
based bayesian reliability analysis of a product of a
probability and a frequency model for parallel systems
when components are dependent. Applied Sciences,
11(4):1697.
Lin, X., Jiang, Y., Peng, S., Chen, H., Tang, J., and Li,
W. (2020). An efficient nataf transformation based
probabilistic power flow for high-dimensional cor-
related uncertainty sources in operation. Interna-
tional Journal of Electrical Power & Energy Systems,
116:105543.
Liu, P.-L. and Der Kiureghian, A. (1986). Multivari-
ate distribution models with prescribed marginals and
covariances. Probabilistic engineering mechanics,
1(2):105–112.
Navarro, J. and Durante, F. (2017). Copula-based represen-
tations for the reliability of the residual lifetimes of
coherent systems with dependent components. Jour-
nal of Multivariate Analysis, 158:87–102.
Rebaiaia, M.-L. and Ait-Kadi, D. (2022). A remaining
useful life model for optimizing maintenance cost
and spare-parts replacement of production systems
in the context of sustainability. IFAC-PapersOnLine,
55(10):1562–1568.
Sasirekha, K. and Baby, P. (2013). Agglomerative hierar-
chical clustering algorithm-a. International Journal
of Scientific and Research Publications, 83(3):83.
Simpson, K. and Kelly, M. (2002). Reliability assessments
of repairable systems—is markov modelling correct?
In Safety and Reliability, volume 22, pages 19–39.
Taylor & Francis.
Son, K. S., Kim, D. H., Kim, C. H., and Kang, H. G. (2016).
Study on the systematic approach of markov modeling
for dependability analysis of complex fault-tolerant
features with voting logics. Reliability Engineering
& System Safety, 150:44–57.
Souza, G. C. (2013). Closed-loop supply chains: a crit-
ical review, and future research. Decision Sciences,
44(1):7–38.
Tahirov, N., Hasanov, P., and Jaber, M. Y. (2016). Opti-
mization of closed-loop supply chain of multi-items
with returned subassemblies. International Journal of
Production Economics, 174:1–10.
van Nunen, T. M. S. M. (1995). J van wassenhove l strategic
issues in product recovery management. California
Management Review, 372:114–135.
Wang, C., Xing, L., and Levitin, G. (2013). Reliability anal-
ysis of multi-trigger binary systems subject to compet-
ing failures. Reliability Engineering & System Safety,
111:9–17.
Wang, J., Miao, Y., Yi, Y., and Huang, D. (2021). An im-
perfect age-based and condition-based opportunistic
maintenance model for a two-unit series system. Com-
puters & Industrial Engineering, 160:107583.
Xiao, Q. (2014). Evaluating correlation coefficient for nataf
transformation. Probabilistic Engineering Mechanics,
37:1–6.
Zhang, J., Kang, J., Sun, L., and Bai, X. (2021a). Risk
assessment of floating offshore wind turbines based
on fuzzy fault tree analysis. Ocean Engineering,
239:109859.
Zhang, X.-m., Li, Q.-w., Liu, Z., and Chang, C.-T.
(2021b). Optimal pricing and remanufacturing mode
in a closed-loop supply chain of weee under govern-
ment fund policy. Computers & Industrial Engineer-
ing, 151:106951.
Integrating Reliability and Sustainability: A Multi-Objective Framework for Opportunistic Maintenance in Closed-Loop Supply Chain
189
