
SMART-RD: Towards a Risk Assessment Framework for Autonomous
Railway Driving
Justin Bescop
a
, Nicolas Goeman
b
, Amel Aissaoui
c
, Benjamin Allaert
d
and Jean-Philippe Vandeborre
e
IMT Nord Europe, Institut Mines-T
´
el
´
ecom, Univ. Lille, Centre for Digital Systems, F-59000 Lille, France
Keywords:
Autonomous Driving, Dynamic Risk Assessment, Deep Learning, Railway Dataset.
Abstract:
While the automotive industry has made significant contributions to vision-based dynamic risk assessment,
progress has been limited in the railway domain. This is mainly due to the lack of data and to the unavailability
of security-based annotation for the existing datasets. This paper proposes the first annotation framework for
the railway domain that takes into account the different components that significantly contribute to the vision-
based risk estimation in driving scenarios, thus enabling an accurate railway risk assessment. A first baseline
based on neural network is performed to prove the consistency of the risk-based annotation. The performances
show promising results for vision-based risk assessment according to different levels of risk.
1 INTRODUCTION
Autonomous vehicles aim to provide many benefits,
such as reducing road accidents, congestion, air pol-
lution and improving transport efficiency. These ve-
hicles can move without human intervention, using a
combination of sensors, algorithms and communica-
tion systems to detect obstacles, assess driving situa-
tions and make decisions accordingly. Autonomous
car technology has grown significantly, making re-
markable advances in road safety, connectivity and
mobility (Van Brummelen et al., 2018). However, few
advances have been made in autonomous trains.
Autonomous vehicle safety is a set of safety pro-
tocols, procedures and guidelines which aim to en-
sure that autonomous vehicles are safe for users, pas-
sengers and pedestrians. They relies on sensors and
technologies such as cameras, radars and lidars in or-
der to collect data from the surrounding (Vargas et al.,
2021; Zhang et al., 2023). The collected data is then
used by sophisticated learning algorithms so as to
guide the vehicle autonomously on roads by assess-
ing the surrounding based on many criteria such as
obstacle detection, lane conditions and road user be-
havior anticipation (Guo et al., 2020). It is necessary
to develop, behind these sensors, an information pro-
a
https://orcid.org/0000-0003-3816-2104
b
https://orcid.org/0009-0009-3839-6198
c
https://orcid.org/0009-0003-6907-7014
d
https://orcid.org/0000-0002-4291-9803
e
https://orcid.org/0000-0003-2056-8675
cessing chain, usually based on Artificial Intelligence
(Kuutti et al., 2021; Grigorescu et al., 2020), which
allows the autonomous system to ensure relevant de-
cision making as a replacement for the human driver,
even in an “uncertain” environment.
Datasets are essential for the development of
learning-based decision-making systems. For the au-
tonomous car, several datasets are available, which
helps the emergence of these systems (Janai et al.,
2020). However, the ownership of railways by indus-
trial actors tends to increase the difficulty of design-
ing datasets to evaluate driving systems for the au-
tonomous train. Existing work mainly focuses on im-
proving the performance of low-level estimates such
as lane detection or semantic segmentation (Yurtsever
et al., 2020). The hypothesis under such efforts is
that these low level estimations are the basis of human
drivers’ high level driving operations. However, pre-
dicting driving commands or suggestions from these
low-level estimates has not been well studied. At
present, only a few datasets are available for the rail-
way domain, and of these, none is annotated in terms
of risk assessment (Pappaterra et al., 2021).
In this paper, we propose a new annotation frame-
work for the railway domain containing vision-based
annotated risk assessment data, called SMART-RD
(riSk assessMent frAmework foR auTonomous Rail-
way Driving). The annotations were performed on
the existing RailSem19 dataset (Zendel et al., 2019),
which is widely used for train scene understanding al-
gorithms in the railway domain. This dataset offers a
wide range of situations which are very suitable for
804
Bescop, J., Goeman, N., Aissaoui, A., Allaert, B. and Vandeborre, J.
SMART-RD: Towards a Risk Assessment Framework for Autonomous Railway Driving.
DOI: 10.5220/0012474300003660
Paper published under CC license (CC BY-NC-ND 4.0)
In Proceedings of the 19th International Joint Conference on Computer Vision, Imaging and Computer Graphics Theory and Applications (VISIGRAPP 2024) - Volume 2: VISAPP, pages
804-811
ISBN: 978-989-758-679-8; ISSN: 2184-4321
Proceedings Copyright © 2024 by SCITEPRESS – Science and Technology Publications, Lda.
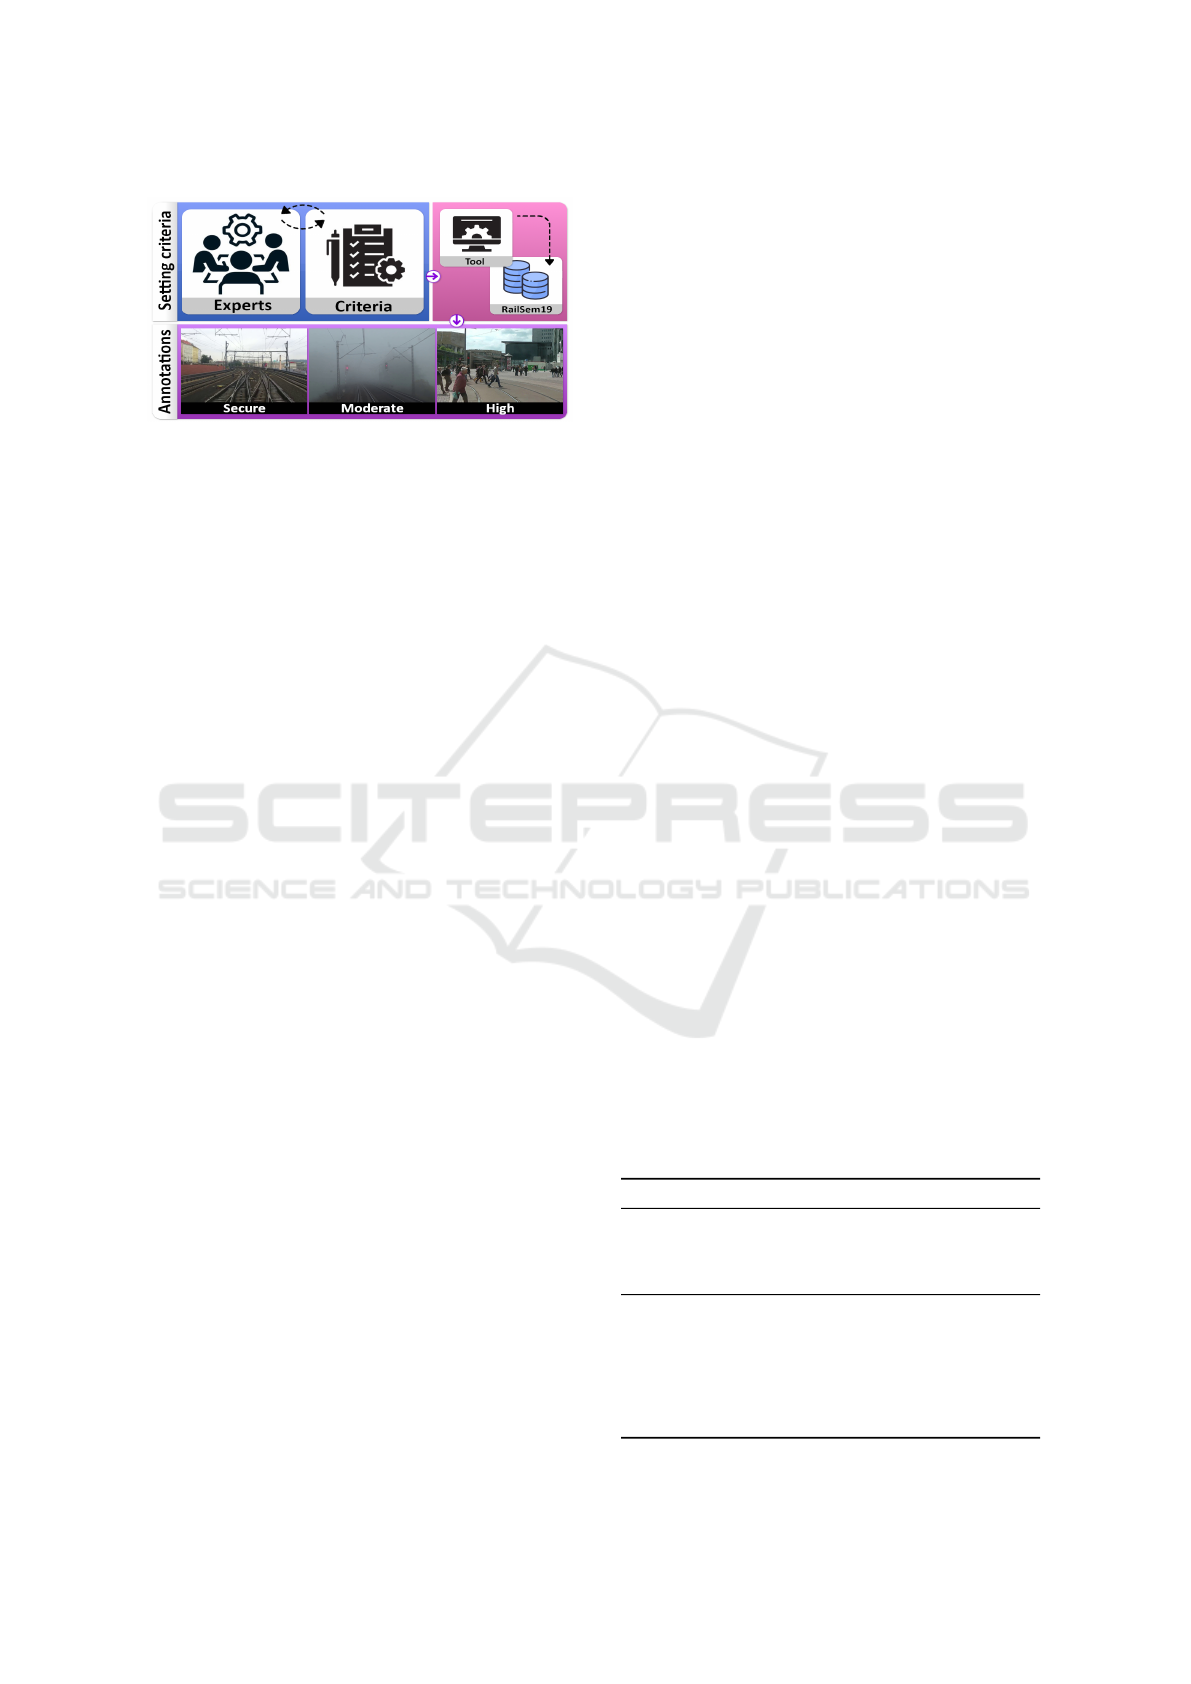
Figure 1: Overview of the SMART-RD framework.
risk assessment. As illustrated in Fig.1, the situations
are annotated according to three levels of risk, e.g.,
secure, moderate or high. These levels are defined by
a panel of three annotators, according to several cri-
teria: the context (rail profile, track protection), the
users (behavior, distance, density), the weather, and
the luminosity. Several evaluations have been carried
out to highlight the quality of the collected annota-
tions, and the feasibility of training a decision making
system based on these data.
The paper is structured as follows: Section 2
presents a position on the development of datasets to
train decision making systems to assess a risk for au-
tonomous driving. The design of the framework, from
the annotation protocol to the study of the collected
annotations, is given in Section 3. Section 4 contains
the evaluation of a first decision making system based
on our framework. A conclusion is made in section 5.
2 RELATED WORKS
Decision-making algorithms need to be trained and
evaluated on datasets in order to get a model with
a high generalization and to ensure the safety of the
system. To our knowledge, there are no annotated
datasets on risk assessment based on a vision system
in the railway domain. Therefore, the present analy-
sis is based on datasets designed for the automotive
domain, which we attempt to review in order to iden-
tify annotation strategies that can be reused for our
use case. Table 1 shows the different datasets pro-
posed in the literature on vision-based risk analysis
for autonomous car driving. Among the different cri-
teria that characterize a dataset, two major criteria are
analyzed: the annotation framework and the risk as-
sessment metric.
Annotation Framework. Annotation is a complex
task, requiring both time and energy from the anno-
tators. Moreover, decision making algorithms rely
on increasingly complex systems that require large
datasets with an exhaustive scenario panel. The de-
sign of an annotation framework requires some con-
sideration to identify the appropriate strategy provid-
ing a fast and efficient tool for annotators, while en-
suring high-quality annotations. To reduce the com-
plexity of the annotation process, several techniques
are used. Among these techniques, we distinguish
two categories. The first category relies on human an-
notation (Wang and Kato, 2017; Corcoran and Clark,
2019; Yurtsever et al., 2019), guaranteeing a high
level of analysis while reducing the quantity of an-
notated data. (Wang and Kato, 2017) assume that ac-
cidents are brief compared to other driving situations,
so they focus only on short video clips of a few sec-
onds to build their dataset, at the expense of scenario
variety. (Corcoran and Clark, 2019) propose to sim-
plify the annotation of a video sequence by applying
the same level of risk to the whole clip. However, this
technique can lead to misinterpreted risks as it doesn’t
consider temporal segmentation. The second category
relies on automatic techniques to annotate a large set
of data very quickly (Feth et al., 2018), sometimes at
the expense of a high level of analysis. (Feth et al.,
2018) use a video game to generate a large dataset on
which they apply an automatic metric that provides a
3D simulation-driven measurement. The ideal solu-
tion is to balance quality and quantity, but it’s compli-
cated due to the limitations of publicly datasets.
In addition to the annotation strategy, it is im-
portant to identify the criteria taken into account by
the annotators to evaluate a risk. All authors agree
that risk annotation is a tricky task and may vary be-
tween annotators depending on their interpretation of
the scene or different criteria, such as weather, light
or context. Besides synthetic datasets, other datasets
rely on the expertise of at least three annotators to
avoid ambiguity about a situation, although this does
not always guarantee a relevant annotation, which
Table 1: Vision-based risk analysis dataset for autonomous
driving. References: A-(Feth et al., 2018); B-(Wang
and Kato, 2017); C-(Corcoran and Clark, 2019) and D-
(Yurtsever et al., 2019).
References A B C D Our
Settings
Real ✗ ✓ ✓ ✓ ✓
Nb Data 110k 1,890 1,750 860 8,500
Type images video video video images
Availability ✗ ✗ ✗ ✗ ✓
Annotations
Labels score 3 levels 4 levels 5 levels 3 levels
Nb Anno. auto 3 + 1 3 10 3
Temporal ✗ ✓ ✗ ✗ ✗
Weather ✗ ✗ ✗ ✗ ✓
Light ✗ ✗ ✗ ✗ ✓
User ✗ ✗ ✗ ✗ ✓
Collision ✓ ✓ ✓ ✓ ✓
SMART-RD: Towards a Risk Assessment Framework for Autonomous Railway Driving
805

sometimes requires removing data in the initial set
(Corcoran and Clark, 2019). To reduce the large vari-
ability in the annotations, the risk is generally catego-
rized in three to five levels, ranging from safe (vehi-
cle at normal speed), to critical risk (unavoidable ac-
cident). The granularity of the levels varies between
datasets but a very strong overlap exists between all
of them. Concerning the annotation criteria, the time
to collision is generally taken into consideration by
the annotators, either directly estimated by an algo-
rithm (Feth et al., 2018), or interpreted according to
the driver’s viewpoint (Wang and Kato, 2017; Corco-
ran and Clark, 2019; Yurtsever et al., 2019). For this,
the analysis of the behavior of other road users is an
essential factor that is considered by the annotators to
estimate this metric. However, this information is not
integrated in the annotations. One dataset is distin-
guished by the availability of a temporal segmentation
of the evolution of the risk (Wang and Kato, 2017).
Risk Assessment Metric. Avoiding accidents is the
major task of the decision-making algorithms in au-
tonomous vehicles. Metrics such as time to collision
(Wang and Kato, 2017; Yurtsever et al., 2019) and
time headway (Feth et al., 2018) are often used to
achieve this task. (Feth et al., 2018) propose a risk
metric based on time headway that measures the dis-
tance between two vehicles. Although often used, this
metric is simplistic and does not take into account the
multiple elements of a situation, which often leads to
overestimate of risk. Furthermore, it only considers
the closest vehicle, which is very limited to a spe-
cific scenario, and less suited for the railway domain.
(Wang and Kato, 2017) propose a risk metric based
on the time to collision. Since accidents are uncom-
mon, they suggest to deal only with cases where ac-
cidents occur. The risk annotation is then defined in
three levels and time-segmented according to the time
to collision. This method is innovative, but their met-
ric is only based on the time to collision, and does not
take into account other elements.
To enhance risk metric reliability, (Corcoran and
Clark, 2019) incorporates multiple criteria, including
factors like the presence of other vehicles, vulnerable
road users, traffic flow, and weather, across four risk
levels. The authors acknowledge the complexity of
annotating various risk factors, leading to situations
being annotated at different levels by annotators. In
an effort to simplify annotation, a uniform risk level
is applied to entire video sequences, encompassing
risk-free segments. Although faster to annotate, this
method does not clearly identify the risk factors, and
induces bias in the training data.
3 SMART-RD FRAMEWORK
The proposed SMART-RD (riSk assessMent frAme-
work foR auTonomous Railway Driving) framework
is an extension of RailSem19 dataset (Zendel et al.,
2019). RailSem19 dataset includes 8500 unique im-
ages taken from an ego-perspective of a rail vehicle
(trains and tramways). Extensive semantic annota-
tions are provided, both geometry-based (track pro-
file) and dense label maps. One contribution of this
paper is to use the RailSem19 dataset to produce a
new set of annotations corresponding to the risk level
in each visual scene viewed from the perspective of
the driver.
3.1 Annotation Tools
Risk annotation involves describing the risk factors
that could cause potential damage (hazard identifica-
tion) and assessing the risk associated with those haz-
ards (risk analysis or risk assessment). Unfortunately,
there is no straightforward or unique method for de-
termining the risk level. Determining risk requires
knowledge of the activities in the field, the urgency of
the situations, and, most importantly, objective judg-
ment. A train operation risk assessment is a thor-
ough examination of various traffic situations to iden-
tify objects, situations and processes, that could harm
a vulnerable target, and to assess the likelihood and
severity of the risk, i.e., to determine the risk level. In
our assessment, the risk levels are defined into three
categories:
• Secure - visual scenes with no hazard, with a low
to no probability of incident (ideal driving situa-
tion);
• Moderate - visual scenes involving hazards with
a low to medium probability of causing an inci-
dent (normal driving situations);
• High - visual scenes with hazards having a high
probability of causing an incident (dangerous
driving situations).
For each of the RailSem19 dataset images,
SMART-RD brought risk annotations over 5 differ-
ent modalities often observed in the literature: general
risk, weather, light, users and context. The choice to
extract different risk categories answers the fact that
most of works in the literature struggle to assess the
risk directly. In the proposed framework, the gen-
eral risk is divided into the three risk levels aforemen-
tioned. The other modalities are broken down into 11
levels from 0 to 10. Fig. 2 illustrates the annotation
tool used to annotate the Railsem19 dataset. To avoid
VISAPP 2024 - 19th International Conference on Computer Vision Theory and Applications
806
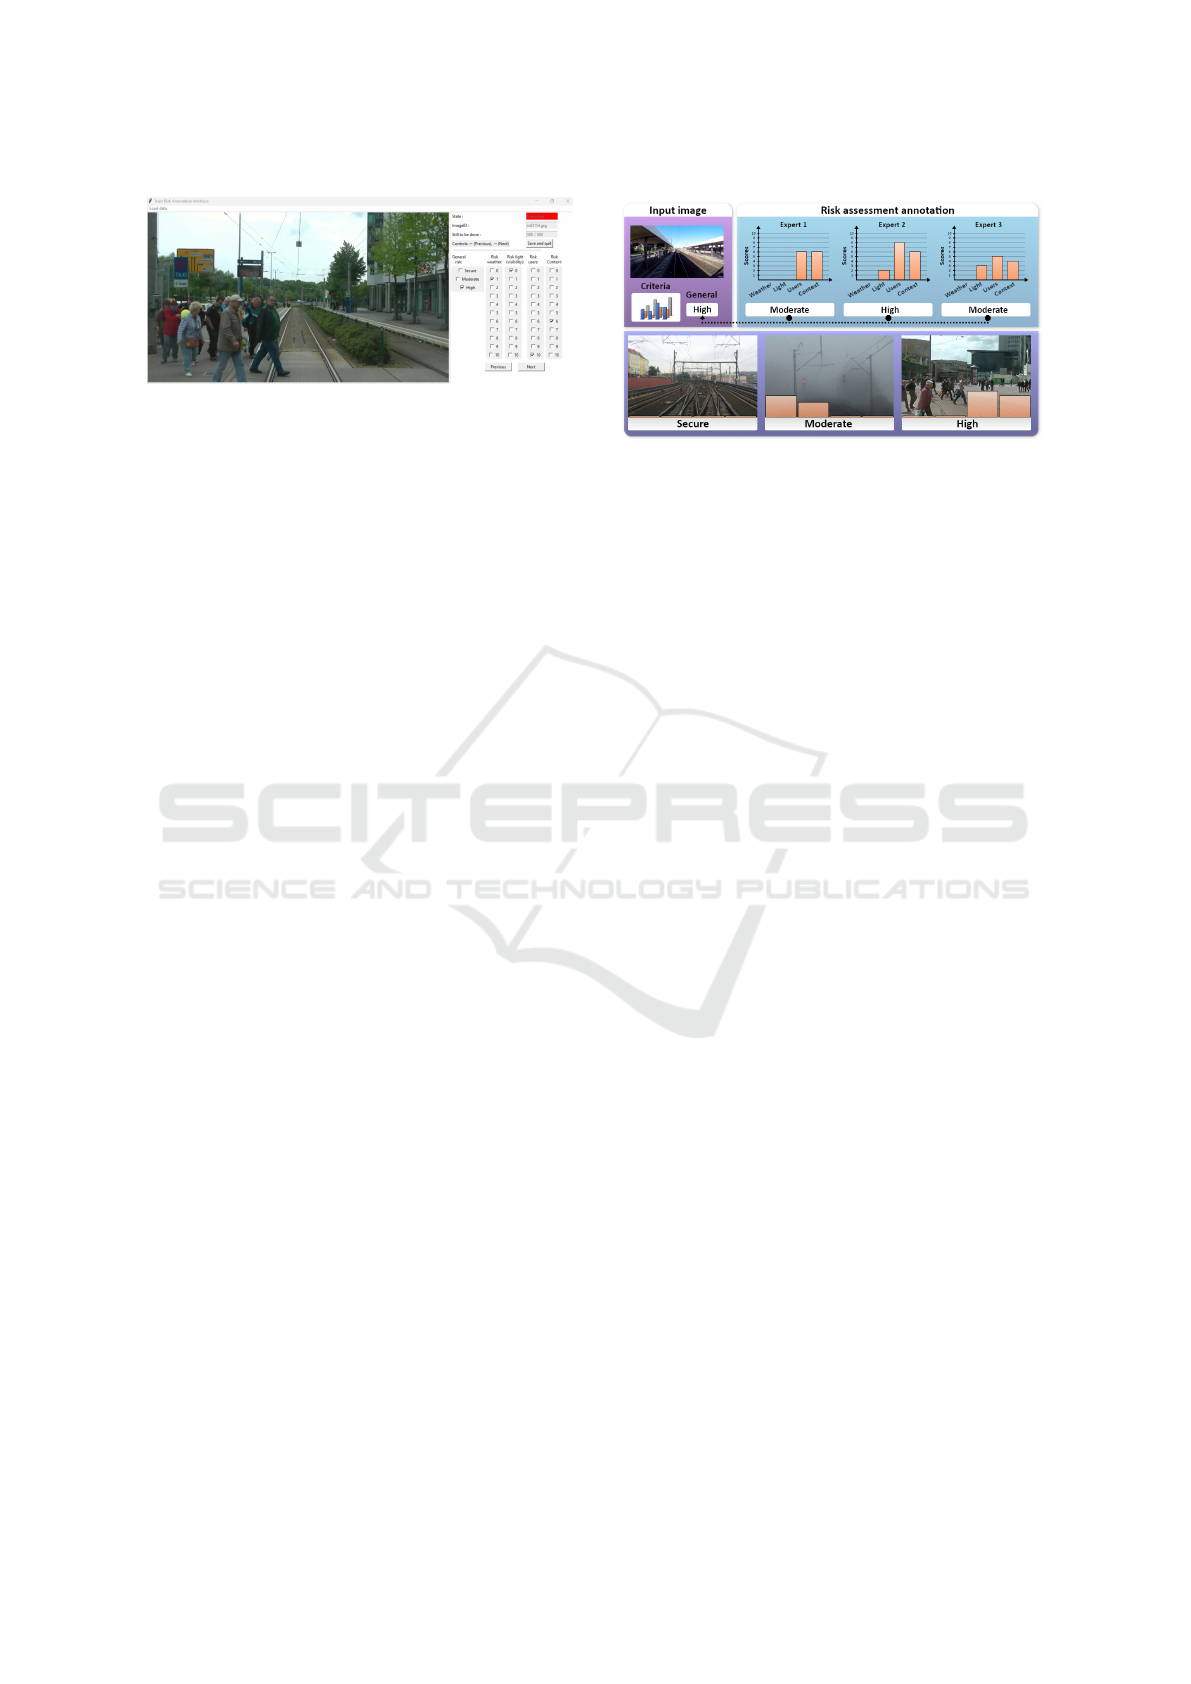
Figure 2: Risk annotation tools enabling to browse the
Railsem19 dataset and to associate a risk level based on 5
criteria: general risk, weather, light, users and context ac-
cording to 2 different scales.
annotation bias due to tiredness, the tool makes it pos-
sible to divide the dataset into subsets and pick up the
annotation process where it was left off.
3.2 Annotation Guidelines
In order to have a greater statistical significance, the
Railsem19 dataset is annotated by three different an-
notators. It allows to avoid outliers by applying an ag-
gregation method on the three annotations (mean, ma-
jority vote, max, etc.) Scenes with a strong disagree-
ment between annotators are also interesting since
they probably carry subtle elements that can induce a
switch in the risk assessment. They can therefore be a
topic of interest by their own. Instead of some work,
we voluntarily keep these occurrences in the dataset
since they might carry complex but interesting risk
features.
Risk assessment is a very subjective task. There-
fore, annotators have been given instructions in order
to keep a certain level of coherence between their re-
sults. Based on a first subset of the data, discussions
were held to adjust the evaluation criteria. For each
metric, a list of the different elements considered by
the annotators during the evaluation was established.
Weather. refers to the weather conditions and their
implications for the ego-vehicle and other users.
Weather is considered dangerous when visibility is
reduced (fog) or when it causes changes in track con-
ditions (slippery due to rain or snow). The accumu-
lation of these effects or the severity of the weather
conditions also influences the score, such as the fact
that snow covers the rail partially or totally.
Light. refers to the lighting condition in the scene.
The risk score varies depending on the amount of
light, but also on the contrast, for example at sunrise
and sunset. In some situations, light rays strongly re-
duce the visibility of the sensors, which makes deci-
sion making extremely difficult.
Figure 3: Proposed annotations in SMART-RD.
Users. refers to all other dynamic users of the scene.
The risk factor is mainly based on collision between
the vehicle and the user. Each obstacle is a potential
risk, whatever its nature (object, animal or person).
Several criteria are considered to evaluate the level of
danger that the obstacle represents. Size, estimated
speed, trajectory, distance from the vehicle and from
the lane, and density are criteria to consider. When it
comes to living obstacles (animals or people), behav-
ioral analysis is also an essential criterion, including
features like posture, gaze or attention in order to an-
ticipate the reaction of this user to the train passage.
Context. refers to the environment in which the
train is located. The risk factor is mainly related to the
conditions surrounding the train, such as the presence
of rail/road crossing and whether they are guarded or
not. It also depends on certain situations, such as en-
tering/leaving a station, passing through a tunnel, etc.
The infrastructures around the railroad can also
cause occlusions. The risk is even higher if the track
is not protected by barriers or if the train arrives at the
beginning of a curve, in which case, the sensors do
not cover the same field.
It is apparent that the annotation does not contain
all these details. However, having all the criteria used
to evaluate the situations, it is easier to design deci-
sion making algorithms to match the estimated scores
on each metric. Fig. 3 illustrates an example of anno-
tation performed on three images each corresponding
to one of the three general risk levels: secure, moder-
ate and high.
3.3 Annotation Correlation
In order to study inter-rater agreement, several sta-
tistical measures were performed: the Cronbach’s α
measures, the Intraclass Correlation Coefficient (ICC)
and the Krippendorff’s α measures. These measures
were performed for each modality in order to better
identify the correlation within the same metric, but
SMART-RD: Towards a Risk Assessment Framework for Autonomous Railway Driving
807
also between different metrics.
Cronbach’s α measures if a group of items, here
the annotators, attribute scores in a consistent way to
another collection of subjects, here the images. Its
definition is the following one:
α =
k
k − 1
(1 −
∑
k
n=1
σ
2
Y
n
σ
2
X
) (1)
where σ
2
Y
n
is the variance of the scores of n
th
item, σ
2
X
the total variance of the scores and k the number of
items, i.e. 3 in our case. A value of 0.8 is considered
(Nunnally, 1978) as a good threshold for the Cron-
bach’s α. The ICC scores are obtained through an
ANOVA-based framework using the pysch R module.
Similarly to the Cronbach’s α, the ICC ranges from
0 to 1. The common guidelines (Cicchetti, 1994) for
interpreting the ICC is the following one: fair agree-
ment between 0.4 and 0.59, good agreement between
0.6 and 0.74 and excellent agreement above. Finally
the Krippendorff’s α measures the ration between the
actual disagreement and the expected disagreement
by chance. Its values ranges from -1 to 1 with all
the negative values meaning a complete disagreement
and 1 a perfect agreement between raters. In general,
values larger than 0.667 can be considered to draw
conclusions.
From the scales given above and the results ob-
tained in Table 2, the three annotators share mainly
a same consistency in their annotations. The corre-
lation scores enable to distinguish two groups within
the modalities. The correlations between the anno-
tators is very strong for the ”weather”, ”light” and
”users” modalities while the ”general” and ”context”
modalities show less consistency through the metrics.
The common characteristic between the modalities of
the first group is that these are objective and explicit
features. The risk of weather or light leaves very little
room for personal interpretation. Similarly, the users
risk mainly depends on the number of users, their dis-
tances to the train, their position with respect to the
tracks or their body orientation which are all factual
and explicit features. The context modality is more
inconsistent since it carries subjectivity and requires
an in-depth analysis of the content in the scene. This
may explain why there is very few work in the litera-
ture on contextual risk analysis and much more on the
factual features mentioned above which are simpler
to estimate. Since the general risk strongly depends
on the context, i.e. annotators classify very few ru-
ral scenes as risky, the general risk also perceives this
decrease in consistency.
To further investigate the annotations provided by
the panel of annotators, it is interesting to consider the
correlations between the general risk score associated
Table 2: Different correlation scores applied on the anno-
tations made by the panel of annotators according to the 5
criteria to evaluate the risk. (↑) The closer the score is to 1,
the stronger the correlation is.
Metric General Weather Light Users Context
Kripp. α ↑ 0.59 0.72 0.74 0.78 0.68
ICC(3,1) ↑ 0.60 0.74 0.75 0.78 0.69
Cronbach’s α ↑ 0.82 0.89 0.90 0.91 0.85
with the situation, with respect to the different crite-
ria: weather, light, users and context. This analysis
is based on the Pearson score which can be computed
for two samples of random variables with the follow-
ing formula:
ρ
x,y
=
n
∑
x
i
y
i
−
∑
x
i
∑
y
i
q
n
∑
x
2
i
− (
∑
x
i
)
2
q
n
∑
y
2
i
− (
∑
y
i
)
2
(2)
where x
i
and y
i
are sample points of the two re-
spective random variables and n the size of both sam-
ples. From the graphs, the ”users” and ”context”
modalities are much more correlated with general
risk. Indeed, when the annotators put high values of
risk for these two modalities the general risk is most
of the time set to ”High” represented by the value 2 on
the graph. Annotators often qualify the general risk
as a collision risk and therefore give more weight to
these two modalities. The Pearson correlation coeffi-
cient of the ”users” and ”context” modalities with re-
spect to the general risk are 0.60 and 0.61 respectively
which can be considered as high values. There is also
a strong correlation (0.58) between the two modalities
themselves since a risky context is often considered
as a place where it is very likely to meet a user. How-
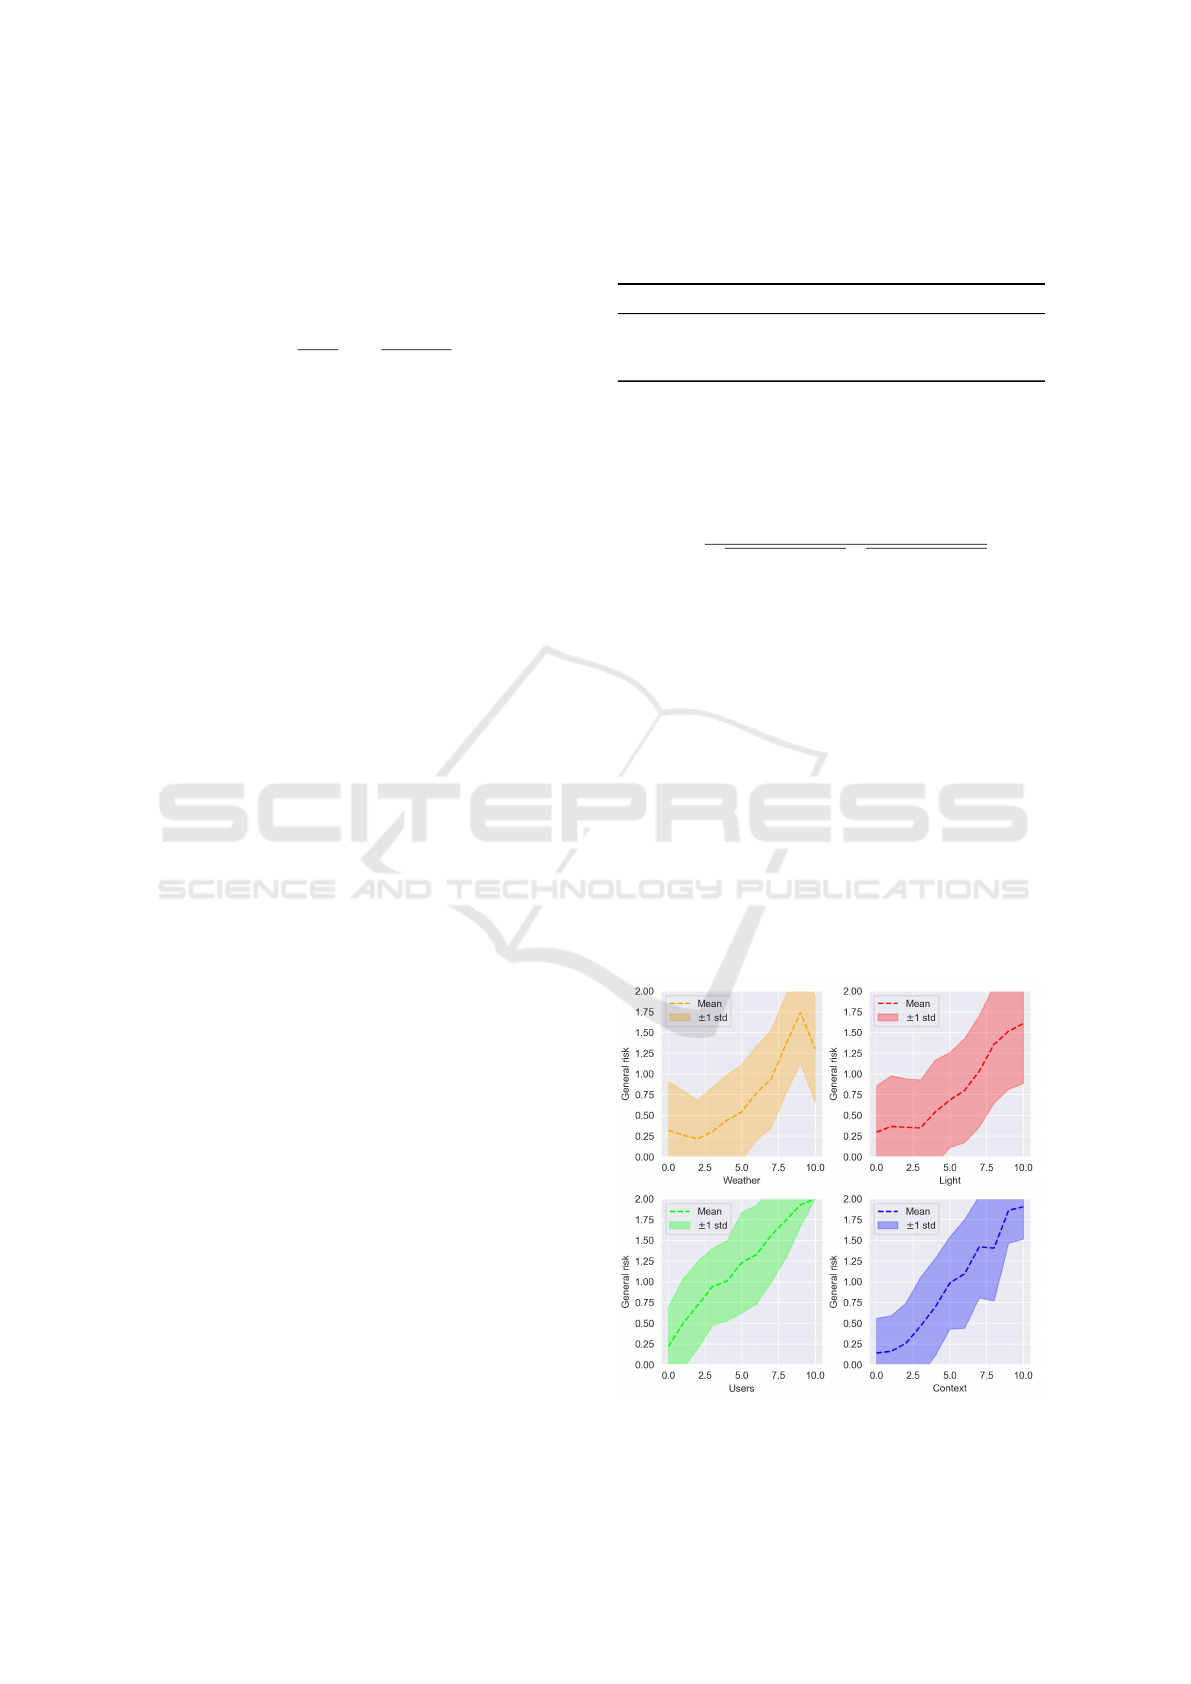
Figure 4: Mean general risk level for each value of the dif-
ferent criteria: weather, light, users and context.
VISAPP 2024 - 19th International Conference on Computer Vision Theory and Applications
808
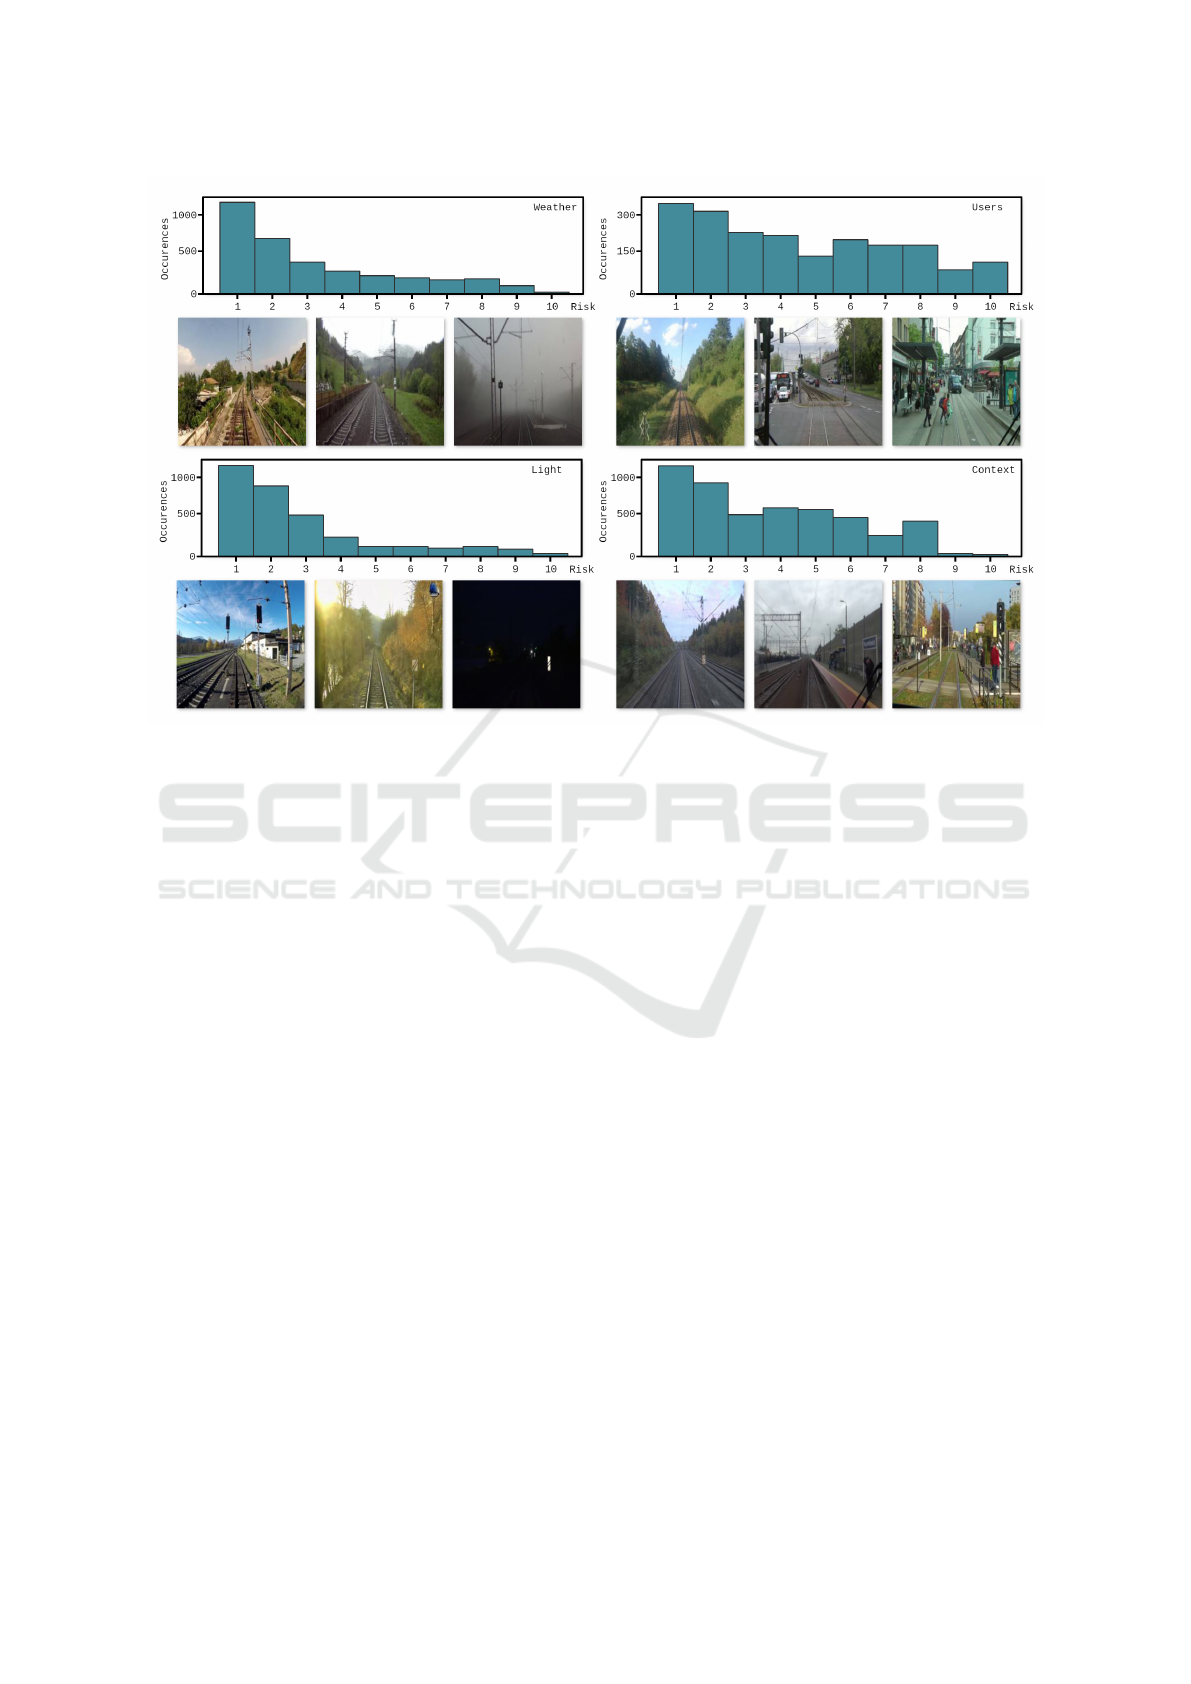
Figure 5: Distribution of data provided in SMART-RD according to each modality. Distribution histograms are enhanced by
three images extracted from the dataset, representing scores of 0, 5 and 10 respectively.
ever, this obviously does not imply that these modal-
ities are interchangeable. Indeed, a highly urbanized
area with no pedestrians cannot always be considered
as safe as they may appear from obstructed areas. The
”weather” and ”light” modalities can be rather seen as
exacerbating factors rather than risk causing factors.
Indeed, Fig. 4 also shows that the highest level of risk
for these modalities does not imply the highest level
of general risk. The correlation for low values with
the general risk is also very weak, i.e. annotators only
take these modalities into account for the general risk
when they reach relatively high values. This is again
reflected in the Pearson correlation coefficient of 0.23
and 0.27 for the ”weather” and ”light” modalities re-
spectively.
4 EXPERIMENTS
In this section, we propose several studies for the risk
assessment using the proposed benchmark. Using the
RGB images of the RailSem19 dataset (Zendel et al.,
2019) as input of a neural network, we perform a bi-
nary risk assessment: classification between secure
and risky based on the different data modalities, dif-
ferent models and different data aggregation methods.
4.1 Evaluation Protocol
Validation Protocol. In order to evaluate the de-
cision making model and to check the good perfor-
mance of the model when faced with unknown data, a
stratified k-fold cross validation protocol is used, with
k = 3. The data is partitioned into training and testing
sets following an 80/20 distribution. The reported ac-
curacy in the subsequent tables is derived from a bal-
anced subset of the test set. Additionally, for various
evaluations, the performances represent the average
accuracy calculated across the three folds, along with
the corresponding standard deviation.
Data Imbalanced. In risk analysis datasets, high-
risk situations are generally under-represented, lead-
ing to data imbalance. The same applies to the pro-
posed dataset, as illustrated in Fig. 5. First, to main-
tain the spatial coherence of the elements in the scene,
e.i., image centered on the rail and environment on the
sides, only a horizontal flip augmentation is applied.
Poor results have been observed by applying augmen-
tations on light changes or by adding noise (blur, dis-
tortion) to the images. Also, only a balanced sample
data was selected in the training and test tasks since
binary classes are very imbalanced and irregular be-
tween risk modalities.
SMART-RD: Towards a Risk Assessment Framework for Autonomous Railway Driving
809
4.2 Implementation Details
Two different models have been tested in this study
: a CNN, and a Vision Transformer (ViT) (Dosovit-
skiy et al., 2021). The ViT has been pretrained on
ImageNet-21k (Deng et al., 2009). The original clas-
sifier head has been removed which is the fully con-
nected one to replace it by a new one which fits our
binary classification problem. We only train this new
classifier since experiments have shown that unfreez-
ing the last convolutional layer does not provided sig-
nificant improvements. We implemented the model
in PyTorch and conducted experiments on a single
GeForce RTX 3060 GPU with 12GB VRAM. We em-
ployed the AdamW optimizer (Loshchilov and Hutter,
2019) with fixed learning rates of 0.01. The images
are resized to a 224x224 shape and normalized us-
ing the mean and standard deviation of the ImageNet
dataset (Deng et al., 2009). The batch size chosen is
of size 32. Each model are trained for 30 epochs.
4.3 Quantitative Experiment
A first baseline based on data annotated according to
a binary danger or non-danger classification and the
median aggregation function for labeling the risk level
according to the 3 annotations is proposed in Table 3.
We compare the performance of the CNN model and
ViT model pre-trained on ImageNET on the different
modalities selected by the annotator panel: general
risk (general), weather conditions, visibility (light),
presence of vulnerable road users (users) and driving
context related to the environment (context).
Considering the performances, the pre-trained
ViT model gives the best performance, whatever the
modality observed. Pre-training of the ImageNet-
based ViT model proves its effectiveness in dealing
with this task. Given the results obtained on the dif-
ferent modalities, the risk estimate based on visibil-
ity is relatively well identified across the two models.
Results for the other modalities vary widely from one
model to another. The performance observed with the
standard pre-trained ViT model encourages the use of
this type of architecture based on attention systems in
risk analysis.
To investigate the impact of subjective interpreta-
tion between annotators in model learning, a study of
aggregation functions is carried out in Table 4. The
functions correspond to the highest level of risk re-
ported by the 3 annotators (Max), the lowest (Min)
and the median (Median). For this study, only the
pre-trained Vit model is used, given its better per-
formance. Overall, considering the median score
gives better performance. With regard to the different
modalities, user-based risk is the most controversial
between the Min and Max annotations. Two obser-
vations may explain this result. Firstly, the accident
involving a human factor has a more serious deno-
tation from the driver’s point of view. In this case,
one of the annotators considered that a car crossing
the path of the train was less risky than a pedestrian.
Secondly, few variations in the annotations were ob-
served depending on the distance or position of the
users in relation to the train. Indeed, one of the an-
notators considered that a pedestrian waiting on the
platform did not represent a serious danger, whereas
the other annotators tended to put a high level of dan-
ger as soon as the train was at a certain distance from
the pedestrian, regardless of the context.
Human interpretation may have a slight impact on
risk annotation, particularly on the users and context
modalities, so a study presented in Table 5 is proposed
to determine which class separation strategy enhances
the model’s capacity to distinguish between risky and
not-risky situations. Several strategies have been pro-
posed, in the following format (non-risk score cate-
Table 3: Comparison of the performance of learning mod-
els on the binary classification task on different modalities
involving a risk for driving.
Methods General Weather Light Users Context
CNN
65,67% 64,67% 73,67% 68,67% 69,00%
± 2,08 ± 2,08 ± 1,53 ± 8,39 ± 5,20
ViT pre.
77,67% 76,00% 75,33% 81,33% 76,00%
± 2,08 ± 2,65 ± 7,37 ± 3,51 ± 1,00
Table 4: Comparison of the data aggregation functions used
with the pretrained vision transformers.
Aggregation General Weather Light Users Context
Maximum
77,00% 75,33% 74,00% 79,67% 74,33%
± 0,00 ± 4,16 ± 3,00 ± 3,21 ± 1,53
Minimum
72,33% 69,67% 75,67% 66,00% 79,33%
± 3,21 ± 3,79 ± 3,06 ± 3,61 ± 8,33
Median
77,67% 76,00% 75,33% 81,33% 76,00%
± 2,08 ± 2,65 ± 7,37 ± 3,51 ± 1,00
Table 5: Comparison of the binary class (risky (R) and non-
risky (R)) separation methods used with the pretrained ViT.
Strategy Separation Weather Light Users Context
S1
R:(0) 70,67% 87,00% 81,67% 77,33%
R:(1-10) ± 6,66 ± 3,00 ± 5,86 ± 4,51
S2
R:(0) 86,33% 94,33% 80,67% 88,67%
R:(6-10) ± 4,51 ± 1,53 ± 7,51 ± 5,03
S3
R:(0-2) 80,33% 86,00% 66,67% 80,00%
R:(3-10) ± 4,51 ± 1,00 ± 5,03 ± 2,65
S4
R:(0-5) 77,00% 93,33% 77,67% 77,00%
R:(6-10) ± 10,44 ± 2,31 ± 6,11 ± 4,58
VISAPP 2024 - 19th International Conference on Computer Vision Theory and Applications
810

gories, risk score categories) : S1 {(0),(1-10)} ; S2
{(0),(6-10)} ; S3 {(0-2),(3-10)} and S4 {(0-5),(6-
10)}. In view of the performances, the S2 strategy
is the most suitable for risk discrimination between
the different modalities. By excluding low scores, it’s
easier to separate the R and R classes. Small scores
are often more open to human interpretation, and tend
to vary between different users, particularly with re-
gard to user-based risk.
5 CONCLUSIONS
We propose the first framework on risk analysis
for autonomous railway driving, named SMART-RD.
Based on the RailSem19 dataset, SMART-RD pro-
vides additional annotations on the general risk based
on weather, light, users and context. A first study is
performed on these data according to a binary dan-
ger or non-danger classification. The proposed base-
line is based on traditional learning models in image
processing and does not take into account recent ad-
vances in the literature for risk analysis. In future
work, we explore more complex decision models bet-
ter adapted to risk assessment, taking into account the
per-modality annotation to assess the general risk.
REFERENCES
Cicchetti, D. (1994). Guidelines, criteria, and rules of
thumb for evaluating normed and standardized assess-
ment instrument in psychology. Psychological Assess-
ment, 6:284–290.
Corcoran, G.-P. and Clark, J. (2019). Traffic Risk As-
sessment: A Two-Stream Approach Using Dynamic-
Attention. In 2019 16th Conference on Computer and
Robot Vision (CRV), pages 166–173, Kingston, QC,
Canada. IEEE.
Deng, J., Dong, W., Socher, R., Li, L.-J., Li, K., and Fei-
Fei, L. (2009). Imagenet: A large-scale hierarchical
image database. In 2009 IEEE Conference on Com-
puter Vision and Pattern Recognition, pages 248–255.
Dosovitskiy, A., Beyer, L., Kolesnikov, A., Weissenborn,
D., Zhai, X., Unterthiner, T., Dehghani, M., Minderer,
M., Heigold, G., Gelly, S., Uszkoreit, J., and Houlsby,
N. (2021). An image is worth 16x16 words: Trans-
formers for image recognition at scale.
Feth, P., Akram, M. N., Schuster, R., and Wasenm
¨
uller,
O. (2018). Dynamic Risk Assessment for Vehicles
of Higher Automation Levels by Deep Learning. In
Hoshi, M. and Seki, S., editors, Developments in
Language Theory, volume 11088, pages 535–547.
Springer International Publishing, Cham. Series Ti-
tle: Lecture Notes in Computer Science.
Grigorescu, S., Trasnea, B., Cocias, T., and Macesanu,
G. (2020). A survey of deep learning techniques
for autonomous driving. Journal of Field Robotics,
37(3):362–386.
Guo, J., Junyao Guo, Kurup, U., Shah, M., and Shah, M.
(2020). Is it Safe to Drive? An Overview of Factors,
Metrics, and Datasets for Driveability Assessment in
Autonomous Driving. IEEE Transactions on Intelli-
gent Transportation Systems, 21(8):3135–3151.
Janai, J., G
¨
uney, F., Behl, A., and Geiger, A. (2020).
Computer vision for autonomous vehicles: Problems,
datasets and state of the art. Foundations and Trends®
in Computer Graphics and Vision, 12(1–3):1–308.
Kuutti, S., Bowden, R., Jin, Y., Barber, P., and Fallah,
S. (2021). A Survey of Deep Learning Applications
to Autonomous Vehicle Control. IEEE Transactions
on Intelligent Transportation Systems, 22(2):712–733.
Conference Name: IEEE Transactions on Intelligent
Transportation Systems.
Loshchilov, I. and Hutter, F. (2019). Decoupled weight
decay regularization. In International Conference on
Learning Representations.
Nunnally, J. C. (1978). Psychometric theory / Jum C. Nun-
nally. McGraw-Hill New York, 2d ed. edition.
Pappaterra, M. J., Flammini, F., Vittorini, V., and Be
ˇ
sinovi
´
c,
N. (2021). A Systematic Review of Artificial Intelli-
gence Public Datasets for Railway Applications. In-
frastructures, 6(10):136. Number: 10 Publisher: Mul-
tidisciplinary Digital Publishing Institute.
Van Brummelen, J., O’Brien, M., Gruyer, D., and Najjaran,
H. (2018). Autonomous vehicle perception: The tech-
nology of today and tomorrow. Transportation Re-
search Part C: Emerging Technologies, 89:384–406.
Vargas, J., Alsweiss, S., Toker, O., Razdan, R., and Santos,
J. (2021). An Overview of Autonomous Vehicles Sen-
sors and Their Vulnerability to Weather Conditions.
Sensors, 21(16):5397.
Wang, Y. and Kato, J. (2017). Collision Risk Rating of
Traffic Scene from Dashboard Cameras. In 2017 In-
ternational Conference on Digital Image Computing:
Techniques and Applications (DICTA), pages 1–6.
Yurtsever, E., Lambert, J., Carballo, A., and Takeda, K.
(2020). A Survey of Autonomous Driving: Common
Practices and Emerging Technologies. IEEE Access,
8:58443–58469.
Yurtsever, E., Liu, Y., Lambert, J., Miyajima, C., Takeuchi,
E., Takeda, K., and Hansen, J. H. L. (2019). Risky
Action Recognition in Lane Change Video Clips us-
ing Deep Spatiotemporal Networks with Segmenta-
tion Mask Transfer. In 2019 IEEE Intelligent Trans-
portation Systems Conference (ITSC), pages 3100–
3107.
Zendel, O., Murschitz, M., Zeilinger, M., Steininger, D.,
Abbasi, S., and Beleznai, C. (2019). RailSem19:
A Dataset for Semantic Rail Scene Understanding.
In 2019 IEEE/CVF Conference on Computer Vision
and Pattern Recognition Workshops (CVPRW), pages
1221–1229. ISSN: 2160-7516.
Zhang, Y., Carballo, A., Yang, H., and Takeda, K. (2023).
Perception and sensing for autonomous vehicles under
adverse weather conditions: A survey. ISPRS Journal
of Photogrammetry and Remote Sensing, 196:146–
177.
SMART-RD: Towards a Risk Assessment Framework for Autonomous Railway Driving
811
