
Evaluation of Approximate Reflectional Symmetry
Martin Ma
ˇ
n
´
ak
1 a
, David Podgorelec
2 b
and Ivana Kolingerov
´
a
3 c
1
New Technologies for the Information Society (NTIS), University of West Bohemia,
Univerzitn
´
ı 8, 301 00 Pilsen, Czech Republic
2
Faculty of Electrical Engineering and Computer Science, University of Maribor,
Koro
ˇ
ska cesta 46, SI-2000 Maribor, Slovenia
3
Department of Computer Science and Engineering, Faculty of Applied Sciences, University of West Bohemia,
Univerzitn
´
ı 8, 301 00 Pilsen, Czech Republic
Keywords:
Symmetry, Approximate, Visualization, Evaluation.
Abstract:
When an object can be split by a plane into two symmetrical parts, one being the mirrored image of the other,
the object has a reflectional symmetry with respect to that plane. The symmetry is often only approximate and
not necessarily global. Many algorithms exist for the detection of symmetries and there are various applica-
tions utilizing symmetrical properties. Yet there are not so many ways to measure the amount of approximate
reflectional symmetry. In this paper, we introduce a method for the evaluation of approximate symmetry for
objects represented as a point cloud. The method consists of three parts - a relative symmetry distance for
measuring the amount of approximate reflectional symmetry, a plot of relative errors, and visualization of
errors. This method offers a way how to compare different objects by the amount of symmetry and improves
understanding of the symmetrical properties of objects, both quantitatively and visually.
1 INTRODUCTION
Symmetry is an important property of many real-
world objects as well as artificially created objects.
An object is symmetrical, if there is a transformation
(distance preserving, except identity) that maps the
object onto itself, hence the object is invariant under
the transformation. A typical example is reflectional
symmetry when an object can be split into two parts
perfectly mirrored by a plane. However, real-world
objects are hardly ever perfectly symmetrical. Even
if an object can be perceived as symmetrical, it can
have minor variations and imperfections, some parts
may be missing, etc. The symmetry can still be rec-
ognized but it is only an approximate symmetry.
Many methods for the detection of approximate
symmetries exist. In our work, we use robust, fast and
flexible symmetry plane detection based on differen-
tiable symmetry measure by (Hruda et al., 2022b).
For an object in a point cloud representation, we can
hence obtain one or more planes of its reflectional
symmetries.
a
https://orcid.org/0000-0002-1248-7042
b
https://orcid.org/0000-0002-0701-9201
c
https://orcid.org/0000-0003-4556-2771
The most important part of Hruda’s symmetry de-
tection method is a function for symmetry measure-
ment. It is a function evaluating the given object and
a plane of reflectional symmetry. Finding the best
plane is then done as locating the maxima of this
function in transformation space. The contribution
of each reflected point to the overall amount of sym-
metry is computed by summing up the distances to
neighboring points. It is a weighted sum, where more
distant points get lower weights than closer points.
Wendland’s function is used instead of Gaussian for
weights because it has limited support and is differ-
entiable. The final value of the symmetry measure
depends on the number of points, Wendland’s func-
tion support radius, and the local density of points.
These parameters are constant for a single object but
they may be different for others. Therefore, Hruda’s
symmetry measure is not well suited for comparing
multiple objects.
The problem addressed by this paper is how to
measure the quality of the detected symmetry. If we
detect approximate symmetries in several mutually
different objects, we want to distinguish more sym-
metrical objects from the less symmetrical ones. We
propose a new relative symmetry distance for measur-
ing the amount of reflectional symmetry of an object
734
Ma
ˇ
nák, M., Podgorelec, D. and Kolingerová, I.
Evaluation of Approximate Reflectional Symmetry.
DOI: 10.5220/0012472800003660
Paper published under CC license (CC BY-NC-ND 4.0)
In Proceedings of the 19th International Joint Conference on Computer Vision, Imaging and Computer Graphics Theory and Applications (VISIGRAPP 2024) - Volume 1: GRAPP, HUCAPP
and IVAPP, pages 734-740
ISBN: 978-989-758-679-8; ISSN: 2184-4321
Proceedings Copyright © 2024 by SCITEPRESS – Science and Technology Publications, Lda.

and for the comparison of different objects. The dis-
tance is based on relative errors. It is invariant to the
rotation, translation and scale of the input object. Fur-
thermore, we introduce an error plot and a coloring
scheme, which help to understand the symmetrical
content of the object both quantitatively and visually.
The proposed method is demonstrated in a few ex-
amples and compared against Hruda’s differentiable
symmetry measure.
2 RELATED WORK
Symmetry has been studied extensively from many
perspectives, e.g., psychological (Bertamini et al.,
2018), mathematical (Bizzarri et al., 2022), compu-
tational, possible applications, etc. Many different
methods for the detection of reflectional symmetries
(and also other types of symmetry) have already been
developed, e.g. PRST transform by (Podolak et al.,
2006), a few methods by (Mitra et al., 2006) (Mi-
tra et al., 2013), including an interesting application
(symmetrization) for transforming otherwise asym-
metric shapes to their initial symmetric poses by (Mi-
tra et al., 2007), or the method by (Hruda et al.,
2022b) using a differentiable symmetry measure. Re-
cently, (Hruda et al., 2022a) presented an idea for the
detection of rotational symmetry, using two reflec-
tional symmetry planes.
Regarding approximate symmetry evaluation,
there are a few options. An object A and its trans-
formed image B = T (A) could be compared for sim-
ilarity using standard statistical measures, e.g., inter-
section over union
J(A,B) =
|A ∩ B|
|A ∪ B|
(1)
(also known as the Jacard/Tanimoto coefficients).
However, this approach would require objects with
closed boundaries. Another option is to use Hausdorff
distance. Although this distance is very sensitive to
outliers, a solution exists (Maiseli, 2021). Neverthe-
less, missing or extruding object parts are the problem
with approximate symmetry, not single-point outliers.
Perhaps more suitable is the Metro tool
by (Cignoni et al., 1998). This tool was devel-
oped for measuring the error for meshes and their
simplifications, e.g., multiple levels of detail. It
outputs, among other characteristics, the mean error
and the maximal error between two surfaces (one of
them is sampled and the sample-to-surface distances
are computed for each sample). The mean error
is computed as the error distance integral over the
whole surface divided by the surface area. These two
surfaces would correspond to our object A and its im-
age B. The maximal error is the Hausdorff distance.
This tool has been used successfully by (Hruda et al.,
2022b) for evaluating the symmetry planes from their
symmetry detection framework against a view-based
symmetry detection approach by (Li et al., 2016) and
against a clustering-based approach by Shi et al. (Shi
et al., 2016). Besides absolute errors, Metro also
outputs relative errors expressed as the percentage of
the bounding box diagonal. However, the bounding
box diagonal is a global characteristic sensitive to
the overall shape of the object. Therefore, we do not
consider it so much suitable for the evaluation of
approximate symmetry. Unless, of course, the object
fits tightly to its bounding box.
There also is the symmetry distance proposed
by (Zabrodsky et al., 1993). The idea is that symme-
try should be treated as a continuous measure rather
than a binary decision (symmetric/asymmetric). They
suggest measuring the minimum effort necessary to
turn a shape into a symmetric shape. This effort is
measured as the sum of squared distances moved by
points of the shape, i.e.,
SD =
1
n
n−1
∑
i=0
||P
i
−
ˆ
P
i
||
2
, (2)
where P
i
is a point of the shape P and
ˆ
P the symmetry
transform. The distance is invariant to rotation and
translation. Invariance to scale is provided by scaling
the object so that the maximum distance from the ob-
ject centroid is constant. As we already mentioned,
such scaling can be very sensitive to outliers and ex-
truding object parts.
Coloring objects for the visualization of symme-
try plane and surface errors is not new. He et al. (He
et al., 2020) use a technique similar to ours for high-
lighting object parts in the corresponding symme-
try half-spaces. A heat map is used in the Metro
tool (Cignoni et al., 1998) to visualize errors. This
is a common technique, nevertheless, we consider our
coloring scheme worth including because it clearly il-
lustrates the development of approximate symmetry
on a given object.
Sometimes, coloring can be used just as a hint
where symmetry occurs locally. The symmetry de-
tection method by (Podgorelec et al., 2023) is spe-
cialized for Earth observation data. The acquisition
of such data (e.g. LiDAR) cannot provide exact pairs
of symmetric elements and, therefore, the method is
strictly focused on approximate symmetries, which is
accomplished by voxelization. The algorithm detects
all partial symmetries for a chosen voxel resolution,
identifies local and global symmetries among them,
and measures the amount of each individual symme-
Evaluation of Approximate Reflectional Symmetry
735

try within the entire input dataset. The method does
not evaluate approximate symmetry explicitly, but it
gives the obvious hint that in partial or local symme-
try, it is sufficient to consider the points contained in
the voxels of symmetric pairs.
3 PROPOSED METHOD
Here we present our method for the evaluation of ap-
proximate reflectional symmetry of objects with re-
spect to their symmetry planes. The input to our
method is an object represented as a point cloud.
If no symmetry plane is given, it will be computed
by (Hruda et al., 2022b) method. The output consists
of quantitative and visual characteristics, suitable for
inter-object comparisons and evaluation. The key as-
pects are discussed in the following subsections.
3.1 Relative Symmetry Error
Let p be any point of the input object and R be the
given plane of reflective symmetry. The symmetry
transforms p to its image p
′
. Since the object may
be only approximately symmetrical, p
′
will not nec-
essarily be part of the input object but it may be close.
We take the closest point of the input object (from the
same side of R where also p
′
lies) as the best sym-
metrical counterpart of p. Since the input object is a
point cloud, the closest point is the nearest neighbor
of p
′
as measured by the Euclidean distance from p
′
as depicted in Figure 1. The error is measured as
E
relative
=
d
2
d
1
, (3)
where d
1
is the Euclidean distance of p
′
from p and d
2
is the Euclidean distance of nn(p
′
) from p
′
. The er-
ror is relative. If we consider a tolerance threshold,
e.g., 5%, small symmetry transformation distances
(d
1
) would have a small absolute tolerance and larger
transformation distances will have larger absolute tol-
erances.
To quickly find the nearest neighbor of a point,
we utilize the R-tree spatial index (Guttman, 1984)
from the C++ Boost Geometry Library with the av-
erage time complexity O(log n) per query. Other in-
dexing structures could be used as well, e.g., a spatial
grid, a k-d tree, an octree, etc.
3.2 Symmetry Error Plot for all Points
Inspecting the relative error at each point individually
would not provide much information about the sym-
metry of the whole object. We need to look at these
p
nn(p')
p'
R
d
1
/2
d
2
d
1
Figure 1: The relative error for the point p is the fraction
d
2
/d
1
. Here, nn(p’) is the nearest neighbor of p’, the sym-
metric image of p, found in the half-space containing p’.
pieces of information together. Therefore, we first
sort the points by their relative errors in ascending or-
der. Then we consider a 2-dimensional error plot as
illustrated in Figure 2, where the x-axis represents the
sorted points in the normalized range < 0,1 > and the
y-axis represents their relative errors.
If the whole object was perfectly symmetrical, the
vast majority of values in the error plot would be zero.
In reality, they will be almost zero, shifted a little bit
in the positive direction of the y-axis, because of the
point cloud representation of the object and the in-
herent discrete sampling. Even for an approximately
symmetrical object, the vast majority of values in the
error plot will be close to some tolerance threshold
(a constant on the y-axis) distinguishing symmetry
from asymmetry. However, it can be tricky to set a
specific (low enough) tolerance threshold beforehand,
because the object may only be partially symmetric.
3.3 The Symmetry Threshold Point
The error plot of a strongly symmetrical object will
resemble the vertically mirrored letter L as illustrated
in Figure 2. We define the symmetry tolerance thresh-
old point T = (T
x
,T
y
) as the point of the error plot
minimizing the Euclidean distance from the lower
right corner (1,0) and measure the distance
d =
q
(1 − T
x
)
2
+ T
2
y
(4)
to characterize the overall amount of approximate
symmetry of a given object. The more symmetrical
the object is, the more its error plot approaches the
x-axis, T approaches (1, 0), and d approaches zero.
Only the points to the left of T
x
in the error plot are
symmetrical with relative errors up to T
y
. The dis-
tance d combines both these quantities into one. It
IVAPP 2024 - 15th International Conference on Information Visualization Theory and Applications
736
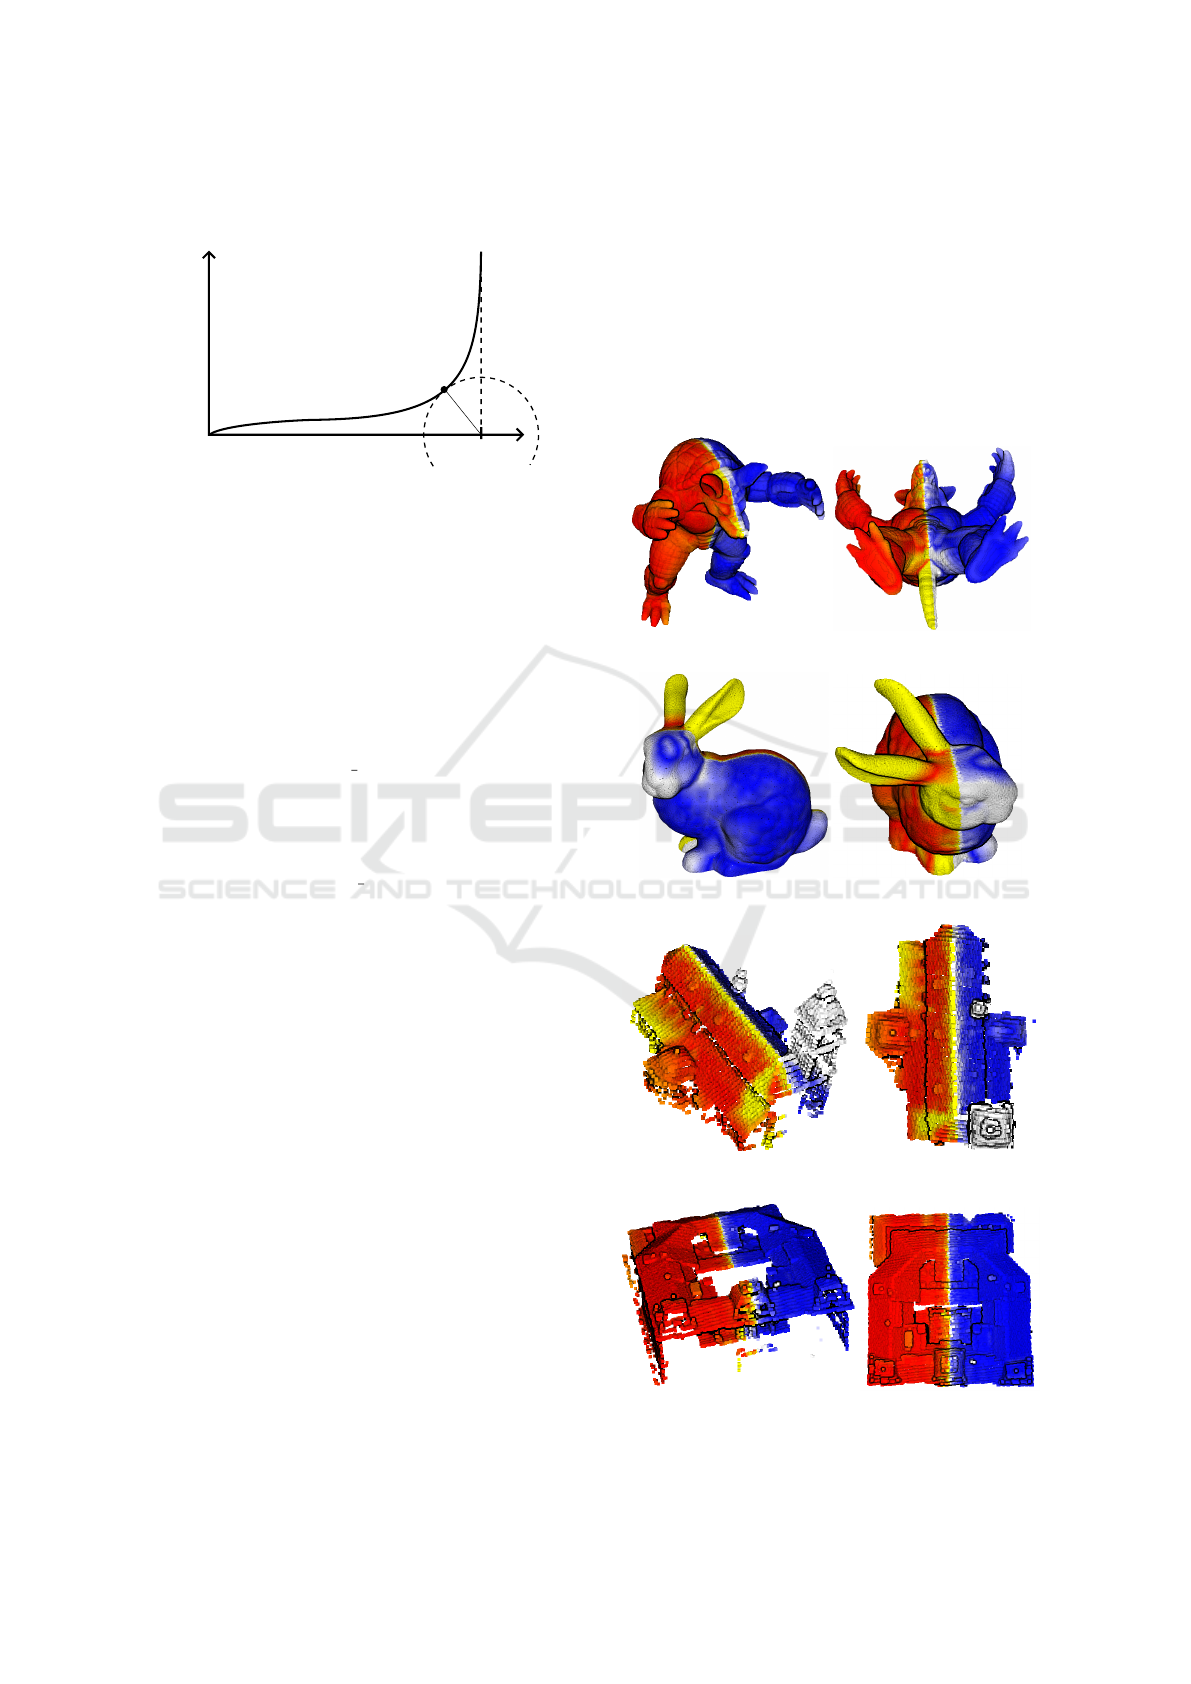
also gives us an initial guess that at least 1 − d of the
whole object is within the error limit d.
0 1
x: points
y: relative error
T
Figure 2: The error plot and the threshold point T.
3.4 Visualization
We use a coloring scheme, where points on the op-
posite sides of the symmetry plane have two different
basic colors, e.g., red and blue. These basic colors
are then linearly interpolated to colors highlighting
the relative symmetry error, e.g., yellow and white.
If we want to emphasize relative errors in a certain
range, e.g., up to 20%, we will set the interpolation
factor
f = min(rel error/0.2, 1). (5)
However, this range may be too generous for strongly
symmetric models or too strict for weakly symmetric
models. In such situations, we can set
f = min(rel error/T
y
,1) (6)
and the whole interpolation range will be dedicated to
points that are considered symmetric with respect to
the automatically detected threshold point T .
4 EXPERIMENTS AND RESULTS
The general applicability and properties of the pro-
posed symmetry evaluation approach are demon-
strated on a few models - the Stanford Armadillo and
Bunny (Levoy et al., 2005), two historical buildings,
namely the Maribor Cathedral and the University of
Maribor at GPS location 46.5592, 15.6442 (
ˇ
Zalik,
2023), a statue and a component, both coming from
the Thingi10K dataset (Zhou and Jacobson, 2016).
Armadillo, Bunny and the statue are two examples of
bilaterally symmetrical beings in more or less asym-
metrical poses. Approximate symmetry in the two
buildings and the component is present due to archi-
tectural or constructional intents. Whereas the point
clouds of Armadillo, Bunny, the statue, and the com-
ponent were obtained artificially by sampling the tri-
angular meshes, the point clouds of buildings come
from aerial LiDAR scanning and hence they may have
some imperfections, e.g., under-sampled or missing
vertical regions, irregular sampling, noise, etc.
For all these models, we detected the major sym-
metry plane using (Hruda et al., 2022b) symmetry de-
tection framework, computed the corresponding error
plots, found the symmetry threshold point T and its
relative symmetry distance d, and colored the point
clouds with respect to the detected plane and errors.
The results are depicted in Figures 3, 4, 5, 6 and 7.
Figure 3: Armadillo - relative symmetry distance d = 0.132.
Figure 4: Bunny - relative symmetry distance d = 0.267.
Figure 5: Cathedral - relative symmetry distance d = 0.273.
Figure 6: University - relative symmetry distance 0.098.
Evaluation of Approximate Reflectional Symmetry
737
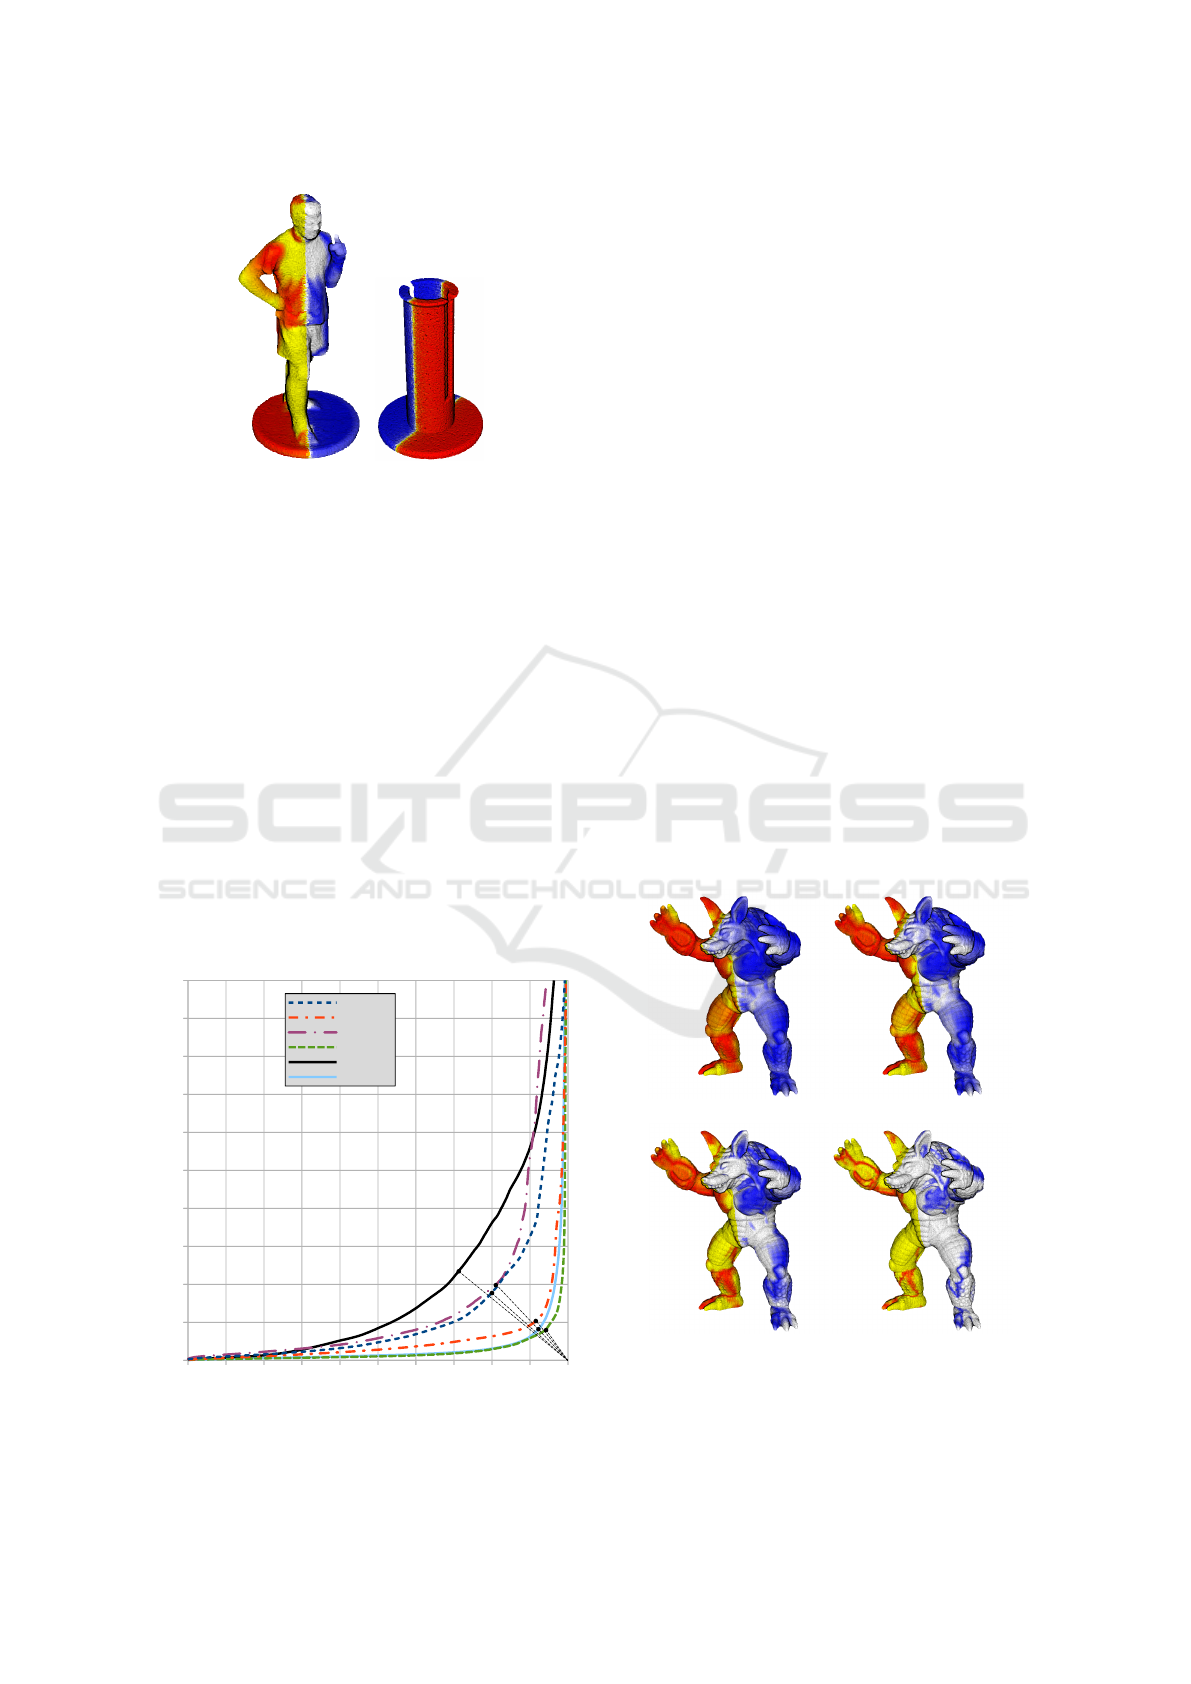
Figure 7: Statue - d = 0.370; Component - d = 0.111.
When these objects are sorted by the proposed rel-
ative symmetry distance, the most symmetric object is
the university building (0.098), followed by the com-
ponent (0.111), Armadillo (0.132), Bunny (0.267),
the cathedral (0.273), and the statue (0.370). Red
and blue regions indicate strongly symmetric regions,
whereas strictly yellow and white regions indicate rel-
ative errors of 0.2 (20%) or more. The visualization
shows that Armadillo is in a symmetric pose with a
slight asymmetry of arms, fingers and tail. Bunny is in
a more asymmetric pose with a slightly rotated head
and ears and these body parts are relatively larger
when compared against Armadillo. The symmetry of
the cathedral is violated by its main tower, a smaller
tower, and a side roof. The symmetry of the statue
is dominated by the rounded pedestal and ruined by
the rotated torso and body parts. The symmetry of the
component seems to be almost perfect. Its nonzero
relative symmetry distance can be attributed to a rela-
tively low sampling density and a slightly higher per-
0 0.1 0.2 0.3 0.4 0.5 0.6 0.7 0.8 0.9 1
0
0.1
0.2
0.3
0.4
0.5
0.6
0.7
0.8
0.9
1
Bunny
Armadillo
Cathedral
University
Statue
Component
points
relative error
Figure 8: Error plots for the tested models.
centage of points near the symmetry plane. The cor-
responding error plots of these objects are depicted in
Figure 8 together with the threshold points and their
attraction line to the ideal point < 1,0 >.
Visualization also shows that points near the sym-
metry plane usually have a large relative error despite
their absolute error may be small. Sampling irregu-
larity can play some role here but it is more likely
that the detected symmetry plane cannot fully reflect
all the small violations of symmetry, e.g., Armadillo’s
tail and muzzle in Figure 3 are slightly off the detected
plane but the plane is globally better for many more
other points. The effect of such symmetry imperfec-
tions on the relative error gets stronger near the sym-
metry plane.
Coloring with thresholds can also be used for
more visual highlighting of the symmetry error propa-
gation as illustrated in Figure 9. Using a single thresh-
old, even the automatically detected one, would make
the symmetry error propagation almost invisible. As
the threshold is being moved to lower values, the most
symmetric parts of the model will remain in red and
blue colors whereas the less symmetric parts of the
model will be in yellow and white colors. We can in-
terpret, e.g., that Armadillo’s forearms are in a quite
symmetric pose, with the right palm shifted up a lit-
tle bit against the left palm (by one or two fingers).
The error in most of the points on the palms is within
2% − %5 of the palm-to-palm distance.
Sampling density naturally has some influence on
(a) (b)
(c) (d)
Figure 9: Armadillo colored with different thresholds shows
the development of relative symmetry error. Thresholds:
(a) 0.10 - found automatically from T; (b) 0.08; (c) 0.05;
(d) 0.02.
IVAPP 2024 - 15th International Conference on Information Visualization Theory and Applications
738
0 0.1 0.2 0.3 0.4 0.5 0.6 0.7 0.8 0.9 1
0
0.1
0.2
0.3
0.4
0.5
0.6
0.7
0.8
0.9
1
172974
128899
85516
42553
21489
10409
0 0.1 0.2 0.3 0.4 0.5 0.6 0.7 0.8 0.9 1
0
0.1
0.2
0.3
0.4
0.5
0.6
0.7
0.8
0.9
1
99879
74447
49383
21967
12396
6001
0 0.1 0.2 0.3 0.4 0.5 0.6 0.7 0.8 0.9 1
0
0.1
0.2
0.3
0.4
0.5
0.6
0.7
0.8
0.9
1
11779
8838
5846
2946
1481
735
0 0.1 0.2 0.3 0.4 0.5 0.6 0.7 0.8 0.9 1
0
0.1
0.2
0.3
0.4
0.5
0.6
0.7
0.8
0.9
1
32909
24602
16335
8148
4116
1997
0 0.1 0.2 0.3 0.4 0.5 0.6 0.7 0.8 0.9 1
0
0.1
0.2
0.3
0.4
0.5
0.6
0.7
0.8
0.9
1
90069
67202
44606
22188
11218
5430
Armadillo Cathedral
Statue
0 0.1 0.2 0.3 0.4 0.5 0.6 0.7 0.8 0.9 1
0
0.1
0.2
0.3
0.4
0.5
0.6
0.7
0.8
0.9
1
90042
67185
44595
22182
11214
5426
Bunny
University Component
Samples count
Samples count
Samples count
Samples count
Samples count
Samples count
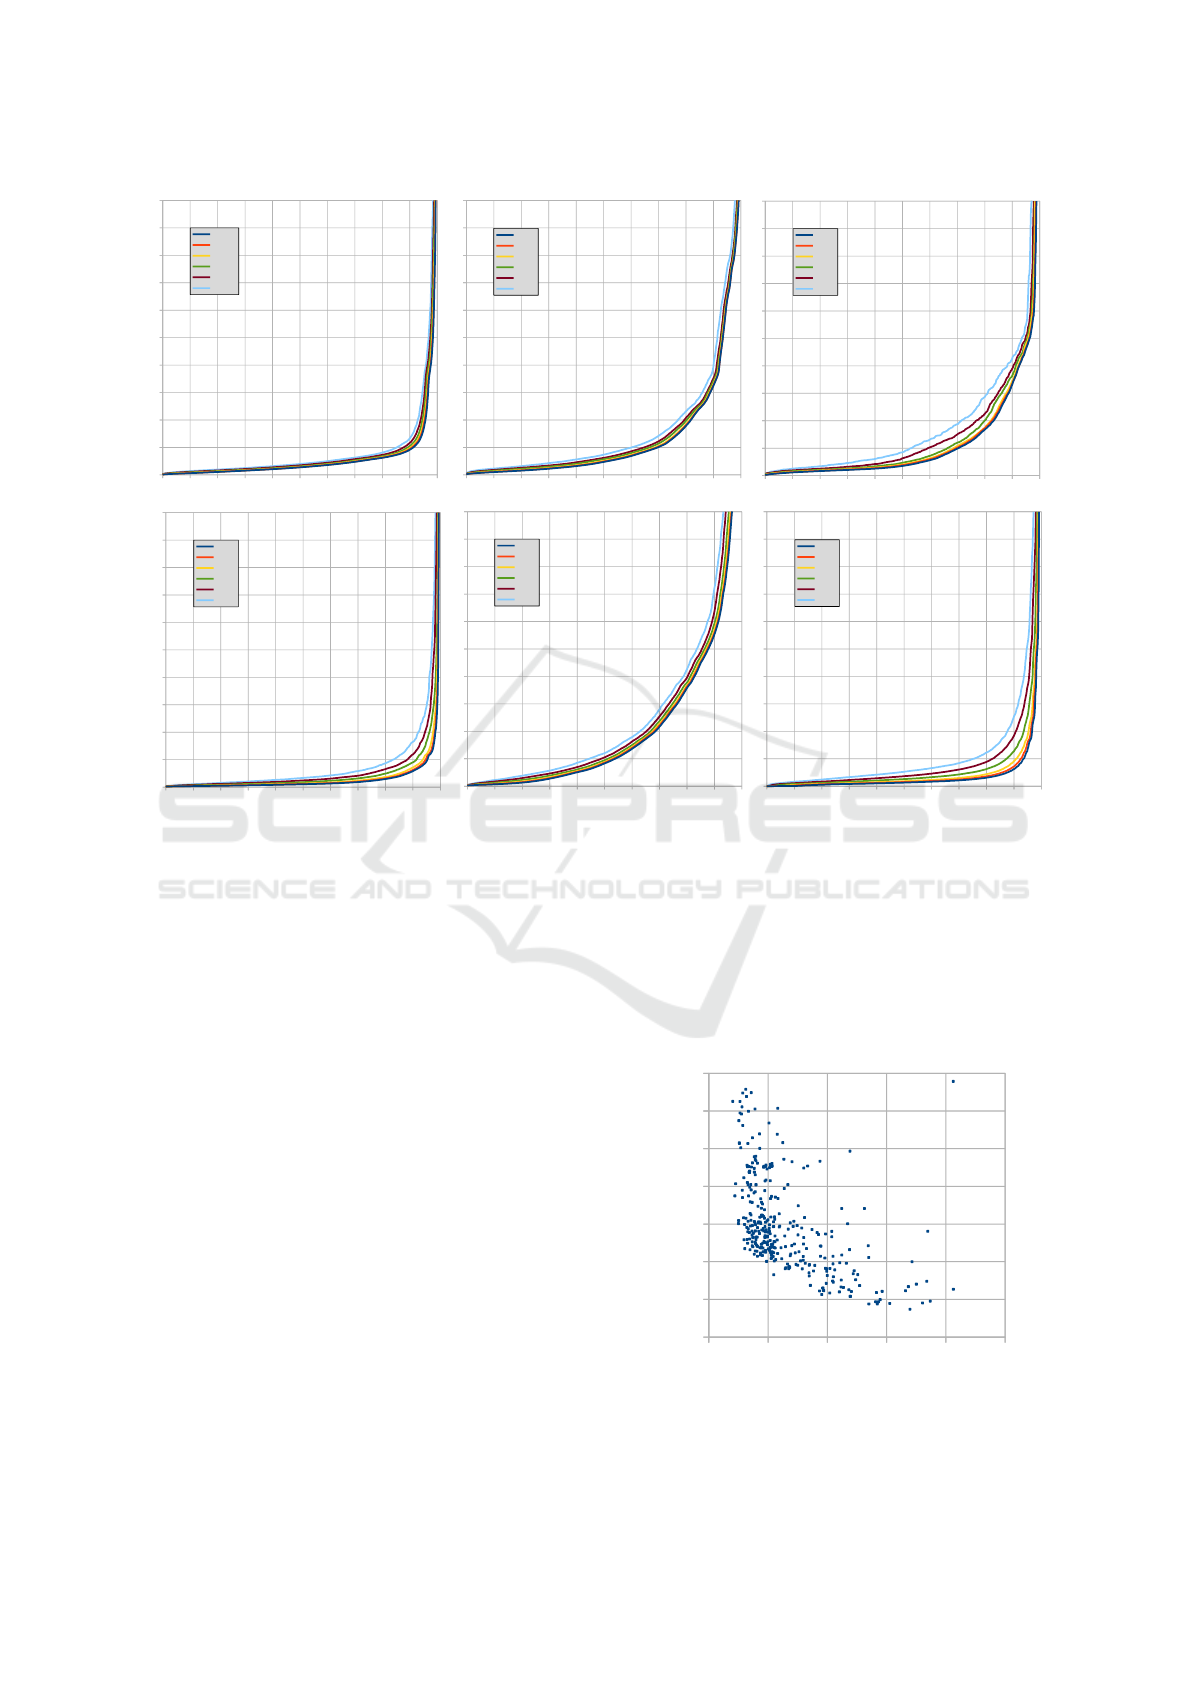
Figure 10: The behavior of relative symmetry error plots when they are computed on 100%, 75%, 50%, 25%, 12.5%, and 6%
random samples taken from the same model. Decreasing the sampling density increases the relative symmetry error.
the shape of symmetry error plots and hence also on
relative symmetry distances. If the number of samples
on the surface of an object is reduced, nearest neigh-
bor distances will generally increase and the error plot
will lift up. This is illustrated in Figure 10, where
we reduced the sampling of tested models to 75%,
50%, 25%, 12, 5%, and 6% of the original amount of
points. The symmetry plane was detected only once
for each model (using 100% samples). Although the
error plots may seem to change only marginally for
some models, we can clearly see that the comparison
based on the value of d can be influenced by sampling
densities. For example, the university with 75% of
samples will be evaluated as being more symmetrical
than the component with 12.5% of samples:
d(Uni,75%) = 0.11 < d(Comp,12.5%) = 0.19. (7)
On the other hand, the university with only 12.5% of
samples will be evaluated less symmetrical than the
component with 75% of samples:
d(Uni,12.5%) = 0.15 > d(Comp,75%) = 0.12. (8)
Therefore, judgements based on the relative symme-
try distance of different objects of unknown sampling
densities should be made with caution.
In the next experiment, we compared the proposed
relative symmetry distance against Hruda’s measure
of symmetry on a subset of the Thingi10K dataset.
We selected over 350 models having 90 000-110 000
samples each. Results are depicted in Figure 11.
Each point in the plot represents one model from the
Thingi10K dataset. The proposed relative symmetry
distance does not correlate much with Hruda’s mea-
0.0 0.1 0.2 0.3 0.4 0.5
0
500
1000
1500
2000
2500
3000
3500
symmetry distance d
Hruda's measure
Figure 11: Relative symmetry distance d against Hruda’s
measure on a subset of the Thingi10K dataset.
Evaluation of Approximate Reflectional Symmetry
739

sure. The correlation coefficient is −0.3974 and it
did not change substantially (−0.3939) even when
Hruda’s measure was normalized by dividing the
value by the number of input points.
Interestingly, Hruda’s measure for the statue (with
90 069 points) is 1390.355; and for the component
(with 90 042 points) it is 1454.743. The similarity of
these two values supports the observation that Hruda’s
measure is not very suitable for comparing the sym-
metry of different objects. The relative symmetry dis-
tance d, however, may also have its limits, as can
be seen in Figure 8 (similar values for the cathedral
and Bunny). Therefore, instead of using d as a sin-
gle value for comparison, it may be worth using some
supplementary information from the error plot, e.g.,
the relative amount of points at several relative error
levels, e.g., at 0.01, 0.02, 0.05, 0.10, 0.15 and 0.20.
Getting more points at low error levels will then in-
dicate the error plot approaches to zero, i.e., a better
symmetry.
5 CONCLUSIONS
The proposed method is usable for comparing ob-
jects (point clouds) by the amount of approximate
reflectional symmetry if the symmetry plane is pro-
vided or computed. The idea of measuring errors rel-
atively makes this method invariant with respect to
the global object scale, e.g., the bounding box diag-
onal. If a global normalization was used instead, the
results would be sensitive to the overall shape of the
object due to extruding or missing parts. Low values
of the proposed relative symmetry distance d, e.g., in
the range < 0, 0.15 >, mean that a high percentage
of points have their symmetrical counterpart with low
relative errors. Higher values, e.g., d > 0.2, mean that
the symmetry is more seriously violated. To better un-
derstand the cause, it may be worth further analyzing
the error plot or seeing the visualization of errors on
the object. Values of d > 0.5 are very high because the
symmetrical counterpart could lie in the same half-
space with a non-zero probability.
ACKNOWLEDGEMENTS
This research was supported by the Czech Science
Foundation, project number 21-08009K, and by the
Slovenian Research and Innovation Agency under re-
search project N2-0181 and Research Programme P2-
0041.
REFERENCES
Bertamini, M., Silvanto, J., Norcia, A. M., Makin, A. D.,
and Wagemans, J. (2018). The neural basis of visual
symmetry and its role in mid- and high-level visual
processing. Annals of the New York Academy of Sci-
ences, 1426(1):111–126.
Bizzarri, M., L
´
avi
ˇ
cka, and Vr
ˇ
sek, J. (2022). Approximate
symmetries of perturbed planar discrete curves. Com-
puter Aided Geometric Design, 96:102115.
Cignoni, P., Rocchini, C., and Scopigno, R. (1998). Metro:
Measuring error on simplified surfaces. Computer
Graphics Forum, 17(2):167–174.
Guttman, A. (1984). R-Trees: A dynamic index structure
for spatial searching. SIGMOD Record, 14(2):47–57.
He, C., Wang, L., Zhang, Y., and Wang, C. (2020). Dom-
inant symmetry plane detection for point-based 3D
models. Advances in Multimedia, 2020:1–8.
Hruda, L., Kolingerov
´
a, I., L
´
avi
ˇ
cka, M., and Ma
ˇ
n
´
ak, M.
(2022a). Rotational symmetry detection in 3D us-
ing reflectional symmetry candidates and quaternion-
based rotation parameterization. Computer Aided Ge-
ometric Design, 98:102138.
Hruda, L., Kolingerov
´
a, I., and V
´
a
ˇ
sa, L. (2022b). Robust,
fast and flexible symmetry plane detection based on
differentiable symmetry measure. Visual Computer,
38(2):555–571.
Levoy, M., Gerth, J., Curless, B., and Pull, K. (2005).
The Stanford 3D scanning repository. http://www.
graphics.stanford.edu/data/3Dscanrep/.
Li, B., Johan, H., Ye, Y., and Lu, Y. (2016). Efficient 3d re-
flection symmetry detection: A view-based approach.
Graph. Model., 83:2–14.
Maiseli, B. J. (2021). Hausdorff distance with outliers and
noise resilience capabilities. SN Computer Science,
2(5):358.
Mitra, N. J., Guibas, L., and Pauly, M. (2007). Symmetriza-
tion. ACM Transactions on Graphics (SIGGRAPH),
26(3):#63, 1–8.
Mitra, N. J., Guibas, L. J., and Pauly, M. (2006). Partial
and approximate symmetry detection for 3D geome-
try. ACM Trans. Graph., 25(3):560–568.
Mitra, N. J., Pauly, M., Wand, M., and Ceylan, D. (2013).
Symmetry in 3D geometry: Extraction and applica-
tions. Computer Graphics Forum, 32(6):1–23.
Podgorelec, D., Luka
ˇ
c, L., and
ˇ
Zalik, B. (2023). Reflection
symmetry detection in Earth observation data. Sen-
sors, 23(17).
Podolak, J., Shilane, P., Golovinskiy, A., Rusinkiewicz, S.,
and Funkhouser, T. (2006). A planar-reflective sym-
metry transform for 3D shapes. ACM Transactions on
Graphics (Proc. SIGGRAPH), 25(3).
Shi, Z., Alliez, P., Desbrun, M., Bao, H., and Huang, J.
(2016). Symmetry and orbit detection via lie-algebra
voting. Computer Graphics Forum, 35(5):217–227.
ˇ
Zalik, B. (2023). The GeMMA laboratory. https://gemma.
feri.um.si/.
Zabrodsky, H., Peleg, S., and Avnir, D. (1993). Completion
of occluded shapes using symmetry. In Proceedings
of IEEE Conference on Computer Vision and Pattern
Recognition, pages 678–679.
Zhou, Q. and Jacobson, A. (2016). Thingi10k: A dataset of
10, 000 3D-printing models. CoRR, abs/1605.04797.
arXiv preprint.
IVAPP 2024 - 15th International Conference on Information Visualization Theory and Applications
740
