
Auditing Fairness and Explainability in Chest X-Ray Image Classifiers
Gemma Bel Bordes
1 a
and Alan Perotti
2 b
1
Utrecht University, Netherlands
2
CENTAI, Turin, Italy
Keywords:
Medical Imaging, Computer Vision, Explainable Artificial Intelligence, Fairness.
Abstract:
Advancements in Artificial Intelligence have produced several tools that can be used in medical decision
support systems. However, these models often exhibit the so-called ’black-box problem’: an algorithmic di-
agnosis is produced, but no human-understandable details about the decision process can be obtained. This
raises critical questions about fairness and explainability, crucial for equitable healthcare. In this paper we
focus on chest X-ray image classification, auditing the reproducibility of previous results in terms of model
bias, exploring the applicability of Explainable AI (XAI) techniques, and auditing the fairness of the produced
explanations. We highlight the challenges in assessing the quality of explanations provided by XAI methods,
particularly in the absence of ground truth. In turn, this strongly hampers the possibility of comparing expla-
nation quality across patients sub-groups, which is a cornerstone in fairness audits. Our experiments illustrate
the complexities in achieving transparent AI interpretations in medical diagnostics, underscoring the need both
for reliable XAI techniques and more robust fairness auditing methods.
1 INTRODUCTION
The rapid growth of AI in medical imaging, pro-
pelled by advanced machine learning (ML) algo-
rithms and extensive imaging datasets, has the poten-
tial to augment the capabilities of radiologists, lead-
ing to more precise and efficient diagnoses (Esteva
et al., 2019). However, this technological leap brings
with it the ’black-box problem’ – a lack of trans-
parent, understandable explanations for algorithmic
decisions (Castelvecchi, 2016). This opacity raises
critical questions about fairness and explainability,
which are paramount for equitable healthcare. In-
deed, the inherent biases within AI models and their
impact on patient care cannot be overlooked. These
biases raise fairness-related concerns, particularly in
scenarios where AI models may inadvertently favor
certain patient demographics over others, leading to
disparities in healthcare outcomes (Obermeyer et al.,
). Addressing the ’black-box problem’ in healthcare
AI is crucial. The ability to understand the ratio-
nale behind AI-driven diagnoses is essential for clini-
cian and patient trust, as well as for informed clinical
decision-making. The field of Explainable AI (XAI)
seeks to unravel these complexities, aiming to make
a
https://orcid.org/0009-0006-1995-8077
b
https://orcid.org/0000-0002-1690-6865
AI decision-making processes transparent and inter-
pretable (Dwivedi et al., 2023). This quest for clarity
in AI reasoning is not merely a technical challenge
but also a fundamental fairness-related requirement in
healthcare. In this paper, we start with reproducing
and discussing previous results in chest X-ray image
classification in terms of model bias. We then dis-
cuss how to expand a fairness audit in order to include
XAI techniques. We critically analyze the challenges
in evaluating the quality of XAI methods, particularly
in the absence of a definitive ground truth. This as-
pect is crucial since the ability to compare explana-
tion quality across different patient sub-groups forms
the cornerstone of fairness audits in AI models. Eval-
uating the quality of explanations provided by XAI
techniques poses significant challenges, especially in
medical scenarios where explanations are produced
as heatmaps. In such cases, the accuracy and rel-
evance of the explanations generated by AI models
become difficult to gauge, limiting the ability to per-
form comprehensive fairness audits (Holzinger et al.,
2019). This limitation is a significant hurdle in en-
suring that AI models are not only accurate but also
just and transparent in their diagnostic processes. In
this paper, we contribute to the discourse on fairness-
related AI in healthcare, highlighting the need for ro-
bust methods in fairness auditing and the development
1308
Bordes, G. and Perotti, A.
Auditing Fairness and Explainability in Chest X-Ray Image Classifiers.
DOI: 10.5220/0012472400003636
Paper published under CC license (CC BY-NC-ND 4.0)
In Proceedings of the 16th International Conference on Agents and Artificial Intelligence (ICAART 2024) - Volume 3, pages 1308-1315
ISBN: 978-989-758-680-4; ISSN: 2184-433X
Proceedings Copyright © 2024 by SCITEPRESS – Science and Technology Publications, Lda.

of reliable XAI evaluation techniques. Our experi-
ments illustrate the complexities in achieving trans-
parent AI interpretations in medical diagnostics. We
aim to guide future research and development in this
field, advocating for AI tools that are not only techni-
cally proficient but also fairness-relatedly sound and
socially responsible, fostering a healthcare environ-
ment where technology and fairness coalesce for the
betterment of patient care.
2 RELATED WORK
2.1 Computer Vision for Image-Based
Diagnosis
Convolutional neural networks (CNNs), particularly
with breakthroughs like AlexNet, have revolution-
ized medical image analysis (Krizhevsky et al., 2017).
CNNs excel in extracting complex patterns from im-
ages, essential for image-based diagnostics. Trans-
fer learning enhances CNNs in medical imaging by
adapting pre-trained models, like those from Ima-
geNet, to medical contexts, overcoming the limitation
of small medical datasets (Shin et al., 2016). This is
especially beneficial in chest X-ray analysis for pre-
cise pattern recognition.
Significant advancements in AI for medical di-
agnostics are supported by datasets such as NIH
ChestX-ray14 (Wang et al., 2017), CheXpert (Irvin
et al., 2019), and MIMIC-CXR (Johnson et al., 2019).
These datasets provide numerous annotated images,
crucial for training effective and generalizable AI
models. Thus, CNN progress, driven by deep learning
and transfer learning, along with vast medical imag-
ing datasets, has transformed medical image analy-
sis. This leap forward enhances diagnostic accuracy
in chest X-rays and sets new benchmarks in health-
care AI applications.
2.2 Explainable AI
XAI aims to make AI models in critical areas like
healthcare more transparent and trustworthy, address-
ing the ’black-box’ issue (Doshi-Velez and Kim,
2017). Arguably the two most common techniques
are Local Interpretable Model-agnostic Explanations
(LIME) (Ribeiro et al., 2016) and SHapley Addi-
tive exPlanations (SHAP) (Lundberg and Lee, 2017).
LIME simplifies AI decisions by using an inter-
pretable local model, while SHAP values each feature
in a prediction, drawing on cooperative game theory.
Both these approaches produce attribution-based ex-
planation, computing relevance scores (often called
importances for each feature of the datapoint being
explained. For the specific task of image classifica-
tion, features correspond to pixels, and attribution-
based explainers like Gradient-weighted Class Acti-
vation Mapping (GradCAM) (Selvaraju et al., 2017),
Integrated Gradients (Sundararajan et al., 2017), Gra-
dientSHAP (Lundberg and Lee, 2017) and Occlusion
(Zeiler and Fergus, 2013) produce intuitive heatmaps
indicating key regions for predictions.
A current challenge in XAI is measuring expla-
nation effectiveness. The LEAF metric proposed a
framework for the assessment of local linear explana-
tions (Amparore et al., 2021), and other papers pro-
pose other metrics (Bhatt et al., 2021), but a standard-
ized (and operational) assessment method for XAI
quality remains elusive.
2.3 Biases in ML, Fairness Assessment
In machine learning, biases can significantly influ-
ence the outcomes of models, especially in sensitive
areas like healthcare. These biases, whether stem-
ming from data, algorithmic decisions, or societal
prejudices, can lead to discriminatory practices and
unequal treatment of various patient groups. Identify-
ing and addressing these biases is not only a technical
challenge but also a moral imperative (Selbst et al.,
2019). Group fairness demands that AI predictions
are not biased towards or against any specific group,
defined by attributes such as race, gender, age, or so-
cioeconomic status. This metric is vital for maintain-
ing trust in AI systems and ensuring that they serve
diverse patient needs fairly (Dwork et al., 2012).
Fairness assessment tools are essential in health-
care AI to evaluate biases. For instance, FairLens
audits black-box models in clinical settings, allowing
healthcare experts to identify biases in decision sup-
port systems before implementation (Panigutti et al.,
2021). It stratifies patient data by demographics, as-
sesses model performance, and enables in-depth anal-
ysis of specific misclassifications. Aequitas offers a
robust framework for auditing machine learning mod-
els for discrimination (Saleiro et al., 2018). It is de-
signed to help data scientists and policymakers ensure
ethical AI practices in healthcare. (Xu et al., 2020)
provides a scalable solution for incorporating fairness
evaluations into machine learning workflows. This
tool aids in developing equitable AI models by sup-
porting the computation of fairness metrics.
While these tools advance fairness assessment in
healthcare AI, the integration of XAI techniques in
these frameworks is an evolving area, underscoring
the need for comprehensive evaluation tools.
Auditing Fairness and Explainability in Chest X-Ray Image Classifiers
1309

Table 1: Comparison of X-ray image datasets.
NIH ChestX-ray14 CheXpert MIMIC-CXR
Size 43 GB 450 GB 550 GB
#Images (#Patients) 112,120 (30,805) 223,648 (64,740) 371,547 (64,967)
Image size (average) 1024x1024 2282x2635 2485x2695
#Labels 14+1 13+1 13+1
Demographics Age, sex Age, sex Age, sex, insurance, race
Bounding boxes Partial (8 labels) No No
3 AUDITING ML MODELS
In the scope of this research, our primary objective
is to audit ML and XAI models within the context of
medical imaging. Since our goal is not to improve the
state-of-the art of medical image classifiers, we re-
implemented models from a previous study (Seyyed-
Kalantari et al., 2021), reproducing their results. The
utility is twofold: it first establishes the importance of
reproducibility in the scientific process, particularly
in the domain of AI in healthcare. Second, by re-
producing these established results, we position our-
selves to further investigate and evaluate the dimen-
sions of explainability and fairness. Our adherence
to reproducibility lays a solid foundation upon which
we can conduct a thorough examination of the fair-
ness implications of these AI systems, especially in
critical applications such as disease diagnosis.
3.1 Datasets
Similar to (Seyyed-Kalantari et al., 2021), we rely on
three pivotal datasets for chest X-ray image analysis:
ChestX-ray, CheXpert, and MIMIC-CXR. A synop-
sis of these datasets is reported in Table 1. We also
refer to these datasets as NIH, CXP and MIMIC re-
spectively, for the sake of brevity.
ChestX-Ray. (Wang et al., 2017) stands out as
a large-scale repository containing over 100,000
frontal-view chest X-ray images from 30,000 unique
patients. This dataset is notable for its extensive an-
notations, covering 14 common thoracic patologies.
It provides an invaluable resource for developing and
testing AI models, offering a diverse array of cases
that reflect real-world clinical scenarios.
CheXpert. (Irvin et al., 2019) comprises a substan-
tial dataset of over 200,000 chest radiographs. It in-
cludes uncertainty labels and comparisons with expert
radiologist interpretations, which are crucial for vali-
dating the accuracy and reliability of AI models. The
dataset’s size and depth make it a robust tool for train-
ing AI models, ensuring they can handle a wide range
of diagnostic challenges.
MIMIC-CXR. (Johnson et al., 2019) is an exten-
sive database featuring a vast collection of chest X-
rays. It includes over 370,000 radiographic studies
linked to detailed free-text radiological reports, of-
fering a comprehensive view of patient cases. This
dataset combines imaging data with rich textual infor-
mation, enabling the development of AI models that
can understand and interpret complex medical narra-
tives alongside visual data.
Images were annotated manually or using natu-
ral language processing, identifying 15 labels (NIH)
or 14 labels (CXP and MIMIC), which include chest
diseases and an additional label for ”no finding.” In
CXP and MIMIC, we treated unknown or uncertain
labels as negative cases. To ensure label consistency,
we considered ”no finding” as positive only when no
diseases were present and negative if at least one pos-
itive disease was identified. Patient sex and age were
annotated for all images. In the case of MIMIC, we
merged MIMIC-CXR and MIMIC-IV to obtain pa-
tient demographics. To reduce resource requirements,
we stored smaller versions of the images by fixing the
image height at 512 pixels while maintaining the orig-
inal proportions. Image resizing was a crucial step in
our process, implemented to optimize storage space
without compromising the integrity of the data.
3.2 Model Training and Reproducibility
Initially, we split the data into training-validation-
test sets using Seyyed et al.’s partitioning approach
(Seyyed-Kalantari et al., 2021), resulting in approx-
imately 80-10-10 splits without any patient overlap.
However, our MIMIC splits slightly differed due to
unmatched patients resulting from merging MIMIC-
CXR and MIMIC-IV. In addition, we created a dif-
ferent data split for NIH to obtain a test set contain-
ing patients with at least one image annotated with
bounding boxes, which provide ground truth explana-
tions of disease localization in the images. This al-
ternative NIH split was necessary because the overlap
ICAART 2024 - 16th International Conference on Agents and Artificial Intelligence
1310
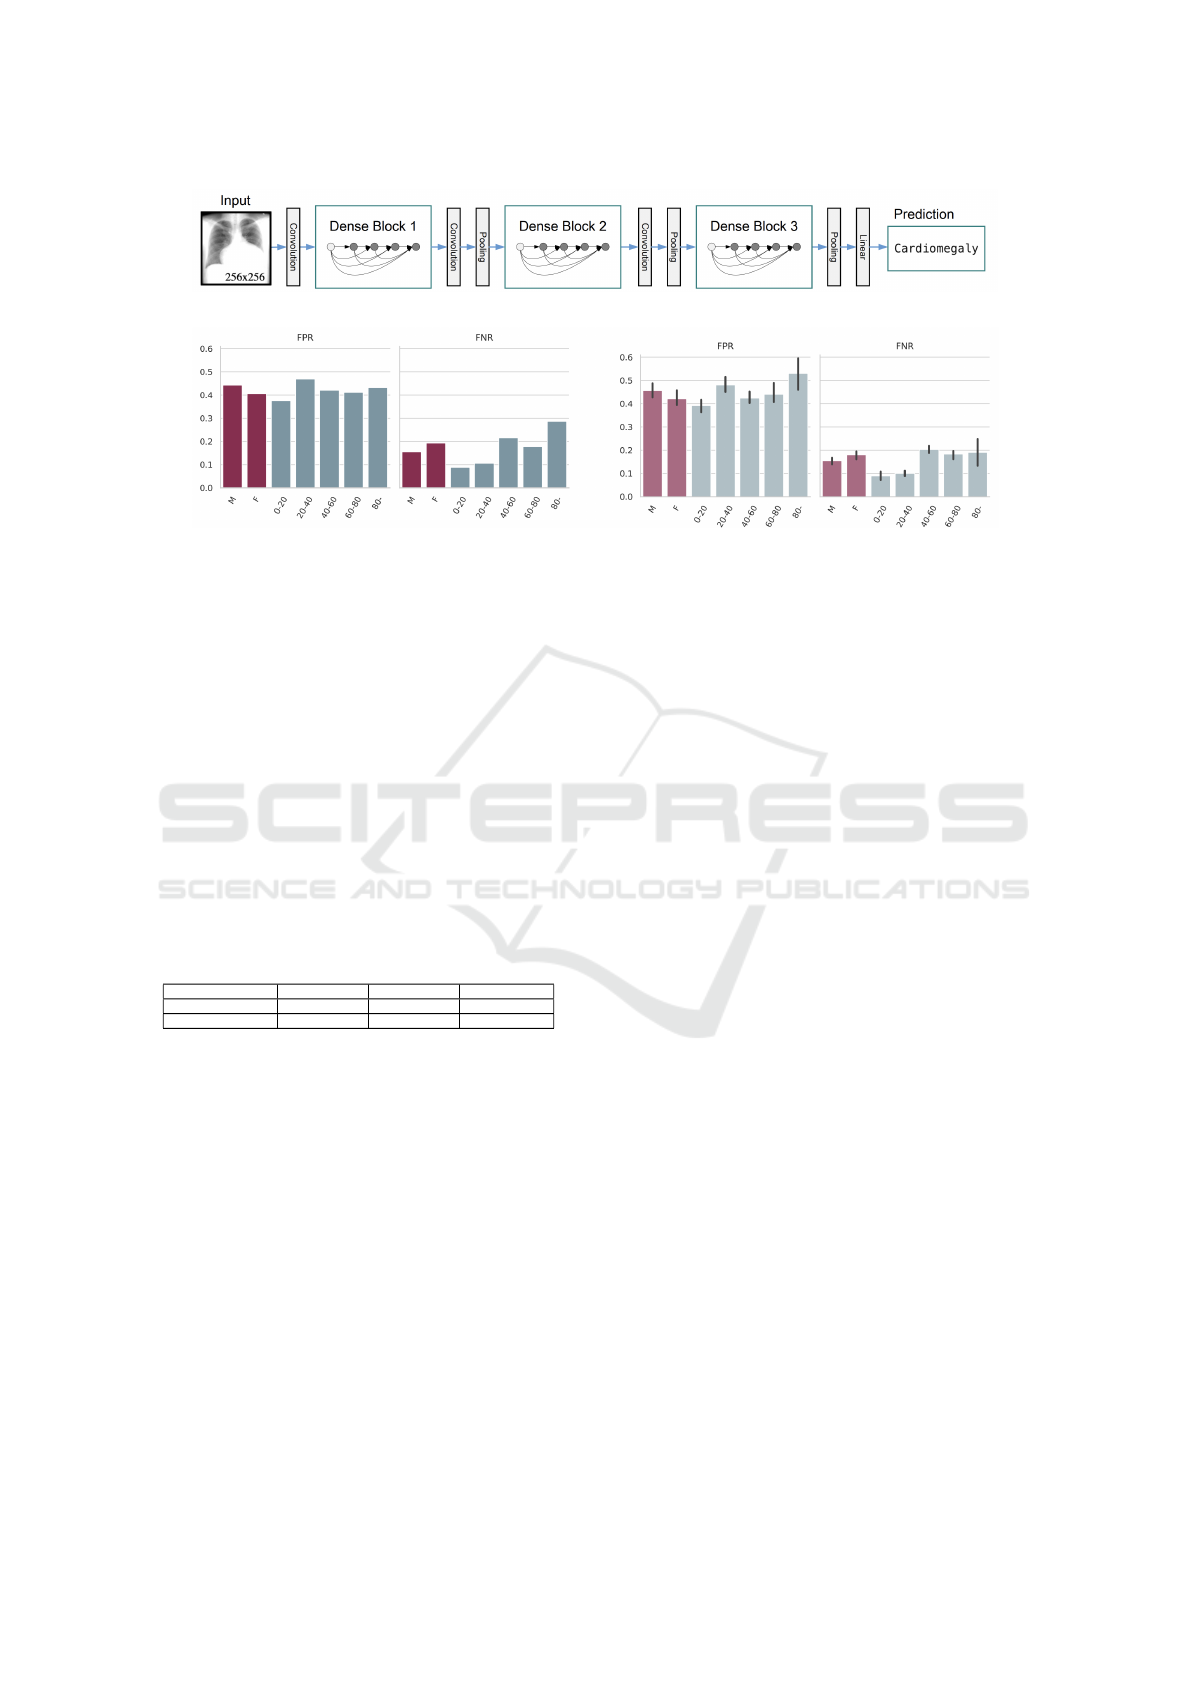
Figure 1: DenseNet-121 architecture schema.
Figure 2: Stratified FPR/FNR for Cardiomegaly: our results (left) and the originals to reproduce (right, with error bars).
between the images in the original test set and those
with bounding boxes was insufficient (49 images in-
stead of 984). The alternative NIH split followed a
proportion of 70-15-15.
We went through a thorough re-implementation
of the DenseNet-121 model from Seyyed’s paper
(Seyyed-Kalantari et al., 2021); the architecture of
the model is portrayed in Figure 1. We trained one
instance for each of the three datasets. The training
was conducted on an upgraded Pytorch platform, with
specific emphasis on matching the original study’s
performance metrics.
Our results mirrored those of the original study,
both in terms of underdiagnosis and overdiagnosis
rates, as well as in the accuracy of the models, as re-
flected by the area under the curve (AUC) metrics, as
reported in the table below.
NIH CheXpert MIMIC-CXR
Original AUC 0.835 ± 0.002 0.805 ± 0.001 0.834± 0.001
Reproduced AUC 0.835 0.799 0.830
3.3 Stratification and Group Fairness
The original study presented underdiagnosis and
overdiagnosis rates for the ”no finding” label. Hence,
we also computed the false positive rate (FPR) and
false negative rate (FNR) specifically for the ”no find-
ing” label for our models, that had been trained with
an upgraded Pytorch version. These rates were cal-
culated for different subpopulations based on the di-
vision of patients by sex and age (divided into ven-
tiles ranging from 0-20 to 80 and older), since these
variables are available for all three datasets. We com-
pared the performance of our models across different
patient subgroups, aiming to stay within the error bars
of the original findings. An example of these results
is portrayed in Figure 2. By ensuring consistency in
these performance metrics, we can validate the repro-
ducibility of the models, even with the image resizing
and Pytorch upgrade.
This replication process was not merely about
validating our model’s accuracy; it was also about
ensuring that our findings were consistent and reli-
able across various datasets and patient demograph-
ics. Our analysis revealed that while some diseases
showed lower detection rates in certain subgroups,
such as atelectasis and effusion in female and younger
patients, others like pneumothorax and cardiomegaly
were more challenging to detect in male and older pa-
tients. These findings highlight the nuanced nature of
AI diagnostics and the necessity for models that are
robust across a wide range of patient characteristics.
4 AUDITING EXPLAINERS
4.1 Assessing Explanation Fairness
Assessing group fairness for an explainer is arguably
a non-standard practice; we decided to extend the ap-
proach introduced by (Panigutti et al., 2021) in order
to encompass the whole explainable machine learn-
ing pipeline. This involves a first step of stratification
and subsequent evaluation of explanations across dif-
ferent subgroups. As stated in the previous section,
in our scenario this stratification typically hinges on
demographic attributes such as age, gender, ethnicity,
and socioeconomic status - in our experiments, we
focus on gender and discretised age. The goal is to
ensure that the explanations provided by AI systems
are consistent and equitable across these subgroups,
thereby promoting fairness and transparency in clini-
cal decision-making (Mehrabi et al., 2021).
We therefore leveraged the datasets, trained model
and cohort stratification introduced in the previous
Auditing Fairness and Explainability in Chest X-Ray Image Classifiers
1311
sections. We then employed four prominent explain-
ers: GradCAM, Integrated Gradients, GradientSHAP,
and Occlusion, each providing unique insights into
the decision-making process of deep learning models.
We remark that our goal is to stratify the patient
data and evaluate the quality and consistency of the
explanations produced for each subgroup. This in-
volved analyzing whether the explainers display the
same quality across all subgroups or whether there
were discrepancies that could lead to biased clinical
decisions. The fairness of explainers is a critical con-
sideration, as biased explanations could prevent med-
ical personnel to take the best clinical decisions.
However, from a merely technical standpoint, the
evaluation of explanation quality is far from being
standard practice: despite the proliferation of pro-
posed metrics (Amparore et al., 2021),(Le et al.,
2023), there is no consensus on how to operationally
evaluate explanations. For the specific case of medi-
cal image classifiers, there are two fundamentally dif-
ferent sub-scenarios, depending on the availability of
annotated data: we will analyse the two cases in the
following sub-sections.
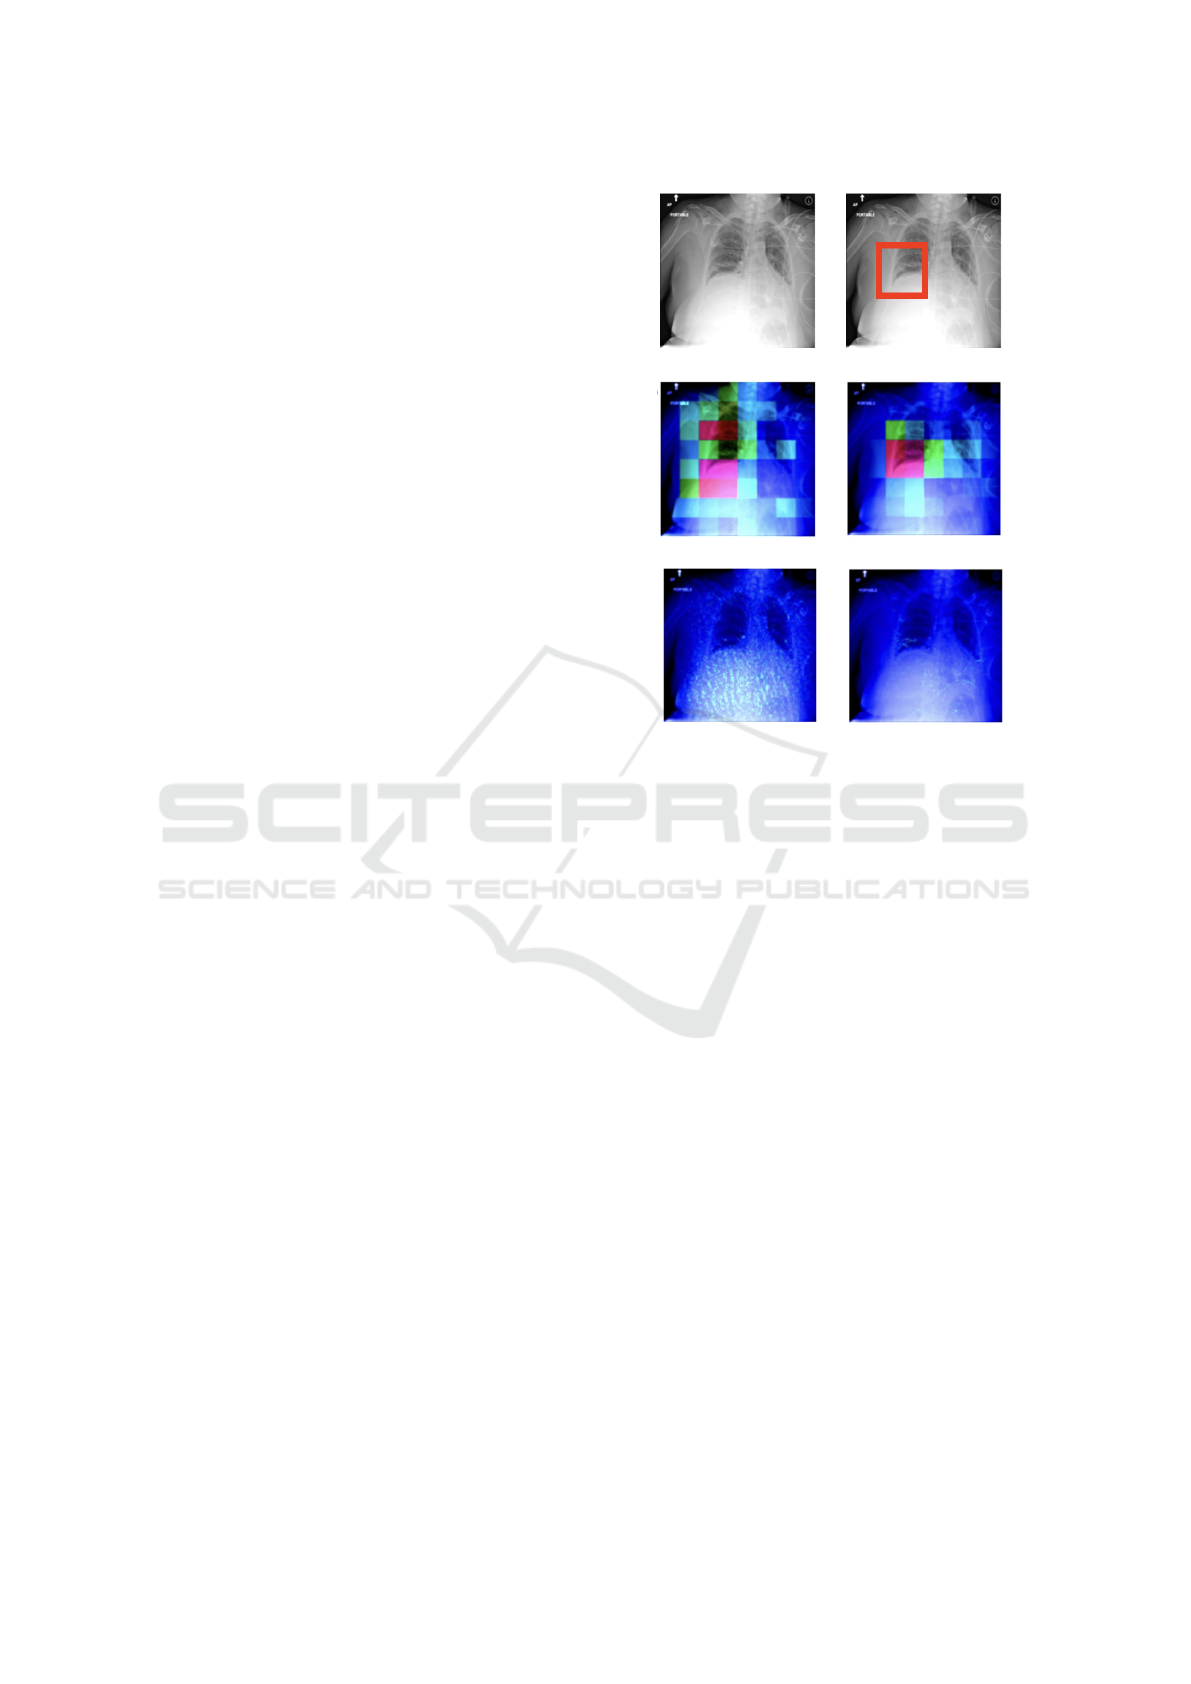
4.2 Evaluation with Ground Truth
When ground truth annotations are available, such as
bounding boxes in medical imaging datasets, they of-
fer an invaluable benchmark for evaluating the ac-
curacy of explainability techniques. An example of
chest x-ray, ground truth (bounding box) and possible
explanations (heatmaps) is depicted in Figure 3.
To assess which method produced the most accu-
rate explanations, we focused on the bounding boxes
that were annotated for some images of the NIH
dataset (984 in total). These bounding boxes indi-
cate the true localization of diseases in the images.
As these annotated images are exclusively available
in the alternative NIH test set, our analysis in this sec-
tion will solely refer to this dataset. Specifically, we
consider the pairs of X-ray images and diseases that
were correctly classified as positive (TP) and possess
bounding box annotations (574 in total). For each of
these pairs, we employed the four explainers to gen-
erate attribution heatmaps (i.e., explanations). It is
worth noting that we were working with a reduced
set of eight disease labels: atelectasis, cardiomegaly,
effusion, infiltration, mass, nodule, pneumonia, and
pneumothorax. This is because the bounding box co-
ordinates were only provided for the previous version
of NIH (NIH ChestX-ray8).
We conducted a disease-specific evaluation of the
attribution heatmaps using three metrics: Intersec-
tion over Union (IoU), Point Localization Accuracy
Figure 3: Data point and bounding box (top row) and
explanation heatmaps: GradCAM and Occlusion (cen-
ter row), Integrated Gradients and GradientSHAP (bottom
row). Red-shifting pixels are the most important.
(PLA), and the Area Under the Curve (AUC) for the
Receiver Operating Characteristic (ROC) curve gen-
erated by our attributions (as the prediction) and the
bounding boxes (as the true values). We report the
results in Table 2.
When quantitatively evaluating the attributions
with these three metrics, we detected that GradCAM
and occlusion clearly outperformed the other two ex-
plainers. The accuracy of the attribution heatmaps
varies significantly depending on the disease being
explained. Cardiomegaly consistently achieved the
highest values for IoU, PLA, and AUC, while ex-
planations for atelectasis and nodules tended to have
lower values overall. Upon visual inspection of the at-
tribution heatmaps, it was evident that GradCAM and
Occlusion produced lower-resolution heatmaps com-
pared to Integrated Gradients and GradientSHAP (see
again Figure 3). Additionally, the heatmaps gener-
ated by IG and GradientSHAP exhibited high levels
of noise and sparsity, confirming their lower quality
as assessed quantitatively.
However, the application of these metrics is
severely constrained by the availability of annotated
data. As a side note, we remark that there can be
no bounding boxes for negative images, as there is
no medical condition to be highlighted. In our three
ICAART 2024 - 16th International Conference on Agents and Artificial Intelligence
1312

Table 2: Evaluation metrics for explainer performance across various conditions. IoU (Intersection over Union), PLA (Pixel
Localization Accuracy), and AUC (Area Under the Curve) values are shown for each explainer and condition.
GradCAM Occlusion Integrated Gradients GradientSHAP
IoU PLA AUC IoU PLA AUC IoU PLA AUC IoU PLA AUC
Atelectasis 0.048 0.094 0.544 0.149 0.248 0.787 0.049 0.060 0.533 0.074 0.308 0.573
(0.058) (0.274) (0.097) (0.041) (0.044)
Cardiomegaly 0.564 0.977 0.949 0.487 0.977 0.901 0.155 0.616 0.548 0.116 0.826 0.576
(0.103) (0.036) (0.104) (0.018) (0.035)
Effusion 0.154 0.258 0.736 0.174 0.292 0.783 0.065 0.142 0.531 0.064 0.333 0.563
(0.133) (0.219) (0.125) (0.036) (0.042)
Infiltration 0.242 0.485 0.756 0.264 0.606 0.800 0.082 0.161 0.528 0.089 0.475 0.575
(0.192) (0.237) (0.154) (0.041) (0.052)
Mass 0.160 0.317 0.860 0.222 0.683 0.855 0.033 0.024 0.507 0.089 0.463 0.580
(0.156) (0.203) (0.149) (0.037) (0.053)
Nodule 0.022 0.045 0.731 0.055 182 0.874 0.008 0.114 0.520 0.060 0.296 0.577
(0.018) (0.245) (0.056) (0.005) (0.046)
Pneumonia 0.302 0.444 0.891 0.276 0.833 0.802 0.093 0.222 0.537 0.096 0.390 0.579
(0.193) (0.123) (0.156) (0.053) (0.045)
Pneumothorax 0.089 0.102 0.710 0.151 0.245 0.769 0.050 0.122 0.517 0.031 0.041 0.525
(0.118) (0.173) (0.143) (0.032) (0.030)
datasets bounding box annotations were limited, re-
sulting in low statistical power and a reduced scope
of diseases for which these direct comparisons could
be made. Despite these limitations, the explanations’
accuracy remained consistent across sub-groups, sug-
gesting that biases at the model level were not ampli-
fied at the explanation level.
4.3 Evaluation Without Ground Truth
Evaluating the quality of explanatory heatmaps in the
absence of ground truth poses a significant challenge
in the field of explainable AI. We tried to expand our
analysis by incorporating two metrics that do not rely
on bounding boxes, allowing us to overcome the lim-
itation of only working with (annotated) TP cases.
This would enable us to extend our analysis to larger
datasets, including CXP and MIMIC, and even the
full NIH dataset by considering all cases.
First, we considered the faithfulness correlation
(Bhatt et al., 2021) for the same explanations evalu-
ated in the previous section. It is computed by mask-
ing a random subset of image pixels with black in an
iterative manner. The Pearson correlation is then cal-
culated between the difference in model output and
the sum of the attributions assigned to those masked
pixels. In each iteration, we compute (1) the differ-
ence between the model output with the original im-
age and the model output with the partially masked
image, and (2) the sum of attribution values corre-
sponding to the masked pixels. We perform 200 it-
erations, masking a subset of 1024 pixels each time.
We compared this metric with the AUC score, but we
could not detect any correlation, as visually reported
in Figure 4. Therefore, we decided not to use this
Figure 4: AUC against faithfulness correlation.
metric on data without ground truth.
We then experimented with deletion curves (Pet-
siuk et al., 2018). In this case, we consider the expla-
nation heatmap as a ranking and progressively mask
pixels, from most to least important, until the image
is completely black. If we query the black-box model
at every masking step, we can gauge the progressive
classification change going from the initial image (0%
masking) to the final one (100% masking). Ideally,
a good explanation requires few steps to ’confuse’ a
model, while a bad explanation will focus on irrele-
vant pixels first and therefore require more steps to
confuse the model. This is captured by measuring
the Area Under the Deletion Curve (AUDC). When
plotting some of these curves as a sanity check, we
detected several unusual behaviors; we depict an ex-
ample in Figure 5. When creating a deletion curve by
randomly masking regions without following the im-
portance order, the probability drop pattern appeared
very similar to the curves generated using the ordered
deletion procedure. Since the mask we used for the
process was a black image, we wondered whether
there was a problem with the model. Has the model
Auditing Fairness and Explainability in Chest X-Ray Image Classifiers
1313
learned to predict certain diseases based on black pat-
terns? Is the model actually responding to the injected
black patterns instead of anatomical features?
Figure 5: Unexpected deletion curve behaviour:
explanation-induced curve (left) compared with ran-
dom control curve (right)
To answer this, we used another masking tech-
nique. Instead of masking the image with black re-
gions, we also mask it with the same regions but
coming from another image, which corresponded
to the mean image of the whole test set. In
both cases (masking with black and masking with
mean), for all datapoints we computed the difference
between explanation-induced AUDC and random-
baseline AUDC: we call this quantity AUDCdiff.
Ideally, a good masking model would produce AU-
DCs that differ significantly from a random baseline
AUDC. Our hope was to obtain a higher AUDCdiff
for mean-masking, as this would have pinned black-
masking as the culprit for the unexpected deletion
curve behaviour.
Figure 6: AUDCdiff for two conditions. The red boxplot is
black-masking, the teal one is mean-masking. Paired lines
are depicted to show individual comparisons.
We report an example of our results in Figure 6.
We can see there was no clear difference between us-
ing the mean image instead of a black image when
masking. Based on these findings, we rejected our
initial hypothesis about the model and argue that the
issue lies with the evaluation metric itself. For chest
X-ray images, the evaluation of explanations using
deletion or insertion curves appears to be unsuitable.
5 DISCUSSION AND
CONCLUSIONS
In this paper we focused on the fairness assessment
of explainable machine learning pipelines for chest
X-ray image classifiers. On the one hand, recent fair-
ness assessment criteria are able to provide disease-
specific insights about group biases across a stratified
cohort. We remark that for a truly independent audit,
this analyses should be conducted by a third party, so
it is paramount that the ML results are reproducible.
However, auditing the explainability component
of our pipeline proved to be more complex, depend-
ing on the availability of ground truth - that is, hand-
annotated bounding boxes defining the portion of the
image depicting, or correlated with, a specific medical
condition. When ground truth is available, there are
several possible metrics (IoU, PLA, AUC). In the vast
majority of medical images without a ground truth,
both our approaches (based on faithfulness correla-
tion and deletion curves) proved unsuccessful. Group
fairness is about disparity of treatment, but disparity
cannot be measured until quality can be measured.
We highlight how the technical need for explanation
evaluation metrics for image classification becomes a
top priority in order to build protocols for assessment
of explainable machine learning pipelines.
We strongly advocate for the adoption of audit-
ing techniques in medical AI systems: ensuring fair-
ness in AI-driven diagnostics is crucial, particularly in
diverse patient populations. We think that overcom-
ing this would enable a paradigm shift towards more
transparent and reliable AI systems in healthcare.
ACKNOWLEDGEMENTS
The authors would like to thank Andr
´
e Panisson,
Michele Starnini and Claudio Borile for their constant
supervision during the development of this project,
and Anastasia Giachanou for the precious feedback
during the final project presentation.
This work was conducted in the context of the Hori-
zon Europe project PRE-ACT (Prediction of Radio-
therapy side effects using explainable AI for patient
communication and treatment modification). It was
supported by the European Commission through the
Horizon Europe Program (Grant Agreement number
101057746), by the Swiss State Secretariat for Educa-
tion, Research and Innovation (SERI) under contract
number 22 00058, and by the UK government (Inno-
vate UK application number 10061955).
ICAART 2024 - 16th International Conference on Agents and Artificial Intelligence
1314

REFERENCES
Amparore, E. G., Perotti, A., and Bajardi, P. (2021). To trust
or not to trust an explanation: using leaf to evaluate
local linear xai methods. PeerJ Computer Science, 7.
Bhatt, U., Weller, A., and Moura, J. M. F. (2021). Eval-
uating and aggregating feature-based model explana-
tions. In Proceedings of the Twenty-Ninth Interna-
tional Joint Conference on Artificial Intelligence.
Castelvecchi, D. (2016). Can we open the black box of ai?
Nature, 538:20–23.
Doshi-Velez, F. and Kim, B. (2017). Towards a rigorous
science of interpretable machine learning. arXiv: Ma-
chine Learning.
Dwivedi, R., Dave, D., Naik, H., Singhal, S., Omer, R.,
Patel, P., Qian, B., Wen, Z., Shah, T., Morgan, G., and
Ranjan, R. (2023). Explainable ai (xai): Core ideas,
techniques, and solutions. ACM Comput. Surv., 55(9).
Dwork, C., Hardt, M., Pitassi, T., Reingold, O., and Zemel,
R. (2012). Fairness through awareness. In Proceed-
ings of the 3rd Innovations in Theoretical Computer
Science Conference, ITCS ’12, page 214–226. ACM.
Esteva, A., Robicquet, A., Ramsundar, B., Kuleshov, V.,
DePristo, M., Chou, K., Cui, C., Corrado, G., Thrun,
S., and Dean, J. (2019). A guide to deep learning in
healthcare. Nature Medicine, 25.
Holzinger, A., Langs, G., Denk, H., Zatloukal, K., and
M
¨
uller, H. (2019). Causability and explainabilty of
artificial intelligence in medicine. Wiley Interdisci-
plinary Reviews: Data Mining and Knowledge Dis-
covery, 9:e1312.
Irvin, J., Rajpurkar, P., Ko, M., Yu, Y., Ciurea-Ilcus, S.,
Chute, C., Marklund, H., Haghgoo, B., Ball, R., Sh-
panskaya, K., Seekins, J., Mong, D. A., Halabi, S. S.,
Sandberg, J. K., Jones, R., Larson, D. B., Langlotz,
C. P., Patel, B. N., Lungren, M. P., and Ng, A. Y.
(2019). Chexpert: A large chest radiograph dataset
with uncertainty labels and expert comparison. In Pro-
ceedings of the Thirty-Third AAAI Conference.
Johnson, A. E. W., Pollard, T. J., Berkowitz, S. J., Green-
baum, N. R., Lungren, M. P., Deng, C.-y., Mark, R. G.,
and Horng, S. (2019). Mimic-cxr, a de-identified pub-
licly available database of chest radiographs with free-
text reports. Scientific Data, 6(1):317.
Krizhevsky, A., Sutskever, I., and Hinton, G. E. (2017). Im-
agenet classification with deep convolutional neural
networks. Commun. ACM, 60(6):84–90.
Le, P. Q., Nauta, M., Nguyen, V. B., Pathak, S., Schl
¨
otterer,
J., and Seifert, C. (2023). Benchmarking explainable
ai - a survey on available toolkits and open challenges.
In Elkind, E., editor, Proceedings of the Thirty-Second
International Joint Conference on Artificial Intelli-
gence, IJCAI-23, pages 6665–6673.
Lundberg, S. M. and Lee, S.-I. (2017). A unified approach
to interpreting model predictions. In Proceedings of
the 31st International Conference on Neural Informa-
tion Processing Systems, NIPS’17, page 4768–4777,
Red Hook, NY, USA. Curran Associates Inc.
Mehrabi, N., Morstatter, F., Saxena, N., Lerman, K., and
Galstyan, A. (2021). A survey on bias and fairness in
machine learning. ACM Comput. Surv., 54(6).
Obermeyer, Z., Powers, B., Vogeli, C., and Mullainathan, S.
Dissecting racial bias in an algorithm used to manage
the health of populations. Science, 366:447–453.
Panigutti, C., Perotti, A., Panisson, A., Bajardi, P., and Pe-
dreschi, D. (2021). Fairlens: Auditing black-box clin-
ical decision support systems. Information Processing
& Management, 58(5):102657.
Petsiuk, V., Das, A., and Saenko, K. (2018). Rise: Ran-
domized input sampling for explanation of black-box
models. ArXiv, abs/1806.07421.
Ribeiro, M. T., Singh, S., and Guestrin, C. (2016). ”why
should i trust you?”: Explaining the predictions of any
classifier. In Proceedings of the 22nd ACM SIGKDD
International Conference on Knowledge Discovery
and Data Mining, KDD ’16, page 1135–1144. ACM.
Saleiro, P., Kuester, B., Stevens, A., Anisfeld, A., Hinkson,
L., London, J., and Ghani, R. (2018). Aequitas: A
bias and fairness audit toolkit.
Selbst, A. D., Boyd, D., Friedler, S. A., Venkatasubrama-
nian, S., and Vertesi, J. (2019). Fairness and abstrac-
tion in sociotechnical systems. In Proceedings of the
Conference on Fairness, Accountability, and Trans-
parency, FAT* ’19, page 59–68. ACM.
Selvaraju, R. R., Cogswell, M., Das, A., Vedantam, R.,
Parikh, D., and Batra, D. (2017). Grad-cam: Visual
explanations from deep networks via gradient-based
localization. In 2017 IEEE International Conference
on Computer Vision (ICCV), pages 618–626.
Seyyed-Kalantari, L., Zhang, H., McDermott, M., Chen,
I., and Ghassemi, M. (2021). Underdiagnosis bias of
artificial intelligence algorithms applied to chest ra-
diographs in under-served patient populations. Nature
Medicine, 27.
Shin, H.-C., Roth, H. R., Gao, M., Lu, L., Xu, Z., Nogues,
I., Yao, J., Mollura, D. J., and Summers, R. M. (2016).
Deep convolutional neural networks for computer-
aided detection: Cnn architectures, dataset character-
istics and transfer learning. Ieee Transactions on Med-
ical Imaging, 35:1285 – 1298.
Sundararajan, M., Taly, A., and Yan, Q. (2017). Axiomatic
attribution for deep networks. In Proceedings of the
34th International Conference on Machine Learning -
Volume 70, ICML’17, page 3319–3328. JMLR.org.
Wang, X., Peng, Y., Lu, L., Lu, Z., Bagheri, M., and Sum-
mers, R. M. (2017). Chestx-ray8: Hospital-scale chest
x-ray database and benchmarks on weakly-supervised
classification and localization of common thorax dis-
eases. In 2017 IEEE Conference on Computer Vision
and Pattern Recognition (CVPR), pages 3462–3471.
Xu, C., Greer, C., Joshi, M. N., and Doshi, T. (2020). Fair-
ness indicators demo: Scalable infrastructure for fair
ml systems.
Zeiler, M. D. and Fergus, R. (2013). Visualizing
and understanding convolutional networks. ArXiv,
abs/1311.2901.
Auditing Fairness and Explainability in Chest X-Ray Image Classifiers
1315
