
Examining Decision-Making in Air Traffic Control: Enhancing
Transparency and Decision Support Through Machine Learning,
Explanation, and Visualization: A Case Study
Christophe Hurter
1 a
, Augustin Degas
1 b
, Arnaud Guibert
1 c
, Maelan Poyer
1
, Nicolas Durand
1
,
Alexandre Veyrie
1
, Ana Ferreira
4
, Nicola Cavagnetto
4
, Stefano Bonelli
4
, Mobyen Uddin Ahmed
2
,
Waleed Jmoona
2
, Shaibal Barua
2
, Shahina Begum
2
, Giulia Cartocci
3
, Gianluca Di Flumeri
3 d
,
Gianluca Borghini
3 e
, Fabio Babiloni
3 f
and Pietro Aric
´
o
3 g
1
Ecole Nationale de l’Aviation Civile, ENAC, University of Toulouse, France
2
Artificial Intelligence and Intelligent Systems Research Group, School of Innovation, Design and Engineering, M
¨
alardalen
University, V
¨
aster
˚
as, Sweden
3
Department of Molecular Medicine, Sapienza University of Rome, Rome, Italy
4
Deep Blue, Rome, Italy
{firstname.lastname}@enac.fr, {firstname.lastname}@dblue.it, {firstname.lastname}@mdu.se,
{firstname.lastname}@uniroma1.it
Keywords:
Artificial Intelligence, eXplainable Artificial Intelligence, User-Centric XAI, Conflict Detection and
Resolution, Air Traffic Management.
Abstract:
Artificial Intelligence (AI) has recently made significant advancements and is now pervasive across various
application domains. This holds true for Air Transportation as well, where AI is increasingly involved in
decision-making processes. While these algorithms are designed to assist users in their daily tasks, they still
face challenges related to acceptance and trustworthiness. Users often harbor doubts about the decisions
proposed by AI, and in some cases, they may even oppose them. This is primarily because AI-generated
decisions are often opaque, non-intuitive, and incompatible with human reasoning. Moreover, when AI is
deployed in safety-critical contexts like Air Traffic Management (ATM), the individual decisions generated
by AI models must be highly reliable for human operators. Understanding the behavior of the model and
providing explanations for its results are essential requirements in every life-critical domain. In this scope, this
project aimed to enhance transparency and explainability in AI algorithms within the Air Traffic Management
domain. This article presents the results of the project’s validation conducted for a Conflict Detection and
Resolution task involving 21 air traffic controllers (10 experts and 11 students) in En-Route position (i.e. hight
altitude flight management). Through a controlled study incorporating three levels of explanation, we offer
initial insights into the impact of providing additional explanations alongside a conflict resolution algorithm
to improve decision-making. At a high level, our findings indicate that providing explanations is not always
necessary, and our project sheds light on potential research directions for education and training purposes.
1 INTRODUCTION
Artificial Intelligence (AI) experienced a significant
resurgence during the 2010s, driven by increased ac-
a
https://orcid.org/0000-0003-4318-6717
b
https://orcid.org/0000-0003-4525-0399
c
https://orcid.org/0009-0003-1762-9219
d
https://orcid.org/0000-0003-4426-051X
e
https://orcid.org/0000-0001-8560-5671
f
https://orcid.org/0000-0002-4962-176X
g
https://orcid.org/0000-0003-4728-9246
cess to vast volumes of data and the discovery of the
high computational efficiency of graphics card pro-
cessors for accelerating machine learning algorithms
(Council of Europe, 2020). This surge of interest
in AI extended to every application domain, and Air
Traffic Management (ATM) was no exception (Degas
et al., 2022). However, despite numerous research ef-
forts in applying AI to the ATM domain, its full opera-
tional integration and substantial benefits to end users
have remained elusive. The slow progress in adopting
AI in ATM can be attributed to the critical nature of
622
Hurter, C., Degas, A., Guibert, A., Poyer, M., Durand, N., Veyrie, A., Ferreira, A., Cavagnetto, N., Bonelli, S., Ahmed, M., Jmoona, W., Barua, S., Begum, S., Cartocci, G., Di Flumeri, G.,
Borghini, G., Babiloni, F. and Aricó, P.
Examining Decision-Making in Air Traffic Control: Enhancing Transparency and Decision Support Through Machine Learning, Explanation, and Visualization: A Case Study.
DOI: 10.5220/0012471900003636
Paper published under CC license (CC BY-NC-ND 4.0)
In Proceedings of the 16th International Conference on Agents and Artificial Intelligence (ICAART 2024) - Volume 2, pages 622-634
ISBN: 978-989-758-680-4; ISSN: 2184-433X
Proceedings Copyright © 2024 by SCITEPRESS – Science and Technology Publications, Lda.

this domain, where human lives are at stake, making
safety the utmost priority.
Historically, safety in Air Traffic Management
(ATM) has relied on human-in-the-loop systems
(Di Flumeri et al., 2019), particularly air traffic con-
trollers, and is likely to evolve towards the design
of tightly human-centered systems. These systems
must be comprehensible to end-users, adaptable to
their mental and physical characteristics, and respon-
sive to their psychological states. In various domains
such as healthcare and criminal justice, the growing
interest in AI to support high-stakes human decisions
has driven the development of eXplainable AI (XAI).
XAI, short for Explainable Artificial Intelligence, is
a subfield of AI research dedicated to creating mod-
els and systems that offer understandable and inter-
pretable explanations for their decisions and actions
(Islam et al., 2022) (Wang et al., 2019). In the air
traffic controller domain, XAI is essential as it en-
sures the transparency and reliability of AI systems,
enabling controllers to trust and effectively collabo-
rate with AI tools, ultimately enhancing safety and
efficiency.
In Air Traffic Management (ATM), there is a
growing interest in XAI methods and techniques that
enable humans to understand: i) the AI algorithm
(i.e., global explanation or interpretability), and ii) its
solutions (i.e., local explanation or justification) (De-
gas et al., 2022). This interest has been manifested in
various projects, and this article presents the results
of one such project, the ARTIMATION project. This
project investigates how transparency can be provided
for different tasks in the ATM domain, taking both a
model-centric and user-centric approach, with the aim
of restoring the user’s role in the data analytical pro-
cess.
In preliminary work to identify the most promis-
ing tasks to address, as discussed in (Degas et al.,
2022), the consortium conducted an analysis of the
state of the art in AI and XAI for the ATM domain.
They developed a taxonomy consisting of four cate-
gories (prediction, optimization, analysis, and model-
ing) that are closely aligned with AI in general and
collectively define the objectives of the application:
• Prediction, paper seeking to foresee the future
behaviour of a subject.
• Optimisation/Automation, papers seeking to
enhance the behaviour of a subject.
• Analysis, papers seeking to understand the ob-
served behaviour of a subject (Post-Analysis or
Live).
• Modelling/Simulation, paper are modelling the
behaviour of subject in order to simulate it.
From within those categories, three levels of ex-
planation/transparency have been identified:
• Description: At the base level, Description pro-
vides an understanding of the AI system’s at-
tributes and inner workings, enabling users to
grasp its fundamental characteristics.
• Prediction: Building upon Description, Predic-
tion level allows users to anticipate the AI’s out-
comes, fostering a proactive approach to decision-
making.
• Prescription: At the highest level, Prescription
empowers users not only to predict but also to
take corrective actions in response to potential AI
errors or recommendations, ensuring safe and ef-
fective outcomes.
While these three levels can ensure safe and ef-
ficient AI-user collaboration, currently, we can only
aim to address the descriptive level. This paper
presents our initial attempt to provide such a descrip-
tive level and assess its impact on air traffic con-
trollers’ understanding and acceptability.
The remainder of this paper is structured as fol-
lows: Section 2 presents the AI methods used, the
techniques employed to enhance their explainability,
section 3 the validation methodology. Section 4 de-
scribes the results of our validation. Finally, Section
5 provides a summary of our findings and concludes
this study.
2 THE CONFLICT DETECTION
AND RESOLUTION TOOL
Air Traffic Controllers (ATCOs) play a critical role in
ensuring the safe and efficient movement of air traf-
fic within controlled airspace (Mackay, 1999). Their
primary responsibilities encompass traffic monitoring
and conflict resolution, tasks that demand acute sit-
uational awareness and rapid decision-making. As
guardians of the skies, ATCOs are entrusted with
preventing collisions and maintaining orderly traffic
flow. The nature of ATC work is inherently time-
dependent, involving continuous monitoring of air-
craft positions, altitudes, and trajectories (Letondal
et al., 2013). This dynamic environment introduces
stress and requires unwavering concentration from
controllers. Recognizing the challenges posed by the
complexity and pace of air traffic, there is a grow-
ing interest in incorporating artificial intelligence (AI)
to assist ATCOs. AI has the potential to enhance
the efficiency and safety of air traffic management
by providing real-time analysis, predictive capabili-
ties, and automated decision support (Hurter et al.,
Examining Decision-Making in Air Traffic Control: Enhancing Transparency and Decision Support Through Machine Learning,
Explanation, and Visualization: A Case Study
623
2014). However, the integration of AI in the ATC do-
main must prioritize transparency. ATCOs rely on a
deep understanding of the algorithms assisting them
to establish trust, ensure reliability, and facilitate ef-
fective teamwork between humans and AI systems.
A transparent level of explanation in AI algorithms is
crucial for fostering collaboration and mitigating con-
cerns related to the automation of critical tasks. This
approach not only enhances the performance of AI-
assisted air traffic management but also contributes to
the overall trustworthiness of the system. As the avia-
tion industry evolves, the careful balance between hu-
man expertise and AI assistance becomes paramount
in achieving a seamless and secure air traffic control
ecosystem.
In our paper, we delve into the investigation of
conflict resolution algorithms within the context of air
traffic control (ATC) due to the pivotal role these al-
gorithms play in ensuring the safety and efficiency
of airspace operations. As the complexity of air
traffic continues to grow, understanding and refin-
ing these algorithms becomes paramount for address-
ing the evolving challenges faced by air traffic con-
trollers, making it imperative to explore and enhance
the mechanisms that underpin conflict resolution in
this dynamic domain. Our Conflict Detection & Res-
olution task was performed using an Genetic Algo-
rithm (Durand and Gotteland, 2006). The model was
used to compute solutions of different conflicting sce-
narios, and the data produced by the Genetic Algo-
rithm during the resolution process was used to build
three model-centric visualisations.
2.1 Genetic Algorithm
In short, a Genetic Algorithm (GA) (Srinivas and Pat-
naik, 1994) describes a population and its evolution-
ary based on a Meta-Heuristic. This means that a
GA tries to iteratively improve candidate solutions ac-
cording to some predefined criteria (see Fig. 1). In
our conflict resolution case, a candidate solution for
the GA is a set of trajectories, some modified, some
not. Candidate solutions forming the population are
evaluated in function of three criteria: the duration
of the conflicts, if any; the length of the trajectories;
and the number of change of direction (i.e. order that
must be given to implement this candidate solution).
Once the GA has evaluated all candidate solution in
the population, it selects a set of candidate solution,
mostly the bests, but also other candidate solution to
better explore the solution space. The algorithm then
applies a set of mutation and crossover operations in
an attempt to enhance the population and to possibly
converge toward one of the optimal solutions (Durand
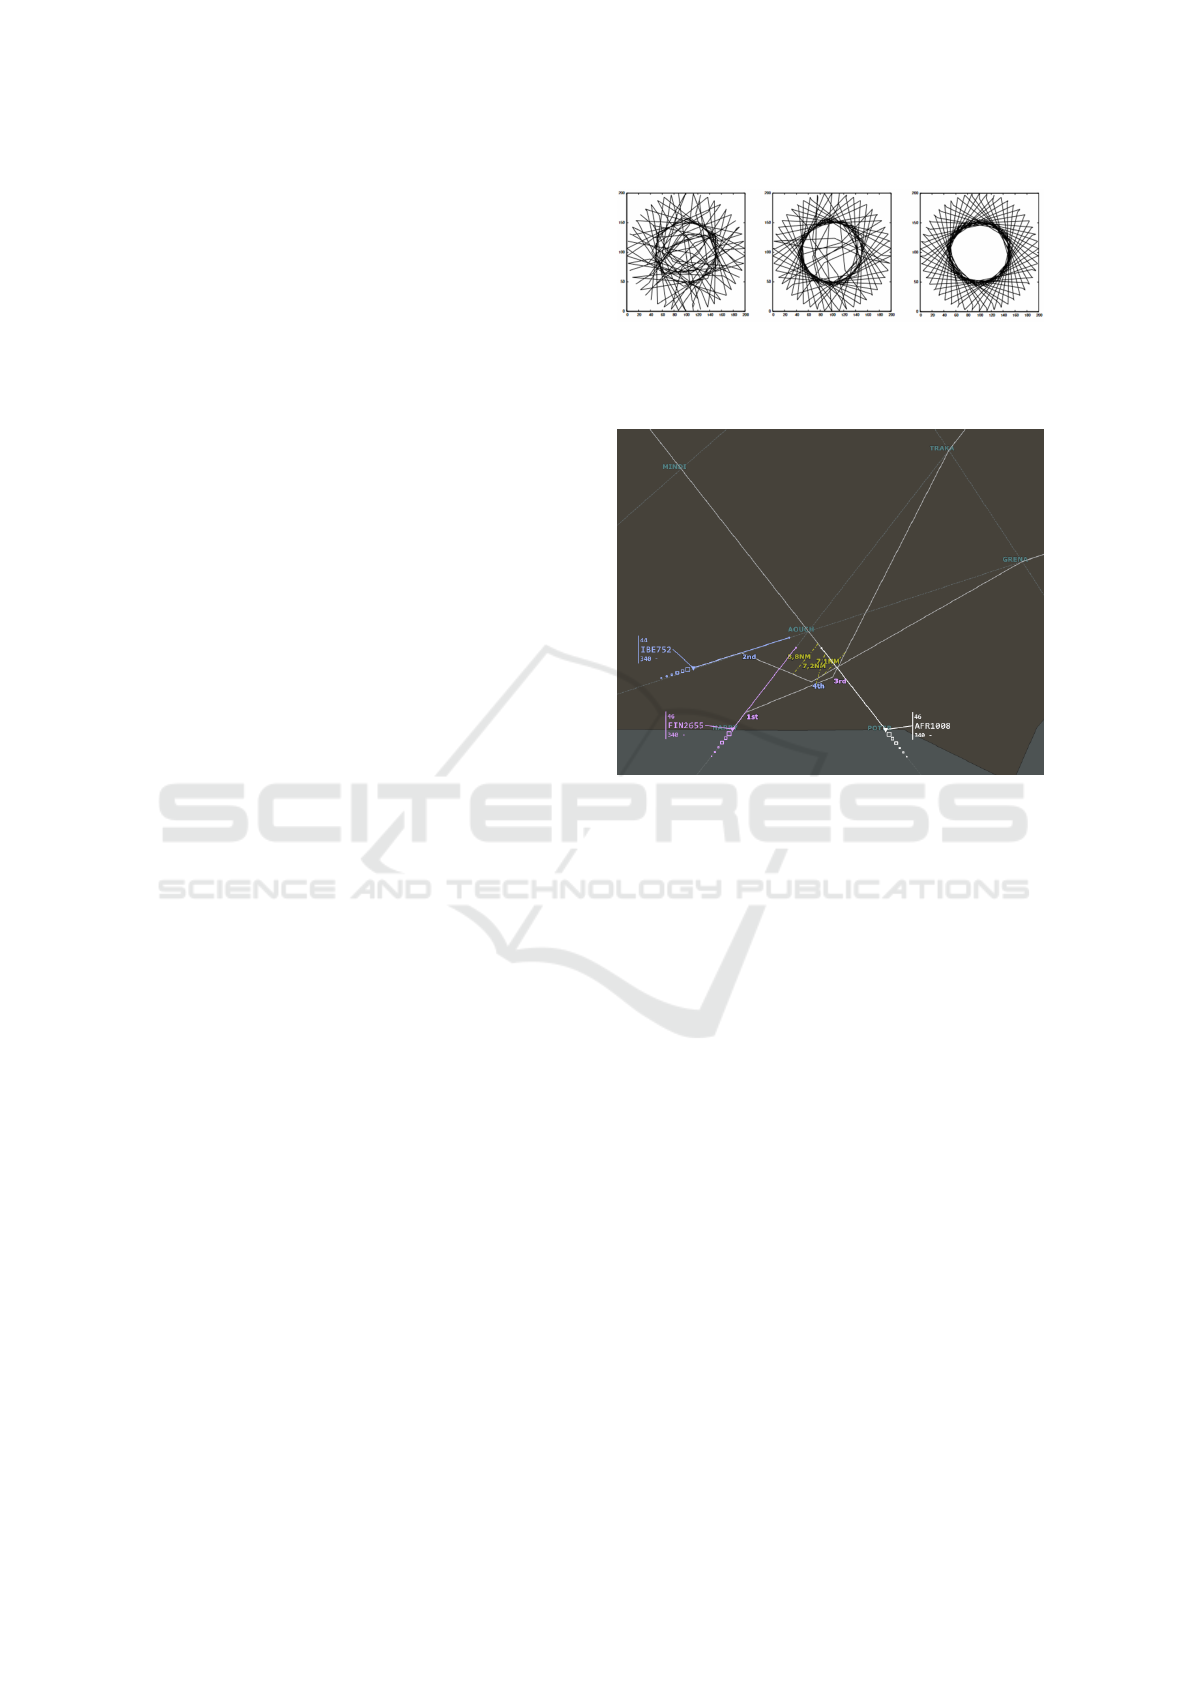
Figure 1: Evolution of the best candidate solution in func-
tion of the generation (i.e., iteration) for a conflict with 50
airplanes, from left to right: at the 250th, 500th, and 1000th
generation. Taken from (Durand, 2004).
Figure 2: Blackbox visualization the solution proposed by
the Genetic Algorithm. The air traffic control display of-
fers a detailed visualization of aircraft dynamics. Current
positions are represented by dynamic symbols, displaying
real-time data on altitude and heading. The speed vector
provides information on the aircraft’s current velocity.
and Gotteland, 2006).
2.2 Material of the Conflict Detection
and Resolution Tool
As previously explained, our GA explored the possi-
ble solution for a given conflicting situation between
aircraft and extracted one solution which is qualified
as the “best” one with the given optimization criteria
(number of actions, length of the trajectory, and num-
ber of orders). In order to provide explanation for the
proposed solution, we developed three different type
of data presentation which are detailed in the follow-
ing.
Black box (BB): This visualization is as simple as
possible and only displays the proposed solution by
the GA algorithm, enhanced by instructions to pro-
ceed (see Figure 2): Airplane trajectories are colored
differently. The minimal distance between airplanes
is computed and displayed in yellow. The control or-
ders that must be given by the ATCO to the differ-
ent airplanes are placed along the trajectory, as well
ICAART 2024 - 16th International Conference on Agents and Artificial Intelligence
624

Figure 3: Heatmap visualization the solution proposed by
the Genetic Algorithm. Green areas show the contour of
possible solutions, while the red area shows the location of
conflicting trajectories.
as their ordering (1st, 2nd . . . ). This data presenta-
tion is not an explanation by itself but the simple data
presentation of the “best” solution the GA algorithm
managed to extract. Compared to existing system,
the Black Box data representation directly provide a
solution to a detected conflict, while the system cur-
rently used only displays the detected conflicting air-
craft without further information to solve it.
Heat map (HM): To better explain the reason-
ing behind the proposed solution was made, we de-
cided to show on top of the proposed solution what
was explored by the GA, and if whether it was good
or bad. To do so, we created heatmaps of the ex-
plored trajectories showing how aircrafts trajectories
can safely be modified. In Figure 3, the operator can
see that: AFR3218 can only follow its trajectory or
go to the left (most probably it is less efficient and
not required). KLM1258 and EZY208 cannot follow
their trajectories and need to turn left (only possibil-
ity). In addition, users can see how much they can
wait to turn each airplane, by seeing the end of the
“safe zone” (green area) and the begin of the “dan-
gerous zone” (red area). Such data representation is
generated with the cumulative view of good and bad
solutions. Each solution is convoluted with a gaussian
kernel and then accumulated into a density map. Such
technique helps do visually define areas also called
contour maps (Scheepens et al., 2011).
Storytelling (SB): To better explain the proposed
solution, the final visualization, called the Storyboard,
depicts a timeline of events detailing the application
of measures to resolve the conflicting situation in air-
craft (See Figure 4). Possibly and alternate solution,
showing that other solutions can be made, but are less
efficient. Limit solution, showing what needs to be
done if the solution is not implemented right away to
avoid any conflict. We use existing Data Driven Sto-
rytelling technique with step-based explanations and
counterfactual explanations (Riche et al., 2018).
2.3 Methods of the Conflict Detection
and Resolution Tool (CD&R)
In total, 21 participants were recruited to participate
our validation sessions. The validation platform is
presented in Figure 5. Participants were recruited tar-
geting two populations, “Expert” and “Student”. For
the experts, 11 were recruited (3 female (27%), 8 male
(73%), mean age of 41 years (ranging between 34-51
years old)). The population was mostly composed of
ATCO instructors (7), former ATCO now in research
(2), and former ATCO now in ATCO formation (2).
For the students, 10 were recruited (4 female (40%),
6 male (60%), Mean age of 22 years old (ranging be-
tween 20-26 years old)) in the oldest formation avail-
able at their training center, just before they left its
premises to their affected in a Control Center.
10 validation Scenarios were created for the vali-
dation procedure. This simulation scenario was cre-
ated using a 2016 traffic record, in a fictious sector
created by a training center for ATCO formation. The
record was modified to create the conflict required for
the validation. The conflict was designed to create
different workload and difficulty of resolution, sim-
plified in two categories “Easy” and “Hard” by adding
aircrafts in the conflict—either following, or converg-
ing—or by modifying the contextual traffic. Our dif-
ferent levels of difficulty were verified with 3 ATCOs,
collecting their feelings about the scenario complex-
ity to solve every conflict.
The validation procedure of the CD&R tool was
designed to 1) primary tests the different level of ex-
plainability (Blackbox, Heatmap, Storyboard), while
2) decreasing as much as possible any risk of bias,
3) maximizing the quality of neurophysiological mea-
sures, and 4) keeping the experiment short enough.
As such, every scenario of conflict was following
4 different steps: 1) video of the simulation with the
conflict that has to be solved and the surrounding con-
textual aircrafts (45s), to gain situational awareness,
and emulate the classical work environment; 2) dis-
playing one type of explanation (Blackbox, Heatmap,
Storyboard) during a fixed time (60s), with the possi-
bility to go to the next phase after 30s, to avoid bore-
dom and disengagement; 3) ask the user to draw the
solution it want to give after seeing the solution pro-
posed; 4) answer questionnaires.
Every level of explanation was tested with three
different scenarios. The first scenario was used as a
Examining Decision-Making in Air Traffic Control: Enhancing Transparency and Decision Support Through Machine Learning,
Explanation, and Visualization: A Case Study
625
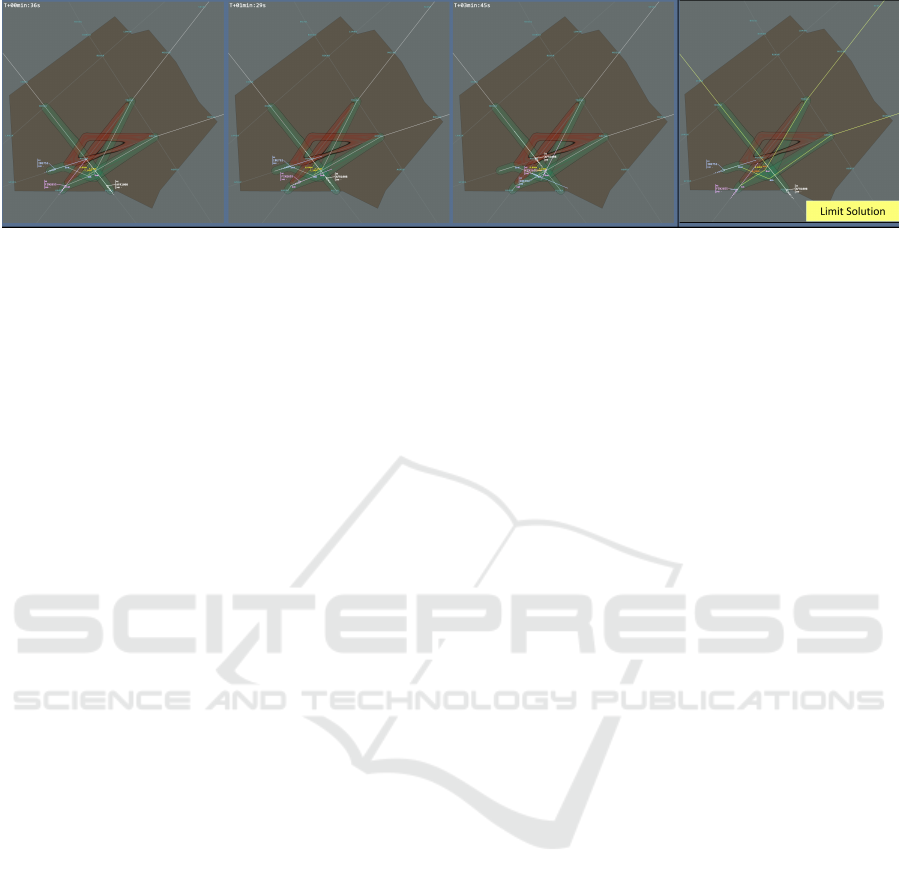
Figure 4: Storyboard presentation of the proposed solution. The sequence of images 1 to 3 shows the temporal steps to solve
the conflict. The limit solution shows the good solution but with is close the minimum separation criteria between conflicting
aircraft.
warmup, and the two others where the one data was
gathered for analysis (while still gathering data on the
first one, as control data). To avoid any bias linked
to the order of presentation, fatigue, or scenario, we
used a latin square to mix scenarios with level of ex-
planation, and the order of presentation of the differ-
ent level of explanation.
The number of scenarios presented was decided
in such way that the total experiment—from briefing,
setting neurophysiological sensors, testing each level
of explanation, and final debriefing, was not exceed-
ing 2h.
During this simulation phase, we administered
two different questionnaires in two different times.
After each scenario, participants were given a self-
report ad-hoc questionnaire
• Understanding (two Likert Scales from 1 to 5): 1)
understanding the proposed solution, and 2) why
it had been generated
• Agreement with the solution (Dicotomial
”Yes/No)
To have a more detailed categorization, we separated
each category (BB - Black Box; HM - Heat Map; SB
- StoryBoard) in two different complexity levels de-
pending on the scenario (E - Easy; H - Hard). Then,
after each condition, participants were given another
questionnaire made up of Likert Scales from 1 to 5, in
order to assess:
• The usability of the decision support system, di-
vided into 3 items (The ease to learn to operate
the tool, the clarity and understandably of the tool,
and its ease to use) (Bicchi and Pallottino, 2000).
• The trust on the solution (Hidalgo et al., 2021).
• The situational awareness when using the tool
(Endsley and Jones, 2013).
• The acceptability of the tool, with two items (The
will to use the tool in the future, and the apprecia-
tion of the interface) (Chiarella et al., 2022),
• The impact on work performance, with 4 items
(Decrease of conflict solving; Increase accuracy
solving conflict; Increase in work performance;
Ease to work) (Isaac and Ruitenberg, 2017).
3 QUANTITATIVE DATA -
QUESTIONNAIRES AND
NEUROPHYSIOLOGICAL
MEASURES
The results presented below derived from quantita-
tive self-report measurements, such as ad-hoc ques-
tionnaires (post-run and post-condition), and qualita-
tive assessments, meaning debriefings with the partic-
ipants. The statistical analyses have been performed
using Jamovi 2.2.5 (The Jamovi Project, 2023 https:
//www.jamovi.org/), and have been matched with
the neurophysiological measurements to assess the
impact of the 3 proposed visualisations on the Accep-
tance of the ATCO (split up into the constructs of Un-
derstanding, Agreement and Acceptability), and on
the Human Performance (composed by stress, work-
load, situation awareness, usability, trust, task per-
formance). Moreover, a correlation between accep-
tance and human performance has been performed.
Final qualitative considerations regarding the system
performance from the safety and extended impact
on ATM system point of view were gathered. The
participants were placed in ACHIL En-Route con-
trol setting, our simulation facilities. The control
screen was either displaying the simulation, the so-
lution and level of explanation, the drawing, or the
survey. Prior to the experiment, they were placed the
neurophysiological sensors, a Electro Dermal Activ-
ity (EDA) recording device (shimmer sensing) and
an electroencephalography (EEG) headset ( https:
//www.mindtooth-eeg.comMindtooth), both linked
to a Tablet embedding the Mindtooth recording suite,
ICAART 2024 - 16th International Conference on Agents and Artificial Intelligence
626

Table 1: Post-scenario questionnaire results.
Item
Average Score
Easy Hard
E-BB
a
E-HM
b
E-SB
c
H-BB
d
H-HM
e
H-SB
f
(Un1) “The solution was
easy to understand”
4.56 3.67 3.56 3.89 3.11 3.11
3.93 3.37
(Un2) “I understand why
the proposed solution has
been generated”
4.33 4.33 4.22 3.44 3.44 3.44
4.3 3.44
a
Easy-Black Box,
b
E-Heat Map,
c
Easy-Storyboard,
d
Hard-Black Box,
e
Hard-Heat Map,
f
Hard-StoryBoard
Table 2: Post-condition questionnaire results.
Category Item
Score
BB
a
HM
b
SB
c
Usability
(Us1) ”Learn to operate the tool would be easy for me” 4.11 3.56 2.78
(Us2) “I find the tool clear and understandable” 3.67 3.22 2.56
(Us3) “I find the tool easy to use” 3.56 3.56 3.33
Trust (T1) “I felt confident when using the tool” 2.89 3.22 3.11
Situation
Awareness
(SA1) “The tool improved my Situation Awareness of the conflict
presented”
3 3.11 3.22
Acceptability
(A1) “I would like to use this tool in the future” 3.22 2.23 2.78
(A2) “I like the new decision support interface” 3.78 2.67 2.22
Work
Performance
(Wp1) ”Using this tool in my job would allow me to solve con-
flicts faster”
3.22 3.11 2.89
(Wp2) “Using this tool in my job would increase my accuracy in
solving conflicts”
3.44 3.22 3.11
(Wp3) “Using this tool would improve my work performance” 3.33 2.78 2.89
(Wp4) “Using this tool would make my work easier” 3.56 3.11 3.52
a
Black Box,
b
Heat Map,
c
Storyboard
allowing a synchronized recording of both the signals,
and to put specific markers used for the following of-
fline analysis. In particular, the recorded EEG sig-
nal has been used to derive the approach-withdrawal
neurometric, related to the level of acceptance expe-
rienced by the user in front of a specific operational
solution. It has been calculated by the difference be-
tween the EEG alpha activity over the frontal rights
sites, and the EEG alpha activity over the frontal left
sites (Di Flumeri et al., 2017; Giorgi et al., 2021;
Borghini et al., 2017).
3.1 Self-Report Questionnaires
All the following data are expected to be framed in
Likert Scale from 1 to 5 values, 1 meaning “strongly
disagree”, 3 meaning “Neither agree or disagree”, and
5 meaning “strongly agree”. Understanding (i.e., how
much the provided explanation is clear and under-
standable by the ATCO). In terms of understanding
of how the advisory was generated, there were no
significant differences between conditions for the ex-
perts, with average scores showing they still under-
stood the AI outcome (BB:4.0; HM:3.5;SB:3.2). Stu-
dents reported a slightly higher understanding of the
resolution generation in the BB condition (BB: 4.4;
HM: 4.1; SB: 3.7). A significant positive correla-
tion between the two items of understanding has been
found. Therefore, the two items have been aggregated
to ease analyses. To assess the differences between
the three levels of visual explainability, an analysis
of variance (ANOVA) test has been conducted for the
understanding variable. After a post-hoc comparison
between the three levels, the BB condition resulted
Examining Decision-Making in Air Traffic Control: Enhancing Transparency and Decision Support Through Machine Learning,
Explanation, and Visualization: A Case Study
627
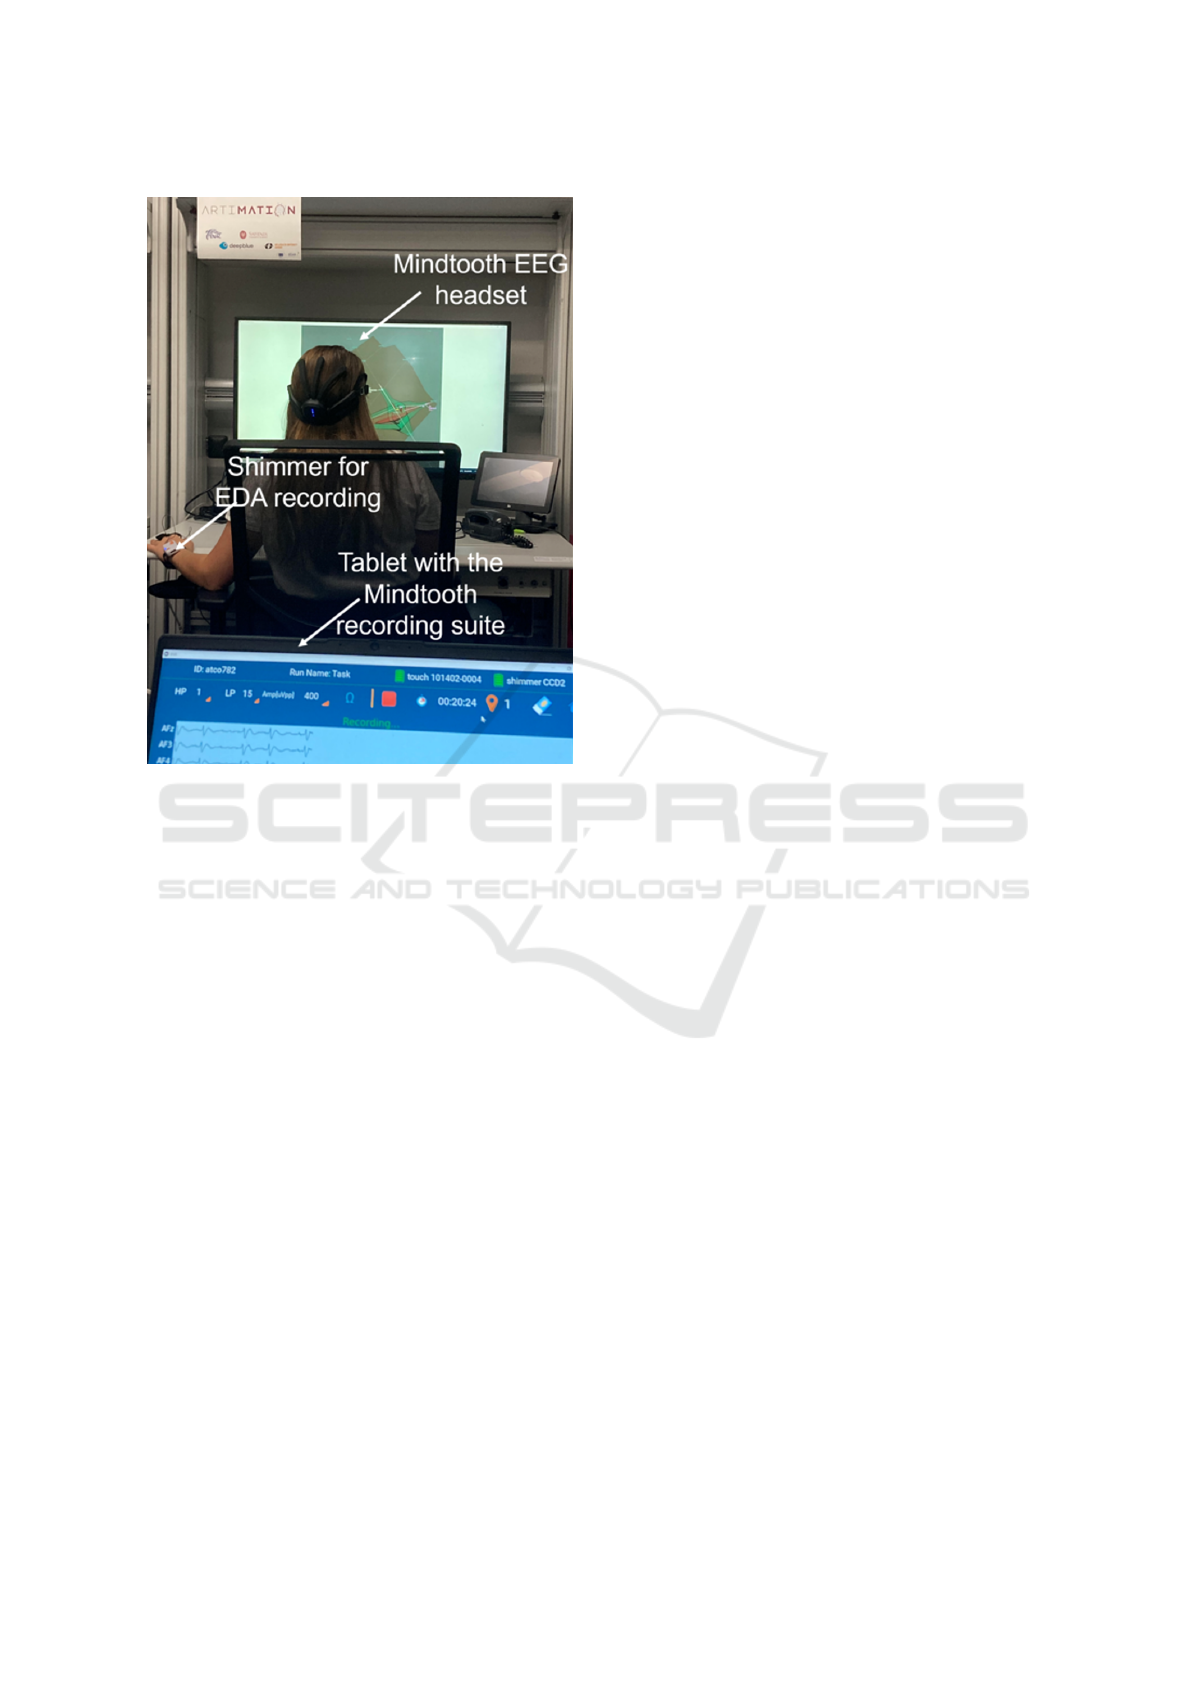
Figure 5: Validation setup for Neurophysiological Mea-
sures.
in a more understood AI outcome by all the sam-
ple than the Storyboard (SB) condition (p = 0.030).
Moreover, the post-hoc comparison between the ex-
pertise level of the participants showed a significant
difference in understanding between students and ex-
perts, resulting in the student group having a higher
understanding of the solution (p = 0.018). No other
significative differences were found. Agreement (i.e.,
the state for which a participant agrees with a spe-
cific solution provided by the AI). In general, experts
were accepting/agreeing with the proposed AI reso-
lution less frequently. In particular, in the Heat Map
(HM) condition the students reported a clearly higher
level or agreement compared with experts (Students
= 90Acceptability (i.e., the intention to accept a new
technology, the perceived usefulness and intuitive us-
ability in the technology other than having favourable
attitudes to adopt it, and the individual’s feelings,
favourable or unfavourable, about particular aspects
of the environment or objects related to the environ-
ment). A significant correlation between the 2 accept-
ability items (“I would like to use this tool in the fu-
ture”, “I like the new decision support interface”) has
been found. Therefore, the two acceptability items
have been merged. For the acceptability items, a
post-hoc comparison between the three conditions has
been conducted. The BB condition resulted being
significantly more acceptable than both the HM (p =
0.033) and the SB (p <0.001). No significative differ-
ences in the interaction between the condition and the
complexity of the scenarios has been found. To as-
sess the difference in the acceptability items between
the expertise and between conditions, an ANOVA test
has been conducted. After a post-hoc comparison, a
significant effect of the expertise on the acceptability
of the visual explanation has been found: the students
found the interfaces globally more acceptable than the
experts (p <0.001). A post-hoc comparison assess-
ing the interaction between the expertise level and the
condition has been conducted. All the explainabil-
ity conditions resulted significantly more acceptable
for the students than for the experts. The black box
was significantly more acceptable for students than
for the experts (p = 0.020), as for the heat map con-
dition (p <0.001) and for the Storyboard as well (p
= 0.001). Between the experts, the black box condi-
tion resulted being significantly more acceptable than
both the heat map (p = 0.021) and the storyboard (p
= 0.002). In the expert group, no significative differ-
ences between the heat map and the storyboard con-
dition have been found. Between the students, no
significant differences between conditions have been
found. Situational Awareness (i.e., the perception of
the elements in the environment within a volume of
time and space, the comprehension of their meaning
and a projection of their status soon) (Endsley, 1995).
An ANOVA has been conducted for the Situational
Awareness items, followed by a post-hoc comparison.
A significant difference between students and experts
has been found on the Situational Awareness items,
resulting in students having an improvement of situa-
tional awareness significantly higher than the experts
(p <0.001). For the Heat Map condition, students re-
sulted having a significantly higher improvement in
situational awareness than experts (p = 0.023). Us-
ability (i.e., quality attribute assessing how easy user
interfaces are to use and describing the easiness a
system allows a user to get to a specific goal). An
ANOVA has been conducted for the items of usabil-
ity. After a post-hoc comparison of the results of the
questionnaires for the usability items, in the whole
sample, the black box resulted significantly more us-
able than the storyboard condition (p = 0.049). At the
same time, globally, the students reported a signifi-
cantly higher usability of all the tools than the experts
(p <0.001). Between the experts’ group, the black
box condition resulted being significantly more us-
able than the storyboard (p <0.001). No other signifi-
cant differences have been found. Trust (i.e., a cogni-
tive state usually influencing the actual, behavioural
dependence on automation. The operator’s use of
ICAART 2024 - 16th International Conference on Agents and Artificial Intelligence
628
automation is related to his or her momentary trust,
which in turn is related to the type and frequency of
faults and operators’ confidence in their own ability).
To assess the differences between the condition and
the expertise level of the sample for the trust items, an
ANOVA has been conducted. After a post-hoc com-
parison, a significant difference between students and
experts has been found: students had a significantly
higher trust in the presented resolution advisory than
the experts (p = 0.009). No significant differences
between conditions have been observed. Task per-
formance (i.e., the effectiveness with which job in-
cumbents carry out activities that contribute to the or-
ganization’s ”technical core” either directly by exe-
cuting a part of its technical process or indirectly by
providing it with needed materials or services). The
4 items composing the work performance index has
been merged after a positive significant correlation
between the items has been found. The post-hoc com-
parison done after the ANOVA shows how students
reported a higher improved perceived work perfor-
mance independently on the conditions (p <0.001).
Between the two groups, students reported a signifi-
cantly more improved work performance than the ex-
perts (p = 0.032). The same result has been found for
the heat map condition (p = 0.048) and the storyboard
condition (p = 0.046). A correlation matrix to under-
stand if the items of the sub-constructs were measur-
ing the human performance and the acceptance was
performed between all the sample. A significant cor-
relation between the items has been found, therefore,
the items were merged to assess the correlation be-
tween the acceptance and the human performance.
After performing a correlation matrix between the ac-
ceptance and the human performance, a significant
correlation has been found: the human performance
while interacting with the XAI tools is correlated to
the acceptance of the solutions provided by the Ar-
tificial Intelligence (p <0.001). Therefore, we tried
to assess the correlation between the acceptance and
the human performance splitting the sample in experts
and students. In both the experimental groups a sig-
nificant correlation (p <0.001 in both cases) between
the acceptance and the human performance has been
found.
3.2 Neurophysiological Results
A repeated measures ANOVA (CI=0.95) has been
performed, by considering the two factors (i.e., con-
ditions [Black Box; Heat Map; Storyboard] and rep-
etitions [1st and 2nd]). The statistics has been per-
formed for each experimental group (i.e., students and
experts), to highlight any different.
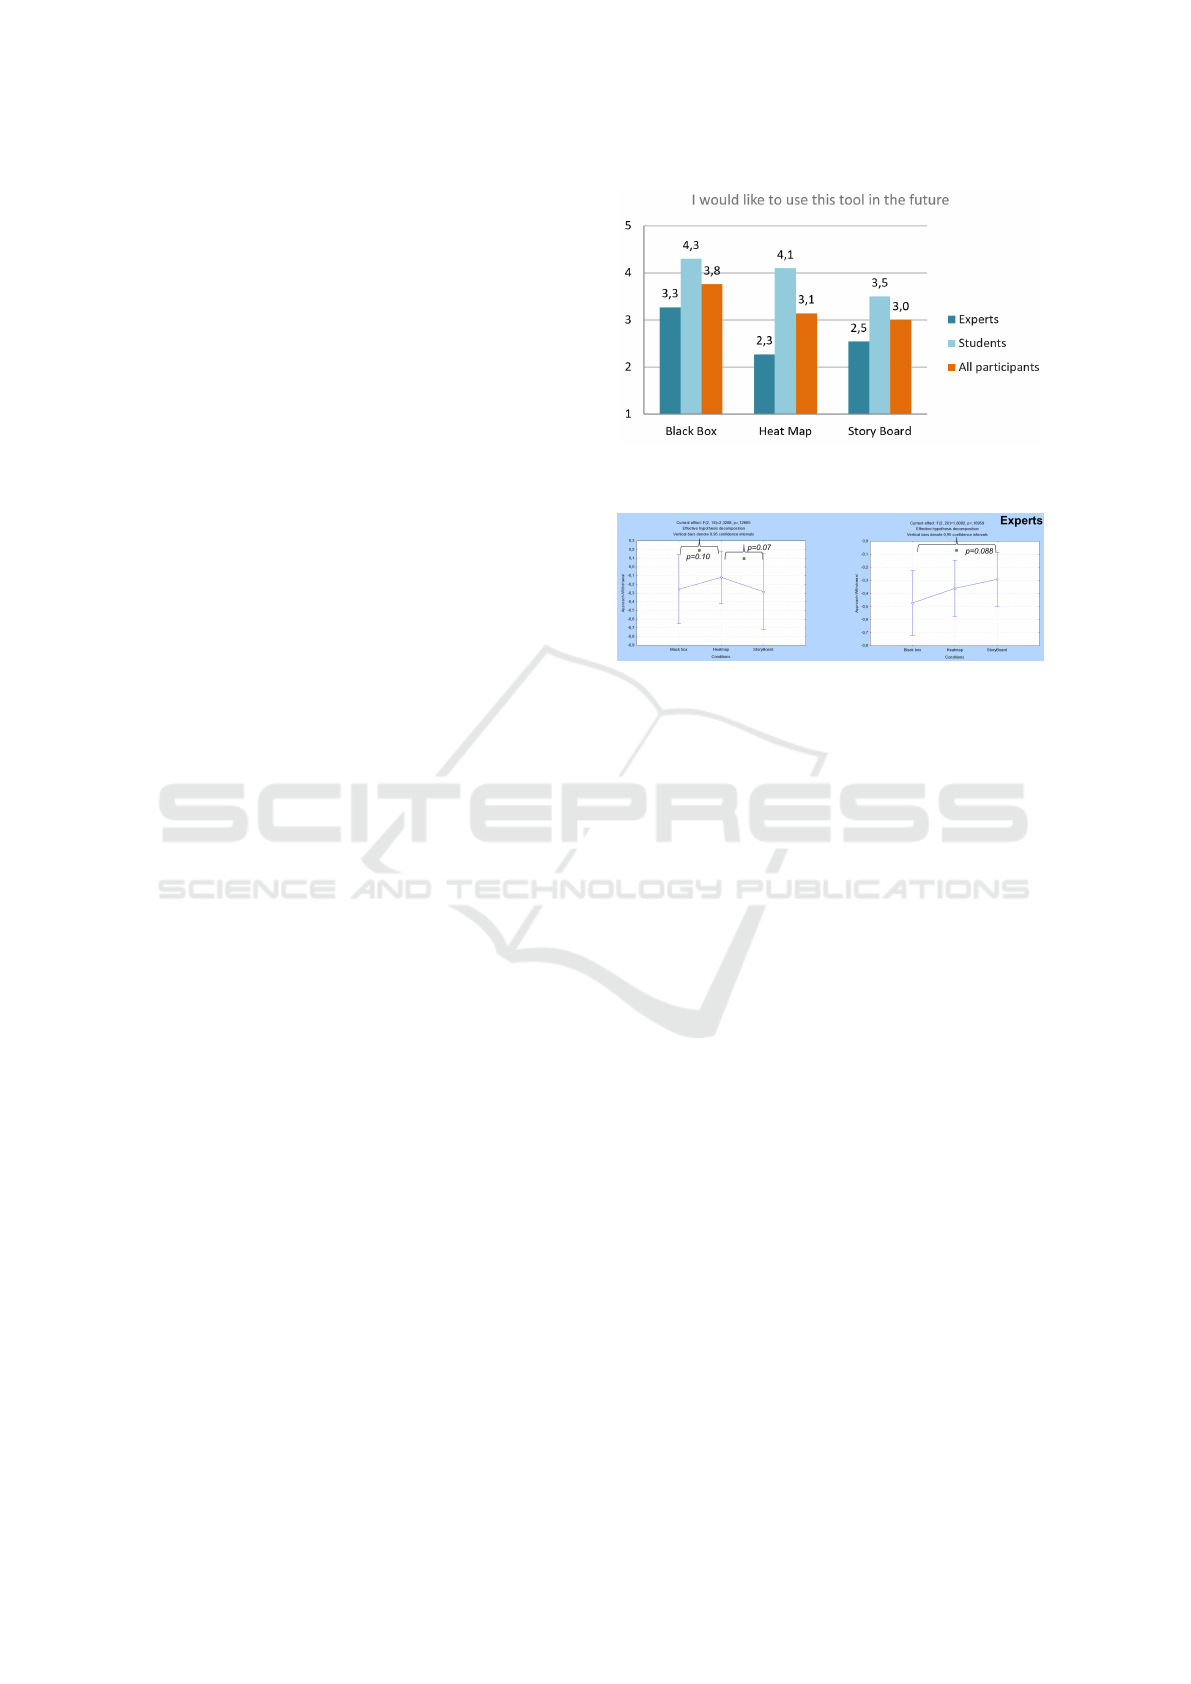
Figure 6: Post-condition questionnaire ‘Q: I would like to
use this tool in the future’ N=21.
Figure 7: Error bars showing for each experimental group
(i.e. students and experts) the difference in approach-
withdrawal index among the three experimental conditions.
The results showed a different behaviour between
students and experts. In particular, the students ex-
hibited the highest approach-withdrawal on the HM
solution, with respect to the other two conditions
(higher than BB solution, p = 0.1; higher than SB,
p = 0.07). Otherwise, experts experienced a higher
approach-withdrawal in correspondence of the SB so-
lution, that was higher (trend, p = 0.088) then the BB
condition. In detail, students exhibited the highest
approach-withdrawal (acceptability) on the HM solu-
tion. From the debriefings it was clear that student’s
acceptability from the HM solution was higher when
compared to experts. They mentioned that it was vi-
sually appealing, interesting and the use of colour was
appreciated. Another thing that was appreciated was
that it gives them more flexibility and does not point
them towards a single resolution, they can analyse
and come up with their own solution, but this could
become critical in terms of an overall high workload
scenario. The task that participants were performing
in this experiment focused on the resolution of sin-
gle conflicts, but it does not correspond to the overall
role of an En route ATCO, so the results also might
have been affected by the fact that it was focused on
a single task and therefore the analysis should take
this inconsideration. The task that participants were
performing in this experiment focused on the reso-
lution of single conflicts, but it does not correspond
to the overall role of an En route ATCO, so the re-
sults also might have been affected by the fact that it
Examining Decision-Making in Air Traffic Control: Enhancing Transparency and Decision Support Through Machine Learning,
Explanation, and Visualization: A Case Study
629

was focused on a single task and therefore the analysis
should take this inconsideration. Experts experienced
a higher approach-withdrawal (acceptability) towards
the SB solution, which was higher (trend) then the
black-box. Here the differences between conditions
were not significant but they are just a trend. Both
in questionnaires ratings an in the debriefings experts
mentioned their preference towards the BB solution,
they were that it was more straight forward, easy to
understand and mainly it allowed them to make their
decision in less time compared to the heat map (HM)
or the storyboard (SB) solution. One possible expla-
nation for this discrepancy between results of experts
could be related to the intrinsic bias induced by the
BB condition, especially on experts, that are of course
experienced and used to face with this kind of solu-
tions, with respect to the other two conditions, that,
despite the training, were still new. The approach-
withdrawal index is able to catch intrinsic (and in-
stantaneous) reactions coming from the user brain,
that are not by definition biased the experience, or by
the long thinking regarding the possible operational
use of this solution (that is instead measured by ques-
tionnaire post experiment). In other words, the in-
stinct and instantaneous reaction, suggest that the sto-
ryboard (and on average also the HM, but not signif-
icantly) could potentially be well accepted by the op-
erators, even more with respect to the BB, but the long
thinking of operators, suggests instead a possible lack
in effectiveness (Di Flumeri et al., 2017; Giorgi et al.,
2021; Borghini et al., 2017). During the debriefings,
when asked about their preference 11/11 ATCOs re-
ported that they preferred the Black box (BB) solu-
tion, even if one of them also liked the concept of the
Heat map (HM). The main reasons for the BB prefer-
ence were that it was more straight forward, easy to
understand and mainly it allowed them to make their
decision in less time compared to the heat map (HM)
or the storyboard (SB) solution. The students that pre-
ferred the HM mentioned the fact that it was visually
appealing, interesting and the use of colour was ap-
preciated. Participants that preferred also mentioned
that it gives them more flexibility, because they can
analyse and come up with their own solution. On the
downside it takes more time to analyse in more com-
plex conflicts or conflict with aircraft and that makes
it less suitable in situations in which the ATCO would
need to make a fast decision.
3.3 Qualitative Data - Semi-Structured
Interviews
Acceptance. During the debriefings, students gener-
ally favoured the HM visualization modality, citing its
visual appeal as their preferred resolution visualiza-
tion condition. Experts, on the other hand, were hesi-
tant to accept solutions not of their own creation, fear-
ing potential time loss in understanding tool proposals
and the risk of being ”out of the loop.” Experienced
ATCOs noted that their strategies, not considered in
the algorithm, involved intervening in multiple con-
flicts to avoid penalizing one flight too heavily. They
expressed uncertainty about the ML algorithm’s pa-
rameters for generating visual conflict resolution pro-
posals. The Genetic algorithm tended to propose in-
terventions in fewer aircraft. Some participants men-
tioned a lack of time to analyze and integrate AI so-
lution proposals. Regarding future tool use, students
showed interest in the BB and HM conditions despite
reported improvement needs, with preferences split
(6/10 for BB, 3/10 for HM, 1/10 for SB). Experts,
however, expressed a neutral stance on the BB con-
dition and disagreed on using the HM and SB tools,
unanimously favoring the BB condition during de-
briefings. Human Performance. During the debrief-
ings, both experts and students mentioned that the
BB solution configured as the less disruptive since
it followed a similar approach to most implemented
en-route tools and elements that the ATCOs are fa-
miliar with. Most of the participants mentioned that
it was clear, logical and did not clutter other infor-
mation on the screen (did not conceal other infor-
mation). They also mentioned that it was useful to
know the turning point of aircraft in the trajectory.
The fact that it provided a single resolution solution
was appreciated in conflicts that are more complex,
also if they involve more than two aircraft. Students
were the ones that highlighted the following benefits
of the HM solution. They pointed out that the vi-
sual component as an advantage and that they could
see which trajectories would be conflicting or not.
This visualisation provides also room for other op-
erational factors that might not be computed by the
algorithm like bad weather (turbulence). ATCOs can
easily trace the zones where the plane can pass in ad-
vance. One ATCO mentioned the projection of the
envelope was easier to remember than just a num-
ber of degrees that the BB solution provides, but the
level experience probably influences this opinion. In
general, participants mentioned that they would pre-
fer to have access to the tools on demand because they
were considered more useful in complex scenarios or
scenario in which they would be experiencing a high
level of workload. Trust. Experts reportedly were not
confident when using any of the solutions, but this
might have been impacted by the fact that they had
limited training and explanation. Some ATCOs, espe-
cially professional ATCOs, mentioned that they felt
ICAART 2024 - 16th International Conference on Agents and Artificial Intelligence
630

they would need more information and training on
how the Machine Learning (ML) algorithm in order
to trust it. ATCOs mentioned that trust in the solu-
tions is a requirement to use them in operations. That
trust must be acquired before or after operational us-
age, either in training, with briefing or even during
debriefings. Therefore, we can say that explainability
might be more relevant for applications for those pur-
poses. Task performance. During debriefings ATCO
students mentioned how the BB solution possible ad-
vantages solving conflicts in a faster way. System per-
formance. Safety. ATCOs mentioned that the HM
solution’s current design can impact safety by clutter-
ing and masking important information on the radar.
The SB concept in terms of implementation was re-
lated to the fact that the amount of information is not
calibrated for the type of En route task, so the time
the information takes to be analysed could create cog-
nitive tunnelling situations. More generally in terms
of XAI applications for conflict detection and reso-
lution tools, there could be a higher risk for ATCOs
to implement suggestions without checking what has
been (once the ATCO trust the tools). On the long
run relying on the tool could lowering ATCO the vig-
ilance and loose skills overtime. But of course, these
tool implementations would have to be followed by
new training requirements to mitigate the negative ef-
fect on performance that were just mentioned. Most
of the ATCOs mentioned that they find the solutions
proposed by the system were good but if they are
not matching their solution, it forces the ATCO to
think twice or ultimately doubt his own solution. One
ATCO complemented that he would be reluctant to
accept a solution that is not his own simply because he
might find himself in a situation that he does not feel
that he can rapidly recover, because at that point he
might be ‘out of the loop’. The participants that men-
tioned more frequently that the proposed solution was
making them doubt their own solutions were students
when the solutions was not matching their own. This
could point us in the direction of the importance of the
solutions conformance to the ATCOs strategies and
the impact on their acceptance and ultimately, safety.
The fact that the proposed solution is not matching
the solution of the ATCO could ultimately make him
loose more time analysing or worse, make them fall
behind what is going on in their sector. AI support
and types of conflicts Most participants felt that the
AI solutions proposed were not useful for conflicts
with two aircraft. They thought that the BB solution
could be useful in conflicts involving three or more
conflicts. On the other hand, the visualisation condi-
tions with more ‘explainability’ embedded, HM and
SB correspondingly, based on most debriefings were
considered less useful for more complex operational
scenarios, in short, less operationally acceptable. AT-
COs felt that in more complex scenarios or when they
are experiencing more workload, they could be more
willing to accept the solutions proposed by the tool.
In general, students and experts faced the AI decision
support in conflict resolution in two different ways
based on their feedback in debriefings. The experts
seem to tend to consistently compare the AI solution
with their own, assuming their solution is the best to
be surpassed by the AI proposal. On the other hand,
students put on the same level both their own solution
and the AI proposal, being more open to accept a pro-
posal that they did not come up with (higher level of
trust). XAI application in ATM. Most ATCOs men-
tioned that if they would need more time to analyse
and double check the proposals from the solution with
explainable AI solutions they tested and that could ul-
timately translate in an increased workload during op-
erations and/or possible loss of situational awareness
due cognitive tunnelling while using the tools. This
seem to point out that higher explainability could be
more useful for less timely critical or tasks or opera-
tional phases in which the ATCOs are subject to lower
risk of cognitive workload, like planning tasks. Train-
ing. Some ATCOs mentioned that it would be inter-
esting to explore and better understand the advantages
of the AI solutions for training. The main focus could
be on understanding how experts (maybe with differ-
ent approaches or goals) would solve or work in cer-
tain scenarios. To make them visualize trajectories
and different approaches based on different param-
eters could be very useful is to discuss and debrief.
During the debriefings and final discussion there was
not a univocal opinion on which solutions that would
be preferred for training uses. Each ATCO seemed to
have their own preference. What emerged was that
all solutions and AI in general were perceived as hav-
ing potential for training. The higher the visual XAI
the better for training, because they elicit better the
reasons behind the proposed conflict detection and on
the resolution itself. Participants even mentioned that
they could see the solutions with higher XAI visual-
isation to have potential to be used during trainings
with AI tools and once the trainees see how the ML
algorithm works and to build trust, with the support
of these solutions, they can start using the tools with
less visual XAI for the actual operations. Two AT-
COs alerted to the fact that using AI tools to learn
in conflict solving scenarios too early in the training
process could have drawbacks, since ATCOs could
end up mimicking the AI tools work strategy before
developing their own. Personalization of ML algo-
rithms and ATCO strategies. During the debriefings
Examining Decision-Making in Air Traffic Control: Enhancing Transparency and Decision Support Through Machine Learning,
Explanation, and Visualization: A Case Study
631

some ATCOs voiced their interest in the use of ap-
plications of AI and ML algorithms to learn strate-
gies from them. ATCO 18 reports “I think it would
be interesting if, when you arrive at the position, you
have a sort of profile of how you control it and the
AI adapts to each person, which would be amazing,
but I guess it would be something for the future.”.
Kirwan, Flynn, & Flynn (Kirwan et al., 2001) stud-
ied controllers across seven nations, and found gen-
eral agreement across controllers on the factors, rules,
and principles they used to devise en route resolution
strategies. Strategies were defined by four main di-
mensions:
• Formal rules—such as Letters of Agreement, or
the semi-circular rule;
• Principles—such as ‘minimise number of aircraft
to move,’ or ‘solve easy conflicts first’;
• Contextual factors—such as aircraft type, destina-
tion, distance to go; and
• ‘No-No’s’— control strategies, eleven in total,
that controllers will never use in conflict resolu-
tion. Examples include “never use speed as a res-
olution mechanism,” or “never leave conflict air-
craft not locked on heading.”
Westin (Westin, 2017) reviewed the MUFASA
project’s exploration of controller resolution strate-
gies both within- and across controllers, for reasons of
developing advisory automation. Using a classifica-
tion framework (i.e., resolution type/direction/degree
etc), it was shown that intra-controller agreement (i.e.
consistency) was higher than inter-controller agree-
ment, and that inter-controller agreement was lower
for specific manoeuvre choices. Having a ML algo-
rithm that learns ‘Principles’ and ‘Control strategies’
context based on a single ATCO or to a wider cate-
gory based on ATCO control strategies type would be
a way forward to improve AI support based on AT-
COs feedback.
4 LESSON LEARNED
What was shown in our project was that it is possible
to open black-boxes and explain AI models in ATM
domains. The lesson learned from the validation out-
comes are summarized in the following.
XAI - Negative Effects: XAI / Transparency might
have negative effects on performance and acceptabil-
ity in conflict resolution tasks Most ATCOs men-
tioned that if they would need more time to analyse
and double check the proposals with higher XAI and
that could ultimately translate in an increased work-
load during operations and/or in the worst case caus-
ing cognitive tunnelling while using the tools.
XAI - Temporal Constraint: XAI/Transparency
should be applied in operational phases that are not
so timely constrained. In the end, for time pressured
task, we would recommend not giving explanations as
it adds workload to the ATCOs as they compare their
solutions with the one given. Instead, having visuals
that ease the creation of a mental model to solve the
problem would be recommended. This doesn’t ex-
clude adding transparency to the system that will be
used in operational phase that are timely constrained.
Transparency will still be useful in post-operation to
understand unexpected behaviour, in integration or
tool development to verify the behaviour of the AI
system, or in training with the operators to gain trust
in the system. We recommend just to not use it when
a decision needs to be taken in a very short amount of
time.
XAI - Parameters: The parameters that are used
to train the algorithms should be carefully selected
because they can introduce bias in the AI /propos-
als. Any multi-criteria optimising system will in-
troduce some bias if the criteria are truly indepen-
dent. Proposing different solution considering differ-
ent parameters could be a solution, conforming the
behaviour of the system to the operator behaviour
could also be one.
XAI - Acceptability: Conformal AI solutions have
the potential to achieve higher acceptance from AT-
COs. More conformal decision aids, meaning aids
that are closer to individual problem-solving styles,
can improve acceptance. On a final note, participants
voiced their interest in the use of applications of AI
and ML algorithms to learn strategies from them.
AI Teaming: Transparency could support humans
in building Trust in AI tools. Trust in the solutions or
tools that involve AI is a requirement to use it in op-
erations, there should be no surprises. ATCOs while
dealing with these tools and they should know how
the tools work, how the ML algorithms are learning,
and which type of variables are used while learning
and they should know the limitations of those same
tools. Our results highlighted those participants dur-
ing the CD&R visualisation tools experiment agreed
that trust in these tools has to be acquired before
or right after operational usage, meaning as training,
with briefing or even during debriefing tools. There-
fore, XAI can potentially be more important during
ICAART 2024 - 16th International Conference on Agents and Artificial Intelligence
632

those phases and not during the operational use of AI
tools.
Innovation in ATM: Less trained ATCOs might be
more willing to adopt new tools and innovative HMIs.
ATCO experts are biased toward using the tool they
are used to have. One working several years with the
same tools require a lot of time to work with new tools
and accept them. Simple training in a validation pro-
cess will hardly correct this bias. As such, having
experienced and less experienced participants during
the validation is important take this bias into account.
Critical Domain: Using optimal tools and expla-
nations of the tools during training could be benefi-
cial Based on previous lessons, we can hypothesise
that using Explainable AI for training purposes can be
helpful in safety-critical and time-pressured tasks in
creating a different mental model of the conflict, hav-
ing the opportunity to be trained both in elaborating
a functional solution and comparing it to an optimal
one.
5 CONCLUSIONS
This paper reports several positive outcomes, no-
tably emphasizing the importance of trust-building
in air traffic control through Explainable AI (XAI)
and transparency. These elements played a pivotal
role in encouraging the acceptance of AI tools in op-
erational settings. During less time-constrained op-
erational phases, the integration of XAI and trans-
parency mechanisms not only enhanced understand-
ing but also contributed to more efficient decision-
making processes among ATCOs. Additionally, the
careful selection of AI algorithm parameters was
highlighted as a valuable practice for mitigating bias,
ensuring fair and accurate decision-making. Person-
alized, conformal decision aids tailored to individual
problem-solving styles were well-received, leading to
increased acceptance and user satisfaction among AT-
COs. Furthermore, the introduction of AI explainabil-
ity during training phases was deemed transformative,
boosting ATCOs’ confidence and competence, partic-
ularly in safety-critical and time-sensitive tasks. This
reflects a positive outlook for the future of AI in air
traffic management, characterized by trust, efficiency,
fairness, and innovation. In summary, the ARTIMA-
TION project not only demonstrated the feasibility of
XAI in ATM but also revealed a series of positive out-
comes, ranging from improved trust and performance
to bias mitigation and innovation support. These find-
ings pave the way for a more efficient, adaptable, and
user-friendly future in air traffic management.
While ARTIMATION marked a significant start-
ing point in unraveling the potential of Explainable
AI (XAI) in air traffic control (ATC), it has become
evident that further exploration is essential to fully
comprehend how XAI could benefit the field. This
realization has paved the way for future work in the
form of the TRUSTY project, which represents the
next phase in advancing our understanding and ap-
plication of XAI within ATC. TRUSTY is envisioned
as a promising continuation of this journey. Its pri-
mary mission, in the context of forthcoming efforts,
is to harness the capabilities of artificial intelligence
(AI) to bolster efficiency and enhance safety in the
global deployment of Remote Digital Towers (RDT).
Building upon the foundation laid by ARTIMATION,
TRUSTY will place a heightened focus on trans-
parency and trustworthiness in the decision-making
processes of AI systems operating within the complex
context of RDT.
ACKNOWLEDGEMENTS
This work was financed by the European Union’s
Horizon 2020 within the framework SESAR 2020 re-
search and innovation program under grant agreement
N. 894238, project Transparent artificial intelligence
and automation to air traffic management systems,
ARTIMATION and N. 101114838, Trustworthy in-
telligent system for remote digital tower, TRUSTY,
HORIZON-SESAR-2022-DES-ER-01.
REFERENCES
Bicchi, A. and Pallottino, L. (2000). On optimal cooperative
conflict resolution for air traffic management systems.
IEEE Transactions on Intelligent Transportation Sys-
tems, 1(4):221–231.
Borghini, G., Aric
`
o, P., Di Flumeri, G., Sciaraffa, N.,
Colosimo, A., Herrero, M.-T., Bezerianos, A., Thakor,
N. V., and Babiloni, F. (2017). A new perspective for
the training assessment: Machine learning-based neu-
rometric for augmented user’s evaluation. Frontiers in
Neuroscience, 11.
Chiarella, S. G., Torromino, G., Gagliardi, D. M., Rossi, D.,
Babiloni, F., and Cartocci, G. (2022). Investigating the
negative bias towards artificial intelligence: Effects of
prior assignment of ai-authorship on the aesthetic ap-
preciation of abstract paintings. Computers in Human
Behavior, 137:107406.
Council of Europe (2020). History of artificial intelligence.
Examining Decision-Making in Air Traffic Control: Enhancing Transparency and Decision Support Through Machine Learning,
Explanation, and Visualization: A Case Study
633

Degas, A., Islam, M. R., Hurter, C., Barua, S., Rahman, H.,
Poudel, M., Ruscio, D., Ahmed, M. U., Begum, S.,
Rahman, M. A., Bonelli, S., Cartocci, G., Di Flumeri,
G., Borghini, G., Babiloni, F., and Aric
´
o, P. (2022). A
survey on artificial intelligence (ai) and explainable ai
in air traffic management: Current trends and devel-
opment with future research trajectory. Applied Sci-
ences, 12(3).
Di Flumeri, G., Aric
`
o, P., Borghini, G., Sciaraffa, N.,
Maglione, A. G., Rossi, D., Modica, E., Trettel, A.,
Babiloni, F., Colosimo, A., and Herrero, M. T. (2017).
Eeg-based approach-withdrawal index for the pleas-
antness evaluation during taste experience in realistic
settings. In 2017 39th Annual International Confer-
ence of the IEEE Engineering in Medicine and Biol-
ogy Society (EMBC), pages 3228–3231.
Di Flumeri, G., De Crescenzio, F., Berberian, B., Ohneiser,
O., Kramer, J., Aric
`
o, P., Borghini, G., Babiloni, F.,
Bagassi, S., and Piastra, S. (2019). Brain–computer
interface-based adaptive automation to prevent out-of-
the-loop phenomenon in air traffic controllers dealing
with highly automated systems. Frontiers in human
neuroscience, 13:296.
Durand, N. (2004). Algorithmes G
´
en
´
etiques et autres
m
´
ethodes d’optimisation appliqu
´
es
`
a la gestion de
trafic a
´
erien. Habilitation
`
a diriger des recherches,
INPT.
Durand, N. and Gotteland, J.-B. (2006). Genetic Al-
gorithms Applied to Air Traffic Management. In
Metaheuristics for Hard OptimizationMethods and
Case Studies, volume Chapter 9, pages pp 277–306.
Springer.
Endsley, M. R. (1995). Toward a theory of situation aware-
ness in dynamic systems. Human factors, 37(1):32–
64.
Endsley, M. R. and Jones, W. (2013). Situation awareness.
The Oxford handbook of cognitive engineering, 1:88–
108.
Giorgi, A., Ronca, V., Vozzi, A., Sciaraffa, N., di Florio, A.,
Tamborra, L., Simonetti, I., Aric
`
o, P., Di Flumeri, G.,
Rossi, D., and Borghini, G. (2021). Wearable tech-
nologies for mental workload, stress, and emotional
state assessment during working-like tasks: A com-
parison with laboratory technologies. Sensors, 21(7).
Hidalgo, C. A., Orghian, D., Canals, J. A., De Almeida, F.,
and Martin, N. (2021). How humans judge machines.
MIT Press.
Hurter, C., Conversy, S., Gianazza, D., and Telea, A. C.
(2014). Interactive image-based information visual-
ization for aircraft trajectory analysis. Transportation
Research Part C: Emerging Technologies, 47:207–
227.
Isaac, A. R. and Ruitenberg, B. (2017). Air traffic control:
human performance factors. Routledge.
Islam, M. R., Ahmed, M. U., Barua, S., and Begum, S.
(2022). A systematic review of explainable artificial
intelligence in terms of different application domains
and tasks. Applied Sciences - Computing and Artifi-
cial Intelligence (Special Issue: Explainable Artificial
Intelligence (XAI)), pages 1–38.
Kirwan, B., Flynn, M., and Bretigny, F. (2001). Identifica-
tion of air traffic controller conflict resolution strate-
gies for the cora (conflict resolution assistant) project.
In Proceeddings of the 4th USA/Europe Air Traffic
Management R&D Seminar, pages 3–7.
Letondal, C., Hurter, C., Lesbordes, R., Vinot, J.-L., and
Conversy, S. (2013). Flights in my hands: coherence
concerns in designing strip’tic, a tangible space for
air traffic controllers. In Proceedings of the SIGCHI
Conference on Human Factors in Computing Systems,
pages 2175–2184.
Mackay, W. E. (1999). Is paper safer? the role of paper
flight strips in air traffic control. ACM Transactions
on Computer-Human Interaction (TOCHI), 6(4):311–
340.
Riche, N. H., Hurter, C., Diakopoulos, N., and Carpendale,
S. (2018). Data-driven storytelling. CRC Press.
Scheepens, R., Willems, N., van de Wetering, H., An-
drienko, G., Andrienko, N., and van Wijk, J. J. (2011).
Composite density maps for multivariate trajectories.
IEEE Transactions on Visualization and Computer
Graphics, 17(12):2518–2527.
Srinivas, M. and Patnaik, L. M. (1994). Genetic algorithms:
A survey. computer, 27(6):17–26.
Wang, D., Yang, Q., Abdul, A., and Lim, B. Y. (2019). De-
signing Theory-Driven User-Centric Explainable AI.
In Proceedings of the 2019 CHI Conference on Hu-
man Factors in Computing Systems - CHI ’19, pages
1–15, New York, New York, USA. ACM Press.
Westin, C. (2017). Strategic conformance: Exploring ac-
ceptance of individual-sensitive automation for air
traffic control.
ICAART 2024 - 16th International Conference on Agents and Artificial Intelligence
634
