
Exploring BERT for Predicting Vulnerability Categories in Device
Configurations
Dmitry Levshun
a
and Dmitry Vesnin
b
St. Petersburg Federal Research Center of the Russian Academy of Sciences, 39, 14th Line V.O.,
St. Petersburg, 199178, Russia
Keywords:
Vulnerability Prediction, Vulnerability Categorization, Attack Graph, CPE, CVE, CVSS, BERT.
Abstract:
Attack graphs have long been a popular method for modelling multistep attacks. They are useful for assessing
the likelihood of network hosts being compromised and identifying attack paths with the highest probability
and impact. Typically, this analysis relies on information about vulnerabilities from open databases. However,
many devices are not included in these databases, making it impossible to utilize information about their
vulnerabilities. To address this challenge, we are exploring different modifications of BERT in prediction
of vulnerability categories in devices configurations. Our goal is to predict vulnerability categories in new
versions of vulnerable systems or systems with configurations close to vulnerable ones. In this work, each
device configuration is represented as a list of Common Platform Enumeration descriptions. We categorized
vulnerabilities into 24 groups based on their access vector, initial access, and obtained access rights—metrics
derived from the Common Vulnerabilities and Exposures within the Common Vulnerability Scoring System.
During the experiments, we initially compared the performance of BERT, RoBERTa, XLM-RoBERTa, and
DeBERTa-v3. Following this comparison, we used hyperparameter optimization for the model with the best
performance in each metric prediction. Based on those predictions, we evaluated the performance of their
combination in prediction of vulnerability categories.
1 INTRODUCTION
Information security specialists, scientists, and enthu-
siasts all over the world are working hard to ensure
that network systems are protected from the malicious
activity (Levshun et al., 2020). The task is compli-
cated by a wide variety of threats and security require-
ments (Li et al., 2019), especially when protecting In-
ternet of Things systems (Levshun et al., 2021).
One of the popular approaches to secure network
systems is to generate attack graphs (Lallie et al.,
2020). These graphs represent all available paths for
intruders through the system, enabling the analysis
of both the prerequisites and consequences of mali-
cious activities (Liu, 2020). In these graphs, each de-
vice is depicted as a node, with connections between
nodes determined by both the network policy and the
intruder’s potential to compromise these devices. In
general, the possibility of devices to be compromised
depends on the presence of vulnerabilities in the con-
figuration of devices (Ferrara et al., 2021).
a
https://orcid.org/0000-0003-1898-6624
b
https://orcid.org/0009-0004-8620-2996
The most known format for vulnerabilities de-
scription is Common Vulnerabilities and Exposures
(CVE) (Vulnerabilities, 2005). CVEs are stored in
different open databases, the most popular of which is
National Vulnerability Database (NVD) (Zhang et al.,
2011). NVD contains nearly 200 thousand CVEs,
while each CVE has its unique identifier, description,
references, vulnerable configurations, etc.
Vulnerable configurations are defined with the
help of logical expressions, that are combining mul-
tiple Common Platform Enumeration Uniform Re-
source Identifiers (CPE URIs) with the help of logi-
cal OR and AND (Cheikes et al., 2011). CPE URI is
a structured naming scheme for all kinds of applica-
tions, operating system, firmware, and hardware.
The issue is that configurations of many devices
are not described in open databases. It means that
information about their vulnerabilities can’t be used
during the attack graphs generation. Thus, any work
related to the vulnerabilities’ prediction in unknown
configurations is very welcome. And because each
vulnerability is unique, most of the approaches are fo-
cusing on the prediction of vulnerabilities’ metrics.
452
Levshun, D. and Vesnin, D.
Exploring BERT for Predicting Vulnerability Categories in Device Configurations.
DOI: 10.5220/0012471800003648
Paper published under CC license (CC BY-NC-ND 4.0)
In Proceedings of the 10th International Conference on Information Systems Security and Privacy (ICISSP 2024), pages 452-461
ISBN: 978-989-758-683-5; ISSN: 2184-4356
Proceedings Copyright © 2024 by SCITEPRESS – Science and Technology Publications, Lda.

Metrics of vulnerabilities are described in accor-
dance with the Common Vulnerability Scoring Sys-
tem standard (CVSS). Currently, the 2nd (CVSS v2)
and 3rd versions (CVSS v3) are mostly used (Mell
et al., 2006), while the 4th version was just presented
and is not used in open databases yet (CVSS v4).
Those standards contain multiple metrics, 12 for
CVSS v2 and 9 for CVSS v3.
For the attack graphs, the most important ones
are access vector (available in CVSS v2 and
CVSS v3, access vector), privileges required (avail-
able in CVSS v3 only, privileges required) and
obtained privileges (available in CVSS v2 only,
obtain all privileges, obtain user privileges and ob-
tain other privileges.
Those three metrics define the prerequisites
and consequences of the vulnerability exploitation,
namely, how it is required to connect to the vulnerable
device (access vector), what privileges are required
to exploit the vulnerability (privileges required) and
what privileges are obtained by the intruder after the
exploitation (privileges obtained).
In our previous work, we used those metrics to
divide all CVEs into 24 categories (Levshun and
Chechulin, 2023). In this work, we are exploring
different BERT modifications to predict those cate-
gories in devices based on their configurations. This
research is based on the following assumption:
• CPE URIs that are connected with same cate-
gories of CVE are more similar to each other
than CPE URIs that are connected with other cat-
egories. Thus, we can predict categories of CVE
for devices based on their CPE URIs.
To the best of our knowledge, this work in one
of the first in prediction of vulnerabilities in devices
based on their configuration, highlighting its scientific
significance and novelty. Moreover, we believe that it
is first in exploring BERT modifications for this task.
Our main contributions are as follows:
• We compared the performance of BERT modifi-
cations using fine-tuning on data for each CVSS
metric separately (access vector, privileges re-
quired and privileges obtained).
• BERT showed the best results, thus we compared
its performance with different hyperparameters.
The results allowed us to select models with the
best performance for each CVSS metric.
• We combined predictions of the selected models
and used them for the prediction of vulnerability
categories. We achieved 73.82 % accuracy at best,
with 84.67 % of predictions considered useful.
We define useful predictions as follows – if all pre-
dicted categories are present in the correct answer,
then this prediction is useful. But if any predicted
category is not present in the correct answer, then this
prediction is not useful.
For example, if correct prediction is C114 C224
C334, and our solution predicted exactly those cat-
egories, then it is accurate. Predictions, that con-
tain any combination of C114, C224, and C334 with-
out any other categories are considered as useful.
Any other predictions, for example, C114 C224 C334
C131, are considered as incorrect.
We consider some not accurate predictions as use-
ful, because they are not leading to consideration of
vulnerabilities that are not present in devices config-
urations. Thus, while using such predictions, we use
incomplete, but not erroneous information.
The paper is organized as follows. Section 2 pro-
vides the context underlying the work done. In Sec-
tion 3 we consider the state of the art in the area
of vulnerability categorization and prediction. Sec-
tion 4 describes the pipeline we used to explore the
performance of BERT modifications. In Section 5 we
present the dataset used as well as conditions and re-
sults of the evaluation of BERT modifications. We
consider the results of the experiments in Section 6.
In Section 7 we present conclusions and describe fu-
ture work directions.
2 BACKGROUND
In this section we describe what is considered as vul-
nerabilities in Section 2.1, metrics of vulnerabilities
in Section 2.2, categories of vulnerabilities in Sec-
tion 2.3, and configurations of devices in Section 2.4.
We also provide technical details on BERT modifica-
tions used in Section 2.5.
2.1 CVEs
Common Vulnerabilities and Exposures is a format
for vulnerabilities description. This format was firstly
introduced in the framework of CVE Program, which
mission is to identify, define, and catalogue publicly
disclosed cybersecurity vulnerabilities.
According to the format, there is one CVE record
for each vulnerability in the catalogue. CVEs are
discovered, then assigned and published by organiza-
tions from all around the world. Such organizations
are called CVE Numbering Authorities.
Each CVE record has data about vulnerability
identifier, description, references, vulnerable config-
urations, CVSS metrics of 2nd and/or 3rd versions,
as well as related weaknesses (Common Weaknesses
Enumeration, CWE (Christey et al., 2013)).
Exploring BERT for Predicting Vulnerability Categories in Device Configurations
453

CVE identifiers are unique and starting with
“CVE-” following by the year of assignment and
unique number, for example, CVE-2023-0687. This
vulnerability was published on 02/06/2023 and last
modified on 11/06/2023. It leads to buffer overflow
and was found in GNU C Library 2.38. This vul-
nerability affects the function monstartup of the file
gmon.c of the component Call Graph Monitor.
CVE-2023-0687 has base score equal to 9.8
out of 10.0, and is considered as a critical
one. This vulnerability has only CVSS v3 met-
rics, that are defined by the following vector:
“AV:N/AC:L/PR:N/UI:N/S:U/C:H/I:H/A:H”.
2.2 CVSS
Common Vulnerability Scoring System is a standard
for representing metrics of CVEs. All CVSS v2 and
v3 metrics, that we are considering useful for the at-
tack graphs construction, are presented in Table 1.
Table 1: CVSS metrics for attack graphs.
CVSS v2 CVSS v3
PHYSICAL
LOCAL
LOCAL
ADJACENT NETWORK ADJACENT NETWORK
Access vector
NETWORK NETWORK
NONE
LOWPrivileges required
HIGH
NONE NONE
PARTIAL LOWConfidentiality
COMPLETE HIGH
NONE NONE
PARTIAL LOWIntegrity
COMPLETE HIGH
NONE NONE
PARTIAL LOW
Impact
Availability
COMPLETE HIGH
TRUE
ALL
FALSE
TRUE
USER
FALSE
TRUE
Privileges obtained
OTHER
FALSE
It can be noted, that all metrics are represented
as a categorical type of data with a limited number
of predefined values. LOCAL access vector from
CVSS v2 was divided into PHYSICAL and LOCAL
access vector in CVSS v3. Also, in CVSS v2 there
is no privileges required metric, while in CVSS v3
– no privileges obtained. Last time we checked, there
were 199 996 CVEs in NVD, 173 952 of which had v2
metrics and 115 651 – v3 metrics. Both metrics were
available only for 100 581 of CVEs. It means that if
we need to use CVSS v2 for privileges required and
CVSS v3 for privileges obtained, then we can work
only with the half of CVEs.
2.3 Categories of Vulnerabilities
We divided all CVEs into 24 categories, see Table 2.
Table 2: CVE categories description.
Description
C111 access PHYSICAL, required NONE, obtained OTHER
C112 access LOCAL, required NONE, obtained OTHER
C113 access ADJACENT NETWORK, required NONE, obtained OTHER
C114 access NETWORK, required NONE, obtained OTHER
C121 access PHYSICAL, required NONE, obtained USER
C122 access LOCAL, required NONE, obtained USER
C123 access ADJACENT NETWORK, required NONE, obtained USER
C124 access NETWORK, required NONE, obtained USER
C221 access PHYSICAL, required LOW, obtained OTHER/USER
C222 access LOCAL, required LOW, obtained OTHER/USER
C223 access ADJACENT NETWORK, required LOW, obtained OTHER/USER
C224 access NETWORK, required LOW, obtained OTHER/USER
C131 access PHYSICAL, required NONE, obtained ALL
C132 access LOCAL, required NONE, obtained ALL
C133 access ADJACENT NETWORK, required NONE, obtained ALL
C134 access NETWORK, required NONE, obtained ALL
C231 access PHYSICAL, required LOW, obtained ALL
C232 access LOCAL, required LOW, obtained ALL
C233 access ADJACENT NETWORK, required LOW, obtained ALL
C234 access NETWORK, required LOW, obtained ALL
C331 access PHYSICAL, required HIGH
C332 access LOCAL, required HIGH
C333 access ADJACENT NETWORK, required HIGH
C334 access NETWORK, required HIGH
For example, if we have a vulnerability, that has
access vector equal to NETWORK, privileges re-
quired – NONE and privileges obtained – OTHER,
then its category is C114.
2.4 CPE URIs
Common Platform Enumeration Uniform Resource
Identifiers is a structured naming scheme for hard-
ware and software:
cpe:< c p e v e r s i o n >:<p a r t >:<v e n d o r >:<p r o d u c t >:< v e r s i o n >:
<up d a t e >:< e d i t i o n >:<l a n g u a g e >:< s w e d i t i o n >:
<t a r g e t s w >:< t a r g e t h w >:<o t h e r >
Let us consider some fields of CPE URIs in detail.
The part field may have 1 of 3 values: a for applica-
tions, h for hardware, and o for operating systems.
Values of the vendor field are describing the orga-
nization that created the product. Possible values of
this field are defined in specification.
The name of the system/package/component is
stored in the product field, while the version field
defines its version. The update field is used for the
update or service pack information, while the edition
field further describes the build of the product, beyond
its version and update.
CVEs are connected with CPE URIs with the help
of logical expressions. For example, CVE-1999-0016
is connected with the following configuration:
ICISSP 2024 - 10th International Conference on Information Systems Security and Privacy
454

AND(OR( { c p e 2 3 U r i : cpe : 2 . 3 : o : c i s c o : i o s
: 7 0 0 0 :
*
:
*
:
*
:
*
:
*
:
*
:
*
, c p e n a m e : [ ] , v u l n e r a b l e :
t r u e } ) , OR( { c p e 2 3 U r i : cpe : 2 . 3 : a : gnu : i n e t
: 5 . 0 1 :
*
:
*
:
*
:
*
:
*
:
*
:
*
, cpe n a m e : [ ] , v u l n e r a b l e :
t r u e } , { c p e 2 3 U r i : cpe : 2 . 3 : a : m i c r o s o f t : w i n s o c k
: 2 . 0 :
*
:
*
:
*
:
*
:
*
:
*
:
*
, cpe n a m e : [ ] , v u l n e r a b l e :
t r u e } ) )
Thus, the following pairs of operating system and
application are required in the device configuration
for the exploitation of CVE-1999-0016:
cpe : 2 . 3 : o : c i s c o : i o s : 7 0 0 0 :
*
:
*
:
*
:
*
:
*
:
*
:
*
AND
cpe : 2 . 3 : a : gnu : i n e t : 5 . 0 1 :
*
:
*
:
*
:
*
:
*
:
*
:
*
cpe : 2 . 3 : o : c i s c o : i o s : 7 0 0 0 :
*
:
*
:
*
:
*
:
*
:
*
:
*
AND
cpe : 2 . 3 : a : m i c r o s o f t : w i n s o c k : 2 . 0 :
*
:
*
:
*
:
*
:
*
:
*
:
*
Thus, we can exploit the CVE-1999-0016 on the
analysed device, if its configuration contains either
first or second combination of elements.
2.5 Modifications of BERT
In the field of Natural Language Processing (NLP),
text classification is a crucial and challenging task.
It is solved by a wide variety of methods, includ-
ing Convolutional Neural Networks (CNN), Recur-
rent Neural Networks (RNN) and its modifications,
like Long Short-Term Memory networks (LSTM).
The use of BERT and its modifications in our
study is motivated by recent research that demon-
strates the effectiveness of transformers in short text
classification tasks (Karl and Scherp, 2022). Accord-
ing to the obtained results, for this task, transformers
outperform all the other methods tested. We consider
CPE URIs as short texts, because their length are from
29 to 177 symbols, with 54.65 symbols at average.
Let us consider BERT modifications in detail.
BERT is a transformer-based neural network ar-
chitecture designed for solving NLP tasks, such as
text classification, named entity recognition, language
understanding and others (Devlin et al., 2019). It uses
a stack of transformer encoder layers and is pre-
trained using tasks such as masked language mod-
elling (MLM) and next sentence prediction (NSP).
MLM focuses on predicting tokens that have been
intentionally masked within a given text. NSP is a
task aimed at predicting whether a particular sentence
serves as the immediate successor to another sentence
in the same text. By using these pretraining tasks,
BERT learns to use context to the left and to the right
of a token, thus making representations generated by
BERT very useful in a wide array of NLP tasks.
RoBERTa (Robustly Optimized BERT Pretrain-
ing Approach) is a set of modifications made to
BERT (Liu et al., 2019). The authors pretrained the
model with longer sequences and abandoned the NSP
pretraining task in favour of a modified BERT MLM.
In the original paper, masks were generated during the
data preprocessing and remained static during train-
ing. In RoBERTa, masks are randomly generated dur-
ing training, ensuring that the masking of sequences
varies each time.
XLM-RoBERTa is a multilingual RoBERTa
model trained on a dataset that includes 100 different
languages (Conneau et al., 2019). It uses RoBERTa
as its base model but undergoes training on a larger,
multilingual dataset.
DeBERTa (Decoding-enhanced BERT with Dis-
entangled Attention) is a modification of BERT: it
uses a disentangled attention mechanism, where each
token is represented using two vectors that encode its
content and an enhanced mask decoder, which incor-
porates information about absolute token position em-
beddings (He et al., 2021). DeBERTa-v3 is a modifi-
cation of DeBERTa, where MLM pretraining task is
substituted with replaced token detection (RTD).
3 RELATED WORK
In this section, we examine state-of-the-art in vulner-
abilities categorization and prediction, including pre-
diction of vulnerability categories and metrics.
In (Katsadouros and Patrikakis, 2022) a survey
on vulnerability prediction in the source code using
Graph Neural Networks (GNN) is presented. Au-
thors compared 11 state-of-the-art results in accor-
dance with GNNs architectures, graph representa-
tions, datasets, accuracy and F-measure. It is impor-
tant to note that almost all works used different cus-
tom datasets, thus it is difficult to compare the results.
For example, in the presented comparison, accuracy
differentiate from 58.90 % to 97.40 % and F-measure
– from 36.00 % to 96.11 %. The main conclusion is
as follows: there is a lack of real-world datasets, thus
it is very important to construct a large database with
real-world vulnerable source code samples.
The second version of the stakeholder-specific
vulnerability categorization (SSVC) for prioritizing
vulnerability response is presented in (Spring et al.,
2021). In the presented framework, authors determine
output and input of vulnerability management, in-
cluding incorporated context, as well as describe what
roles are required and what responsibilities are con-
nected with them. In this work, the decision-making
process is based on decision trees. Those trees rep-
resent important elements of a decision, possible de-
cision values, and possible outcomes. SSVC is posi-
tioned as an alternative to CVSS.
In (Eberendu et al., 2022) a systematic literature
review of software vulnerabilities detection is pre-
sented. Authors analysed 55 studies published from
Exploring BERT for Predicting Vulnerability Categories in Device Configurations
455

2015 to 2021. Authors grouped those studies into 7
categories, namely, neural network, machine learn-
ing, static and dynamic analysis, code clone, classi-
fication, models and frameworks, as well as other for
studies that can’t be included into those categories.
The findings indicate that machine learning strategies
are commonly employed by researchers to detect soft-
ware vulnerabilities, as they allow for easy review of
large volumes of data. Despite the development of
numerous systems for detecting software vulnerabil-
ities, none have been able to accurately identify the
specific type of vulnerability detected.
The authors have developed an automatic vulner-
ability classification model in (Huang et al., 2019).
It combines term frequency-inverse document fre-
quency (TF-IDF), information gain (IG), and deep
neural network (DNN). TF-IDF is utilized to deter-
mine the frequency and importance of each word in a
vulnerability description, while IG is used for feature
selection. The DNN is then employed to create an au-
tomatic vulnerability classifier. The proposed model’s
effectiveness was validated using NVD. In compar-
ison with Support Vector Machine (SVM), Naive
Bayes (NB), and K Nearest Neighbour (KNN), the
authors’ model demonstrates superior performance
in terms of accuracy (87%), precision (85%), recall
(82%), and F-measure (81%).
In (Shen and Chen, 2020) a survey of automatic
software vulnerability detection and prediction is pre-
sented. In this work, the authors divided deep learning
technologies into approaches for automatic vulnera-
bility detection, program patching and defect predic-
tion. As the main future challenges, the authors se-
lected feature generation and parameters, model se-
lection and evaluation, as well as real-world datasets.
The study (Yosifova et al., 2021) focuses on evalu-
ating the performance of Linear SVM, NB, and Ran-
dom Forest (RF) in the task of classifying vulnera-
bility types. The authors utilized precision, recall,
and F-measure metrics to assess the effectiveness of
those machine learning methods. Instead of predict-
ing platform, vendor, product, scoring, or exploita-
tion, the authors aimed to automatically classify the
vulnerability type, namely, None, Denial of Service,
Execute Code, Overflow, Cross-Site Scripting, Direc-
tory Traversal, Bypass Something, Gain Information,
Gain Privilege, SQL Injection, File Inclusion, Mem-
ory Corruption, Cross-Site Request Forgery, HTTP
Response Splitting. The authors achieved a 58 % av-
erage accuracy for Multinomial NB, 70 % for Linear
SVM and 59 % for RF with None category, and 57 %
/ 68 % / 63 % without it.
A systematic mapping study on software vulnera-
bility prediction is presented in (Kalouptsoglou et al.,
2023). Authors analysed 180 studies, their findings
are as follows: (1) there are two main areas of focus in
vulnerability research: predicting vulnerable software
components and forecasting the future of vulnerabili-
ties in software; (2) the majority of studies in vulner-
ability research create their own dataset by gathering
information from vulnerability databases that contain
data on real-world software; (3) there is an increasing
interest in deep learning models and a shift towards
textual source code representation.
In (Croft et al., 2022) a systematic literature re-
view on data preparation for software vulnerability
prediction is presented. The authors reviewed 61
studies and developed a taxonomy of data prepara-
tion for this task. The data preparation was divided
into requirements formation (programming language,
vulnerability types, granularity, and context), collec-
tion (real-world, synthetic or mixed code), labelling
(provided, generated or pattern-based) and cleaning
(irrelevant code, noise, duplication).
The analysis of related work reveals that vulnera-
bilities’ prediction using various types of input data is
currently progressing rapidly, yet there is lack of ade-
quate solutions. Also, it demonstrated that prediction
of vulnerability categories based on configurations of
devices is just starting to be researched, highlighting
its scientific significance and novelty.
4 PIPELINE
The pipeline we used to explore BERT modifications
consists of 5 steps, from data preparation to results
evaluation. Let us consider each step in more detail.
Step 1. Extraction of Data for the Local Database.
During this step, we obtain CVEs data in JSON for-
mat from the NVD data feeds. Those feeds consist of
files containing information about each vulnerability.
The feeds are divided into three parts:
• feeds with CVEs added each year;
• feeds with CVEs added in the last 8 days;
• feeds with CVEs modified in the last 8 days.
Once all the archives are downloaded and ex-
tracted, a database is prepared to store the CVEs. Af-
ter setting up the database schema, feeds are parsed,
and extracted data is inserted into the local database.
If necessary, existing data is updated. Once all files
are processed, a script is added to keep the local
database updated.
Step 2. Preparation of Datasets. Within the
database, developed in the previous step, NVD data
is organized into various tables. Thus, we use differ-
ICISSP 2024 - 10th International Conference on Information Systems Security and Privacy
456

ent SQL queries to extract vulnerable configurations
associated with CVEs.
During the preparation of datasets, each CPE URI
is preprocessed and connected with the values of three
CVSS metrics – access vector, privileges required
and privileges obtained. In our experiments, prepro-
cessing is based on the replacement of the “:” symbol
with space and deletion of “cpe:2.3:” and “*” parts:
cpe : 2 . 3 : a : gnu : g l i b c : 2 . 3 8 :
*
:
*
:
*
:
*
:
*
:
*
:
*
−>
a gnu g l i b c 2 . 3 8
As the output of the step, there are 3 datasets – one
for each metric. Each dataset is formed for the multi-
label task solving. We use multi-label, because CPE
URIs can be connected with multiple CVEs, while
those CVEs can have different values of CVSS met-
rics. Additionally, we remove duplicates of examples
from the datasets.
Step 3. Models Performance Evaluation. During
this step, we use fine-tuning on data for the predic-
tion of access vector, privileges required and privi-
leges obtained individually.
Because of the multi-label classification task, we
decided to add a linear layer on top of each model
and input the CLS token from the last encoder layer.
Please, note that during this step, we are training all
layers of the models.
Before feeding the text, we tokenize it using pre-
trained tokenizers and apply padding to a length of
192. During the experiments, we were using the linear
scheduler with warm up from the transformers Python
library (Wolf et al., 2020).
To find the best solution, we were using Binary
Cross Entropy loss function and AdamW optimizer
from PyTorch library with the following parameters:
weight decay equal to 0.01; learning rate equal to 1e-
5; and a batch size of 32 for 5 epochs.
After that, each model is trained for each task mul-
tiple times, and mean values with standard deviation
of performance metrics, namely, accuracy, precision,
recall and F-measure, are used to compare them.
The output of this step contains best models for
access vector, privileges required and privileges ob-
tained prediction.
Step 4. Optimization of Models’ Hyperparame-
ters. Based on the previous step results, we receive a
list of models for further improvement. The goal of
this step is to select the best hyperparameters of mod-
els for each task, while avoiding overfitting.
It is important, because the best models and their
hyperparameters can vary for the prediction of access
vector, privileges required and privileges obtained.
Moreover, performance of optimized models can have
a significant impact on the quality of the prediction of
vulnerabilities based on configurations of devices.
During this step, we are performing hyperparam-
eters optimization using the Optuna framework (Ak-
iba et al., 2019). We were using HyperbandPruner
and TPESampler with the number of trials equal to
150. We were training each model for 4 epochs with
a batch size equal to 128.
After all trials, we are comparing results to se-
lect the best solution for each task. The output of
this step contains trained models for the prediction of
access vector, privileges required and privileges ob-
tained (3 optimized models in total).
Step 5. Evaluation of Vulnerabilities Prediction.
During this step, we combine predictions of models,
that were selected as the best in prediction of access
vector, privileges required and privileges obtained.
We combine their predictions in accordance with
thresholds into the list of vulnerability categories.
Those thresholds are defining the minimal probabil-
ity of the CVSS metric prediction, so its value can
be taken into account. For example, if the output for
privileges required is as follows:
[ 0 . 9 2 : NONE, 0 . 8 2 : USER, 0 . 0 1 : ADMIN]
and the threshold value is equal to 0.80, then we are
using NONE and USER during the list of vulnerabil-
ity categories formation.
Please, note that this list represents all possible
combinations of access vector, privileges required
and privileges obtained values. After that, we check
the prediction quality of vulnerability categories and
divide all results into: True – correct predictions; Par-
tially – not correct, but useful predictions; False – not
correct and not useful predictions.
In the following section, we are providing a de-
tailed description of the datasets used and present the
key results obtained during the experiments.
5 EVALUATION
In this section, we describe the dataset used in Sec-
tion 5.1. Our experimental setup and received results
are presented in Section 5.2.
5.1 Datasets
As was mentioned before, we were using 3 different
datasets to train our models. Let us consider each
dataset in more detail.
The first dataset was extracted for the prediction of
the access vector metric of vulnerabilities. It contains
the following examples:
cp e , av nw , av an , a v l c , av p h
a r e d h a t j b o s s e n t e r p r i s e w e b p l a t f o r m 5 . 2 . 0 , 1 , 0 , 1 , 0
a r e d h a t j b o s s e n t e r p r i s e w e b s e r v e r 2 . 0 . 1 , 1 , 0 , 0 , 0
Exploring BERT for Predicting Vulnerability Categories in Device Configurations
457

where av nw – NETWORK access vector; av an
– ADJACENT NETWORK; av lc – LOCAL; and
av ph – PHYSICAL.
The second dataset was extracted for the predic-
tion of the privileges required metric. It contains the
following examples:
cp e , pr no n e , p r u s e r , pr a d m i n
a r e d h a t j b o s s e n t e r p r i s e w e b p l a t f o r m 5 . 2 . 0 , 1 , 0 , 0
a r e d h a t j b o s s e n t e r p r i s e w e b s e r v e r 2 . 0 . 1 , 1 , 0 , 0
where pr none – NONE privileges required; pr user
– USER; and pr admin – ADMIN.
The third dataset was extracted for the prediction
of the privileges obtained metric of vulnerabilities. It
contains the following examples:
cp e , p o o t h e r , p o u s e r , p o a l l
a r e d h a t j b o s s e n t e r p r i s e w e b p l a t f o r m 5 . 2 . 0 , 1 , 0 , 0
a r e d h a t j b o s s e n t e r p r i s e w e b s e r v e r 2 . 0 . 1 , 1 , 0 , 0
where po other – OTHER privileges obtained;
po user – USER; and po all – ALL.
All three datasets contain the cpe field as a feature,
while values of access vector, privileges required and
privileges obtained are binary labels. Additional in-
formation about those datasets is presented in Table 3.
Table 3: Datasets description.
Values
Examples Multilabel
True False
Access vector
av nw 217 126 29 199
246 325 33 554
av an 13 330 232 995
av lc 54 364 191 961
av ph 2 684 243 641
Privileges required
pr none 77 817 25 263
103 080 26 408pr user 43 924 59 156
pr admin 15 164 87 916
Privileges obtained
po other 229 155 9 248
238 403 16 512po user 9 837 228 566
po all 19 542 218 861
All numbers presented in Table 3 were calculated
after we removed duplicates of examples. Please, note
a significant data imbalance among values of metrics.
Such data imbalance in values of CVSS metrics
is natural for CVEs, thus we decided to keep those
datasets as they are during the experiments.
In each dataset, we used 85% of data for training
and 15% for testing. Note that there were no overlap
between train and test data to ensure that predictions
for unknown data are adequately evaluated.
5.2 Results
For all datasets, we tested performance of BERT mod-
ifications in prediction of access vector, privileges re-
quired and privileges obtained based on CPE URIs.
Please, note that we used base versions of BERT mod-
ifications during the experiments, their parameters are
presented in Table 4.
Table 4: Parameters of BERT modifications.
Transformer layers Hidden dimension
Parameters,
in millions
BERT 12 768 110
RoBERTa 12 768 125
XLM-RoBERTa 12 768 125
DeBERTaV3 12 768 184
Each model was tested for 10 times on each
dataset. The mean results of accuracy with standard
deviation were collected for each model during the
experiments, see Table 5.
Table 5: Comparison of BERT modifications.
Privileges required Privileges obtained Access vector
BERT 0.7549 ± 0.0029 0.9462 ± 0.0017 0.8990 ± 0.0016
RoBERTa 0.7487 ± 0.0010 0.9432 ± 0.0025 0.8895 ± 0.0038
XLM-RoBERTa 0.6883 ± 0.0530 0.9319 ± 0.0060 0.8733 ± 0.0019
DeBERTa-v3 0.7501 ± 0.0037 0.9432 ± 0.0013 0.8579 ± 0.0620
According to our experiments, BERT outperforms
other modifications in each task. Additionally, we
tested the time required for each model to process one
batch of data with size equal to 32 and received the
following results: BERT – 78 ms, RoBERTa – 74 ms,
XLM-RoBERTa – 74 ms, and DeBERTa-v3 – 102 ms.
Thus, we decided to optimize hyperparameters of
BERT models. For the optimization, we used an Op-
tuna framework. It implements state-of-the-art algo-
rithms that can search large hyperparameter spaces.
The values of hyperparameters that we used during
BERT optimization are presented in Table 6.
Table 6: Hyperparameters for optimization.
Range of values
Learning rate from 9e-5 to 1e-5 with 1e-5 step, plus 9e-4 and 8e-4
Warm up epochs from 0.00 to 1.50 with 0.10 step
Weight decay from 0.00 to 0.05 with 0.01 step
The results obtained for optimized BERT are pre-
sented in Table 7.
Table 7: Results of BERT optimization.
Accuracy Precision Recall F-measure Support
Access
vector
av nw
0.9068
0.97 0.98 0.98 32597
av an 0.84 0.89 0.86 2013
av lc 0.86 0.84 0.85 8197
av ph 0.77 0.61 0.68 386
Privileges
required
po none
0.7724
0.91 0.95 0.93 11685
po user 0.85 0.82 0.83 6585
po admin 0.78 0.65 0.71 2342
Privileges
obtained
po other
0.9472
0.99 0.99 0.99 34412
po user 0.76 0.74 0.75 1477
po all 0.83 0.77 0.80 2920
Such results were achieved using the following
values of hyperparameters:
• privileges required: learning rate 6e-05,
warmup steps 0.3, weight decay 0.04;
ICISSP 2024 - 10th International Conference on Information Systems Security and Privacy
458

• privileges obtained: learning rate 7e-05,
warmup steps 0.0, weight decay 0.05;
• access vector: learning rate 7e-05, warmup steps
0.5, weight decay 0.01.
After that, we used optimized models to predict
values of access vector, privileges required and priv-
ileges obtained and combined them into the list of
CVE categories, see Figure 1.
a gitlab gitlab 14.10.0 community
CPE URI
BERT
av
BERT
pr
BERT
po
Predicts access vector
Predicts required privileges
Predicts obtained privileges
av_nw
av_an
av_lc
av_ph
0.9997
0.0007
0.0001
0.0006
po_other
po_user
po_all
0.9998
0.0002
0.0001
pr_none
pr_user
pr_admin
0.8866
0.9871
0.9378
Prediction of
CVE categories
C114
CVE categories
C224 C334
cat_thr = 0.80
max_thr = 0.02
Figure 1: Example of CVE categories prediction.
This prediction is based on two thresholds:
• cat thr defines the minimum probability value
that we consider for CVSS metric prediction;
• max thr defines the acceptable range of values
near the maximum prediction probability, in case
when none values are higher than cat thr.
For example, if prediction for privileges required
is [0.95, 0.89, 0.01], while cat thr is equal to 0.80,
then 0.95 and 0.89 are satisfying the requirement.
And if prediction for privileges obtained is [0.73,
0.78, 0.12], while cat thr is equal to 0.80 and max thr
is equal to 0.05, then all values in range 0.78 ± 0.05
are satisfying the requirement.
It is important to note that we tested different val-
ues of cat thr and max thr to find out the most rational
combination of their values. To be precise, we tested
the following ranges of values:
• cat thr in range [0.65; 0.99] with 0.01 step;
• max thr in range [0.00; 0.10] with 0.01 step.
After that, we sorted all results according to the
maximization of correct and useful predictions and
minimization of false predictions. Obtained top 10
results are presented in Table 8.
We decided to select cat thr equal to 0.80 and
max thr equal to 0.02 as the most promising values
of thresholds. Thus, obtained results are as follows:
73.82 % accuracy with 84.67 % of useful predictions.
To give an explanation of useful predictions, let
us consider an example. If the correct prediction for
CPE URI is C114 C224 C334 and our solution pre-
dicted that categories, then the prediction is correct
and increases the accuracy result.
Table 8: Top 10 results in CVE categories prediction.
Predictions
Accuracy Useful
cat thr max thr true partially false
0.81 0.01 70127 10564 14349 0.7379 0.8490
0.81 0.02 70109 10529 14402 0.7377 0.8485
0.80 0.01 70179 10347 14514 0.7384 0.8473
0.80 0.02 70159 10315 14566 0.7382 0.8467
0.80 0.03 70138 10290 14612 0.7380 0.8463
0.80 0.04 70112 10264 14664 0.7377 0.8457
0.79 0.01 70197 10143 14700 0.7386 0.8453
0.79 0.02 70175 10113 14752 0.7384 0.8448
0.79 0.03 70156 10088 14796 0.7382 0.8443
0.79 0.04 70129 10065 14846 0.7379 0.8438
Predictions, that contain any combination of
C114, C224 and C334 are considered as useful and
increasing corresponding metric. Any other predic-
tions, for example, C114 C224 C334 C131, are con-
sidered as incorrect.
6 DISCUSSION
One of the main problems we encountered is a sig-
nificant data imbalance and a large skew towards cer-
tain classes. During the testing phases, we tried using
naive oversampling and weight adjustment in the loss
function, but it did not lead to any significant results.
Moreover, according to the loss function graphs,
we can conclude that all models start overfitting pretty
quickly, see Figure 2. That is why during our exper-
iments we decided to use BERT modifications that
were trained for 4 epochs only.
To address the issue of imbalanced data, we plan
to extend our datasets using the approach we pre-
sented during the 7-th International Scientific Confer-
ence Intelligent Information Technologies for Indus-
try (Levshun, 2023b). The main idea of the approach
is in transformation of CVSS v2 and CVSS v3 metrics
into each other for CVEs, where only one version of
CVSS metrics is available. We assume, that it would
allow us to use 189 022 of CVEs instead of 100 581,
thus it is possible that categories with low number of
examples will be extended with additional ones.
Also, during the experiments we used only 1:1
CPE URI to CVE connections, which are true for
more than 90% of such connections in NVD. We plan
to investigate the other 10%, where CPE URIs are
connected to CVEs as N:1 and see if it is possible to
transform them into multiple 1:1 connections.
Exploring BERT for Predicting Vulnerability Categories in Device Configurations
459
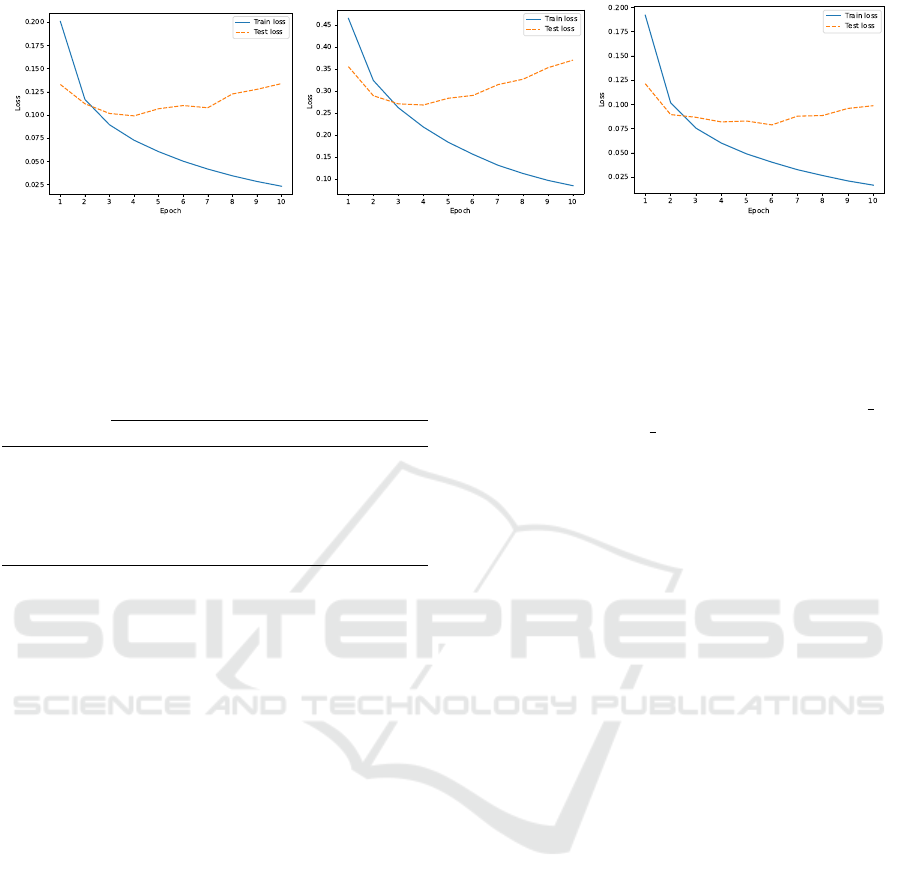
Figure 2: Loss function graphs for (left) access vector, (middle) privileges required and (right) privileges obtained.
As for the comparison with results of other re-
searchers, to the best of our knowledge, there is only
our previous work (Levshun, 2023a), that can be com-
pared directly, see Table 9.
Table 9: Comparison of approaches.
Previous Current
Approach
Direct prediction
of CVE categories
Prediction of CVSS metrics
and their combination
into CVE categories
Classification Multi-class Multi-label
Models Random Forest BERT
Accuracy 0.6450 0.7382
Additionally, it might be possible to compare the
results, received for prediction of access vector, priv-
ileges required and privileges obtained based on CPE
URIs, with the results of the same CVSS metrics pre-
diction, but based on CVE descriptions.
Unfortunately, CVE descriptions are not suitable
for the task at hand, as we are making an attempt
to predict unknown vulnerabilities and, thus, cannot
know their descriptions as input data.
7 CONCLUSION
We explored performance of such transformer-based
model architectures as BERT, RoBERTa, XLM-
RoBERTa and DeBERTa-v3 in vulnerability metrics
prediction. After that, we used results of the best
models to predict categories of vulnerabilities based
on device configurations. Each device configuration
was represented as a list of CPE URIs, while vulnera-
bilities were divided into 24 categories in accordance
with their CVSS metrics – access vector, privileges
required and privileges obtained.
In CVSS metrics prediction, BERT showed
slightly better performance for all tasks. After the op-
timization of hyperparameters, we achieved the fol-
lowing accuracy:
• access vector – 0.8990 ± 0.0016.
• privileges required – 0.7549 ± 0.0029;
• privileges obtained – 0.9462 ± 0.0017;
Based on CVSS metrics predictions, we evaluated
performance of the combination of BERT models in
prediction of vulnerability categories. At best, we
achieved 73.82 % accuracy with 84.67 % of useful
predictions. Such results were achieved with cat thr
equal to 0.80 and max thr equal to 0.02.
During the experiments, we faced multiple chal-
lenges associated with imbalanced datasets. We see
our next steps as the implementation of the new ex-
periments on the extended datasets, so we can im-
prove the results, presented in this study. We hope to
achieve important findings that would allow us to re-
fine our methods for vulnerabilities prediction. Addi-
tionally, we want to try other modifications of BERT
in solving NLP task, introduced in this work.
ACKNOWLEDGEMENTS
The study was supported by the grant of the Russian
Science Foundation No. 22-71-00107, https://rscf.ru/
en/project/22-71-00107/.
REFERENCES
Akiba, T., Sano, S., Yanase, T., Ohta, T., and Koyama,
M. (2019). Optuna: A next-generation hyperparam-
eter optimization framework. Proceedings of the 25th
ACM SIGKDD International Conference on Knowl-
edge Discovery & Data Mining.
Cheikes, B. A., Cheikes, B. A., Kent, K. A., and Waltermire,
D. (2011). Common platform enumeration: Naming
specification version 2.3. US Department of Com-
merce, National Institute of Standards and Technol-
ogy.
Christey, S., Kenderdine, J., Mazella, J., and Miles, B.
(2013). Common weakness enumeration. Mitre Cor-
poration.
Conneau, A., Khandelwal, K., Goyal, N., Chaudhary, V.,
Wenzek, G., Guzm
´
an, F., Grave, E., Ott, M., Zettle-
moyer, L., and Stoyanov, V. (2019). Unsupervised
ICISSP 2024 - 10th International Conference on Information Systems Security and Privacy
460

cross-lingual representation learning at scale. In An-
nual Meeting of the Association for Computational
Linguistics.
Croft, R., Xie, Y., and Babar, M. A. (2022). Data prepara-
tion for software vulnerability prediction: A system-
atic literature review. IEEE Transactions on Software
Engineering, 49(3):1044–1063.
Devlin, J., Chang, M.-W., Lee, K., and Toutanova, K.
(2019). Bert: Pre-training of deep bidirectional trans-
formers for language understanding. In North Amer-
ican Chapter of the Association for Computational
Linguistics.
Eberendu, A. C., Udegbe, V. I., Ezennorom, E. O., Ibegbu-
lam, A. C., Chinebu, T. I., et al. (2022). A systematic
literature review of software vulnerability detection.
European Journal of Computer Science and Informa-
tion Technology, 10(1):23–37.
Ferrara, P., Mandal, A. K., Cortesi, A., and Spoto, F. (2021).
Static analysis for discovering iot vulnerabilities. In-
ternational Journal on Software Tools for Technology
Transfer, 23:71–88.
He, P., Gao, J., and Chen, W. (2021). Debertav3: Improving
deberta using electra-style pre-training with gradient-
disentangled embedding sharing. arXiv preprint
arXiv:2111.09543.
Huang, G., Li, Y., Wang, Q., Ren, J., Cheng, Y., and
Zhao, X. (2019). Automatic classification method for
software vulnerability based on deep neural network.
IEEE Access, 7:28291–28298.
Kalouptsoglou, I., Siavvas, M., Ampatzoglou, A., Keha-
gias, D., and Chatzigeorgiou, A. (2023). Software
vulnerability prediction: A systematic mapping study.
Information and Software Technology, page 107303.
Karl, F. and Scherp, A. (2022). Transformers are short text
classifiers: A study of inductive short text classifiers
on benchmarks and real-world datasets. arXiv preprint
arXiv:2211.16878.
Katsadouros, E. and Patrikakis, C. (2022). A survey on
vulnerability prediction using GNNs. In Proceedings
of the 26th Pan-Hellenic Conference on Informatics,
pages 38–43.
Lallie, H. S., Debattista, K., and Bal, J. (2020). A review
of attack graph and attack tree visual syntax in cyber
security. Computer Science Review, 35:100219.
Levshun, D. (2023a). Comparative analysis of machine
learning methods in vulnerability categories predic-
tion based on configuration similarity. In International
Symposium on Intelligent and Distributed Computing,
pages 231–242. Springer.
Levshun, D. (2023b). Comparative analysis of machine
learning methods in vulnerability metrics transforma-
tion. In International Conference on Intelligent In-
formation Technologies for Industry, pages 60–70.
Springer.
Levshun, D. and Chechulin, A. (2023). Vulnerability cat-
egorization for fast multistep attack modelling. In
2023 33rd Conference of Open Innovations Associa-
tion (FRUCT), pages 169–175. IEEE.
Levshun, D., Kotenko, I., and Chechulin, A. (2021). The
application of the methodology for secure cyber–
physical systems design to improve the semi-natural
model of the railway infrastructure. Microprocessors
and Microsystems, 87:103482.
Levshun, D. S., Gaifulina, D. A., Chechulin, A. A., and
Kotenko, I. V. (2020). Problematic issues of informa-
tion security of cyber-physical systems. Informatics
and automation, 19(5):1050–1088.
Li, Y., Huang, G.-q., Wang, C.-z., and Li, Y.-c. (2019).
Analysis framework of network security situational
awareness and comparison of implementation meth-
ods. EURASIP Journal on Wireless Communications
and Networking, 2019(1):1–32.
Liu, X. (2020). A network attack path prediction method
using attack graph. Journal of Ambient Intelligence
and Humanized Computing, pages 1–8.
Liu, Y., Ott, M., Goyal, N., Du, J., Joshi, M., Chen, D.,
Levy, O., Lewis, M., Zettlemoyer, L., and Stoyanov,
V. (2019). Roberta: A robustly optimized bert pre-
training approach. arXiv preprint arXiv:1907.11692.
Mell, P., Scarfone, K., and Romanosky, S. (2006). Com-
mon vulnerability scoring system. IEEE Security &
Privacy, 4(6):85–89.
Shen, Z. and Chen, S. (2020). A survey of automatic soft-
ware vulnerability detection, program repair, and de-
fect prediction techniques. Security and Communica-
tion Networks, 2020:1–16.
Spring, J. M., Householder, A., Hatleback, E., Manion,
A., Oliver, M., Sarvapalli, V., Tyzenhaus, L., and
Yarbrough, C. (2021). Prioritizing vulnerability re-
sponse: A stakeholder-specific vulnerability catego-
rization (version 2.0). Technical report, Technical Re-
port. CARNEGIE-MELLON UNIV PITTSBURGH
PA.
Vulnerabilities, C. (2005). Common vulnerabilities and ex-
posures. Published CVE Records.[Online] Available:
https://www. cve. org/About/Metrics.
Wolf, T., Debut, L., Sanh, V., Chaumond, J., Delangue,
C., Moi, A., Cistac, P., Rault, T., Louf, R., Funtow-
icz, M., Davison, J., Shleifer, S., von Platen, P., Ma,
C., Jernite, Y., Plu, J., Xu, C., Scao, T. L., Gugger,
S., Drame, M., Lhoest, Q., and Rush, A. M. (2020).
Transformers: State-of-the-art natural language pro-
cessing. In Proceedings of the 2020 Conference on
Empirical Methods in Natural Language Processing:
System Demonstrations, pages 38–45, Online. Asso-
ciation for Computational Linguistics.
Yosifova, V., Tasheva, A., and Trifonov, R. (2021). Pre-
dicting vulnerability type in common vulnerabilities
and exposures (CVE) database with machine learning
classifiers. In 2021 12th National Conference with In-
ternational Participation (ELECTRONICA), pages 1–
6. IEEE.
Zhang, S., Caragea, D., and Ou, X. (2011). An empirical
study on using the national vulnerability database to
predict software vulnerabilities. In Database and Ex-
pert Systems Applications: 22nd International Con-
ference, DEXA 2011, Toulouse, France, August 29-
September 2, 2011. Proceedings, Part I 22, pages
217–231. Springer.
Exploring BERT for Predicting Vulnerability Categories in Device Configurations
461
