
Answering the Call to Go Beyond Accuracy: An Online Tool for the
Multidimensional Assessment of Decision Support Systems
Chiara Natali
1
, Andrea Campagner
2
and Federico Cabitza
1,2
1
Department of Computer Science, Systems and Communication, University of Milano-Bicocca, Milan, Italy
2
IRCCS Ospedale Galeazzi - Sant’Ambrogio, Milan, Italy
Keywords:
Medical Machine Learning, Decision Support Systems, Validation, Assessment.
Abstract:
The research about, and use of, AI-based Decision Support Systems (DSS) has been steadily increasing in the
recent years: however, tools and techniques to validate and evaluate these systems in an holistic manner are
still largely lacking, especially in regard to their potential impact on actual human decision-making. This paper
challenges the accuracy-centric paradigm in DSS evaluation by introducing the nuanced, multi-dimensional
approach of the DSS Quality Assessment Tool. Developed at MUDI Lab (University of Milano-Bicocca), this
free, open-source tool supports the quality assessment of AI-based decision support systems (DSS) along six
different and complementary dimensions: model robustness, data similarity, calibration, utility, data reliability
and impact on human decision making. Each dimension is analyzed for its relevance in the Medical AI domain,
the metrics employed, and their visualizations, designed according to the principle of vague visualizations to
promote cognitive engagement. Such a tool can be instrumental to foster a culture of continuous oversight,
outcome monitoring, and reflective technology assessment.
1 INTRODUCTION
The recent surge in the adoption of artificial intelli-
gence (AI) systems for decision support across var-
ious sectors is rapidly transforming the landscape
of decision-making processes. Especially notable is
their application in areas with legal and moral im-
plications, such as medicine, law, and public safety,
where stakes are very high. In such settings, accu-
racy, and its maximization, has been the beacon and
the rationale that guides the development and drives
the validation and acceptance of these systems. This
perspective has also driven the emergence of a narra-
tive oriented toward the lofty aim of AI achieving “su-
perhuman” accuracy, with automated decisions being
seen as indispensable due to their purported superior-
ity in accuracy and consistency over human counter-
parts (Kahneman et al., 2021).
Yet, a scenario of full automation, where decisions
are solely carried out by machines, is more an ex-
ception than the rule in real-world applications (Kat-
sikopoulos et al., 2020; Araujo et al., 2020), and in-
deed this latter perspective has its detractors. In their
extensive textual analysis of the values considered in
100 highly-cited machine learning papers published
at premier machine learning conferences, (Birhane
et al., 2022) discovered an overwhelming focus on
performance in 96% of papers analyzed. This tunnel
vision towards accuracy leaves little room for discus-
sions on potential negative implications, which mer-
ited mention in a mere 2% of papers.
Our paper emphasizes a critical realization: while
accuracy remains undeniably vital, it is but one facet
in the multi-dimensional assessment of quality of De-
cision Support Systems (DSS). When assessed in iso-
lation, accuracy can give a myopic view of a system’s
value, overshadowing the intricate socio-technical
systems (Trist et al., 1978) within which it operates.
Moreover, exclusive reliance on accuracy neglects the
emerging dynamics that arise from continuous inter-
actions among humans, machines, and tasks (Carroll
and Rosson, 1992; Cabitza et al., 2014).
Academic circles have started to resonate with the
broader perspective of beyond accuracy evaluations.
A cursory query for the term “Beyond Accuracy” on
Scopus revealed a blossoming literature in the Com-
puter Science and Engineering domain, with 42 works
mentioning this expression in their title (as of Oct.
26th, 2023
1
). This signals an increasing awareness
1
found via the query TITLE ( “beyond accuracy” ) AND
( LIMIT-TO ( SUBJAREA , “COMP” ) OR LIMIT-TO (
Natali, C., Campagner, A. and Cabitza, F.
Answering the Call to Go Beyond Accuracy: An Online Tool for the Multidimensional Assessment of Decision Support Systems.
DOI: 10.5220/0012471600003657
Paper published under CC license (CC BY-NC-ND 4.0)
In Proceedings of the 17th International Joint Conference on Biomedical Engineering Systems and Technologies (BIOSTEC 2024) - Volume 2, pages 219-229
ISBN: 978-989-758-688-0; ISSN: 2184-4305
Proceedings Copyright © 2024 by SCITEPRESS – Science and Technology Publications, Lda.
219

of the need for more holistic and multi-dimensional
DSS evaluations, pointing towards the imperative of
exploring other critical attributes like data reliability,
model robustness, calibration, and utility, and the ex-
tent human rely on these systems.
In particular, we highlight three pivotal concerns
in the realm of Medical AI where an accuracy-centric
evaluation may fall short: namely, the challenges of
Replicability, Data reliability, and Validity.
The issue of replicability, that is performance gen-
eralizability, highlights that the accuracy achieved on
training data often does not translate into similar per-
formance in the real world or other settings (differ-
ent from those that gave the training data), therefore
pointing to the need for rigorous external validation
on different real-world datasets (Cabitza et al., 2021;
Steyerberg and Harrell, 2016). As for data reliabil-
ity, accuracy is highly dependent on the quality of
training data and human labels, which are often noisy,
biased, or unreliable, unless sufficiently experienced
(and sufficiently many) evaluators are involved in the
production of reference labels (Cabitza et al., 2020a).
Finally, the validity question teaches us that accuracy
alone does not capture real clinical utility and impact
on clinical outcomes.
Recognizing these challenges, and to bridge the
gap between theory and practice, we introduce
an open-source, multi-dimensional assessment tool
available at: https://dss-quality-assessment.vercel.
app or, if national restrictions apply, at https://
mudilab.github.io/dss-quality-assessment/. This tool
embarks on a six-step exploration of various, of-
ten overlooked, dimensions integral to evaluating the
quality of decision support systems. While each step
operates independently, their combined usage offers
a holistic assessment of a DSS’s quality, resulting in
a comprehensive, multidimensional evaluation tool.
These include:
1. Robustness: Evaluating the DSS’s performance
with naturally diverse data, which might differ
from those used in its training (especially if com-
ing from other real-world settings).
2. Data Similarity: Assessing the extent the train-
ing data and test data are similar (or come from
the same distribution).
3. Calibration: Assessing whether the model is ca-
pable of correctly estimating probabilities, and
hence its recommendations support evidence-
based and probabilistic reasoning.
4. Utility: Evaluating whether the DSS provides
valuable, practical benefit that would reduce de-
cisional costs and improve outcomes.
SUBJAREA , “ENGI” ) )
5. Data Reliability: Assessing the level of inter-
rater agreement on the ground truth and hence its
reliability.
6. Human Interaction: Understanding the DSS’s
influence on human decision-making processes
and related cognitive biases.
Coupled with adherence to best practice guidelines
(such as those reported in (Cabitza and Campagner,
2021)), this tool aims to promote a beyond-accuracy
culture in the assessment of medical AI, fostering a
more holistic and nuanced approach.
In the following sections, each dimension will be
explored in terms of its relevance for the Medical AI
domain, the deployed metrics and their respective vi-
sualizations, designed according to the principle of
vague visualizations, which “render uncertainty with-
out converting it in any numerical or symbolic form”
(Assale et al., 2020). By making the interpretation
of the output less immediate, such visualizations aim
at promoting the cognitive activation of users, in line
with the concept of frictional DSS presented in (Na-
tali, 2023).
More in detail, the structure of our paper is as fol-
lows: having provided an overview over the associ-
ated challenges discussed in this introduction, Sec-
tions 2–7 will follow the multi-step journey of system
assessment, elaborating on the characteristics of ro-
bustness, similarity, calibration, utility, reliability and
human interaction. The final section discusses the
role of this tool for the “beyond accuracy” discourse
and the promotion of a culture of “technovigilance”
(Cabitza and Zeitoun, 2019).
2 ROBUSTNESS
Traditionally, DSSs based on contemporary AI meth-
ods, such as Machine Learning, undergo evaluation
in isolation, focusing solely on their performance on
a specific dataset. This can lead to misleading results
if the evaluation dataset (also called test set) does not
mirror the real-world case mix or is too similar to the
training set.
Robustness assessment must give elements to as-
sess the capability of the DSS of maintaining ade-
quate performance when applied to naturally diverse
data, that is the full spectrum of data that could be
met in real world settings, even settings that are dif-
ferent (in terms of equipment, patients or data work)
with respect to the setting where the training data had
been collected. By considering both performance and
data similarity, the system’s robustness is evaluated in
a holistic manner, paving the way for safer and more
reliable real-world deployments.
HEALTHINF 2024 - 17th International Conference on Health Informatics
220
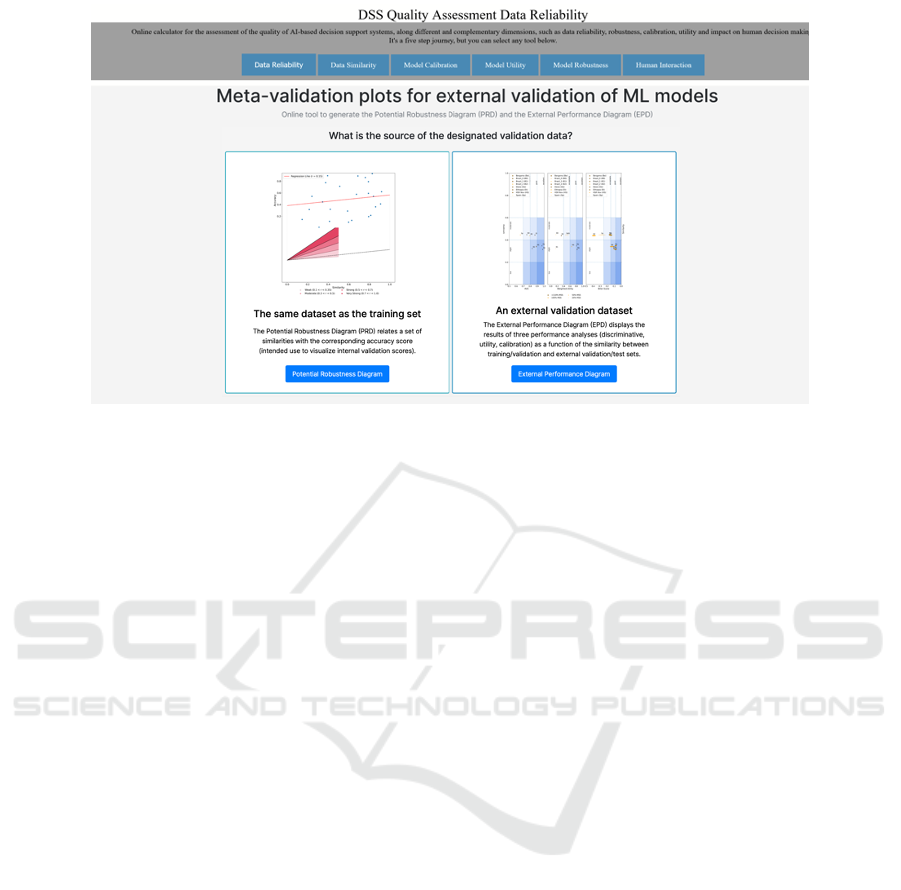
Figure 1: Screenshot of the online tool to generate the Potential Robustness Diagram (PRD) and the External Performance
Diagram (EPD).
In fact, the primary objective behind assessing ro-
bustness is to ascertain how a DSS reacts to data that
is different from its training set. A truly robust system
would maintain a comparable level of performance,
even when exposed to data with differing distribu-
tions, features, or socio-demographic origins. This
assessment becomes pivotal because, in practical de-
ployments, DSSs frequently come across data that
varies significantly from their training data.
The robustness assessment is built on two founda-
tional pillars:
1. Performance Evaluation: At its core, the assess-
ment wants to ascertain the efficacy of the DSS.
This is gauged through three key performance di-
mensions:
(a) Discrimination Power: A measure of accu-
racy or error rate. Usually, sensitivity and
specificity are used in some combinations and
Area Under the Curve (AUC), F1 scores or
balanced accuracy are metrics frequently em-
ployed to evaluate the discrimination power.
(b) Utility: This determines the practical signif-
icance of the DSS’s predictions, by assess-
ing whether they are able to minimize costs
while maximizing benefits and reducing poten-
tial misclassification harms.
(c) Calibration: A deeper exploration of this met-
ric will follow: it essentially gauges the reliabil-
ity of the DSS’s predictions, the extent its confi-
dences scores can be read as positive predictive
values and hence its output can be interpreted
as a properly probabilistic statement.
The evaluations above also incorporate uncer-
tainty quantification, represented by confidence
intervals, and an assessment of the dataset’s ad-
equacy in terms of sample size, that is in terms of
representativeness.
2. Data Similarity Evaluation: Since robustness
inherently involves gauging performance stability
across different data settings, understanding the
similarity between these different settings is es-
sential. If a DSS’s performance deteriorates only
marginally with increasing data dissimilarity, it
can be deemed robust, because this is a sign of
generalizability and absence of overfitting.
The Data Similarity Evaluation will be explored
in section 3. As for performance evaluation, while the
evaluation of discrimination power leverages conven-
tional error rate-based performance metrics, the inno-
vative methodologies introduced for this robustness
tool predominantly deal with evaluating data similar-
ity, calibration, and utility, which will be respectively
explored in subsections 3, 4 and 5.
2.1 Metrics and Visualizations
As previously mentioned, Performance Evaluation
and Data Similarity Evaluation constitute the two pil-
lars of Robustness Evaluation. Building on these two
pillars, two forms of robustness can be considered,
differing both in terms of the data they require as well
as in the strength of the evidence they provide about a
model’s robustness: potential robustness, whose aim
is to evaluate how a model performs on various data
splits, with the aim of producing a worst-case evalu-
ation of the model’s generalization ability within the
Answering the Call to Go Beyond Accuracy: An Online Tool for the Multidimensional Assessment of Decision Support Systems
221

standard setting of internal validation; and external
robustness, where one aims at gauging variations in
performance on completely different datasets, also ac-
cording to their similarity with regard to the training
data.Therefore, the robustness evaluation in the DSS
Quality Assessment tool consists in the generation of
two possible meta-validation plots, as shown in Fig.
1: the Potential Robustness Diagram (PRD) and the
External Performance Diagram (EPD) (Cabitza et al.,
2021).
One of the two analyses is advised according to
the specific case at hand. While the PRD is best suited
for visualizing internal validation scores when the val-
idation data originates from the same dataset as the
training set, e.g. when external validation datasets
are not yet available, the EPD visualizes robustness
according to the performance of the system on com-
pletely different data from the training set (that is, an
external validation dataset). The EPD displays the
results of the three performance analyses (discrimi-
native, utility, calibration) in relation to the similar-
ity between training/validation datasets and external
validation/test datasets. Importantly, the EPD encom-
passes the methodologies for similarity and calibra-
tion assessment, providing details on the adequacy of
the external validation set’s sample size and the ac-
ceptability of performance metrics. Users also have
the flexibility to choose performance metrics tailored
to their use case (e.g., AUC or balanced accuracy, for
discrimination; net benefit or weighted utility, for util-
ity; Brier score or ECI, for calibration).
3 SIMILARITY
As describe previously, a comprehensive evaluation
of the robustness of a DSS requires first determining
how similar two data sets are (typically contrasting
development-time data with deployment-time data).
For this reason, it is necessary to ascertain whether
two datasets stem from the same distribution and the
extent they are similar (although these two things are
not necessarily equivalent).
To investigate the difference in distributions
among two datasets, traditional statistical approaches,
such as Goodness of Fit or other distribution compar-
ison tests, are usually invoked. The underlying hy-
pothesis is that each dataset is a sample drawn from a
probability distribution, such as patient arrivals at an
emergency department. The aim is to discern if the
underlying distributions generating these datasets are
identical (to any practical aims, with respect to some
of their moments). While methods like Kolmogorov-
Smirnov (Smirnov, 1948) or Mann-Whitney tests are
foundational in statistics for such comparisons, they
are largely tailored for one-dimensional data, e.g.,
comparing patient age distributions between two hos-
pitals. This is especially challenging for modern AI-
based DSSs, which grapple with multi-dimensional
data, spanning not just age, but height, weight, and
potentially hundreds of biological markers.
A solution to this conundrum is to augment sta-
tistical hypothesis tests, traditionally used for evalu-
ating distribution equality, to be applicable to multi-
dimensional data. Instead of assessing similarity on
a feature-by-feature basis, we conceptualize each of
the two datasets as if compared to a graph, where
each point indicates an instance and connections in-
dicate neighborhood relationships (based on proxim-
ity), from which one can extract a one-dimensional
characteristic, namely the distribution of distances.
These two distributions are one-dimensional, there-
fore standard hypothesis testing tools can be applied
to evaluate whether the two samples are drawn from
the same probability distribution.
Of course, we are aware that it still remains very
difficult, and an open research topic, to quantitatively
estimate the similarity between two sets in a multidi-
mensional space; in this regard it is also interesting to
note that a spatial metric may not necessarily correlate
with how humans perceive two instances or instances
as similar (Cabitza et al., 2023b). Thus, while we are
confident that the approach to address similarity esti-
mation that we will present in the next section is state-
of-the-art, we recognize that there may be other ways
of measuring similarity between data points and that
their related scores may also differ significantly.
3.1 Metrics and Visualizations
The output of the tool provides both a numerical and
a visual representation of data similarity. At the heart
of this methodology is the degree of correspondence
metric, denoted as ψ (psi). Developed specifically
to quantify the similarity between high-dimensional
datasets, this metric is based on a high-dimensional
geometry permutation test approach, as briefly de-
scribed above and detailed in (Cabitza et al., 2020b).
The provided number, the p-value of the above test,
gauges the likelihood that both datasets come from
the same distribution: for instance, if the p-value is
less than a standard threshold (e.g., 0.05), it provides
significant evidence of differing distributions.
The related visual representation complements
this finding, and to this aim it adopts the principle of
vague visualizations (Assale et al., 2020). This ap-
proach has been proposed to convey a qualitative idea
of a quantitative estimate, in this case of data similar-
HEALTHINF 2024 - 17th International Conference on Health Informatics
222

ity, in a non-numerical way. In Figure 2 it is possible
to see how the p-value is intuitively conveyed in terms
of noise to an original image full of details and colors:
the less intelligible the image (as in, more noisy and
hence less similar to the original), the more different
the two datasets.
Furthermore, the tool also uses more traditional
visualizations (e.g., scatter plots and distribution
plots) to illustrate the distributions of, as well as the
relationship among, the two most representative data
features.
Figure 2: A visualization of the output of the Data Similar-
ity tool. The visualization illustrates the extent to which a
dataset (or a data point) is similar to a reference dataset: a
more noisy, lower-detailed image indicates lower similarity.
4 CALIBRATION
Calibration assessment has a critical role in ensuring
that DSS predictions are adequately aligned with ob-
served frequencies, ultimately enabling probabilistic
and risk-based reasoning. In essence, calibration can
be easily explained by an example: if a DSS claims a
specific clinical outcome has, for example, an 18%
probability of occurring, this outcome should occur
in the real world with frequency that is as close as
possible to the claimed 18%. This example also
demonstrates the (often neglected) importance of
this parameter of model performance: indeed, a cali-
brated DSS supports the interpretation of confidence
scores as genuine probabilities, which is crucial for
risk-based and frequency-based reasoning.
This simple idea of calibration can be declined in
several aspects, highlighting its multi-faceted nature:
1. Class-wise Calibration: Beyond binary tasks,
DSSs often operate in multi-class scenarios, e.g.,
identifying various diseases. It is crucial to ensure
that the DSS is calibrated for each class, espe-
cially given the challenges posed by imbalanced
datasets where minority classes might be under-
represented.
2. Local Calibration: This pertains to the DSS’s
calibration within specific predicted probability
ranges, e.g., a DSS could be calibrated only for
outcomes associated with high confidence scores
(e.g., outcomes associated with a 90% confidence
score could occur with a 90% probability), while
producing largely over-confident assessments on
rare outcomes (e.g., outcomes associated with a
25% confidence score in reality only occur with
a 10% probability). This aspect of calibration is
particularly relevant as regards predictions whose
confidence scores are close to the decision thresh-
old (usually 50%), as in this case small calibration
errors could also impact on the DSS performance.
3. Over- and Under-Confidence: Beyond just iden-
tifying misalignments, it is essential to diagnose
the nature of calibration errors. An over-confident
DSS might predict outcomes as more probable
than they genuinely are, leading to inflated costs,
while an under-confident system might underesti-
mate genuine risks.
4.1 Metrics and Visualizations
Two metrics, the Brier score and the ECI index,
are employed to offer quantitative evaluations of
calibration. Both employ a binning strategy, dis-
cretizing observed predicted scores. The Brier score
(Brier, 1950), with its roots in statistical analysis of
meteorological forecasts, effectively uses an infinite
binning approach, considering each case individually.
In contrast, the ECI index (Famiglini et al., 2023)
uses a finite number of bins. Both metrics provide
insight into calibration errors, including under-
or over-forecasting. In particular, the Estimated
Calibration Index (ECI) framework offers a more
granular evaluation compared to the widely-used
Expected Calibration Error (ECE) metric (Guo et al.,
2017), as it considers varying decision thresholds
(local calibration), prediction classes (class-wise
calibration), and types of calibration errors, such
as underestimation or overestimation of empirical
frequencies.
Answering the Call to Go Beyond Accuracy: An Online Tool for the Multidimensional Assessment of Decision Support Systems
223
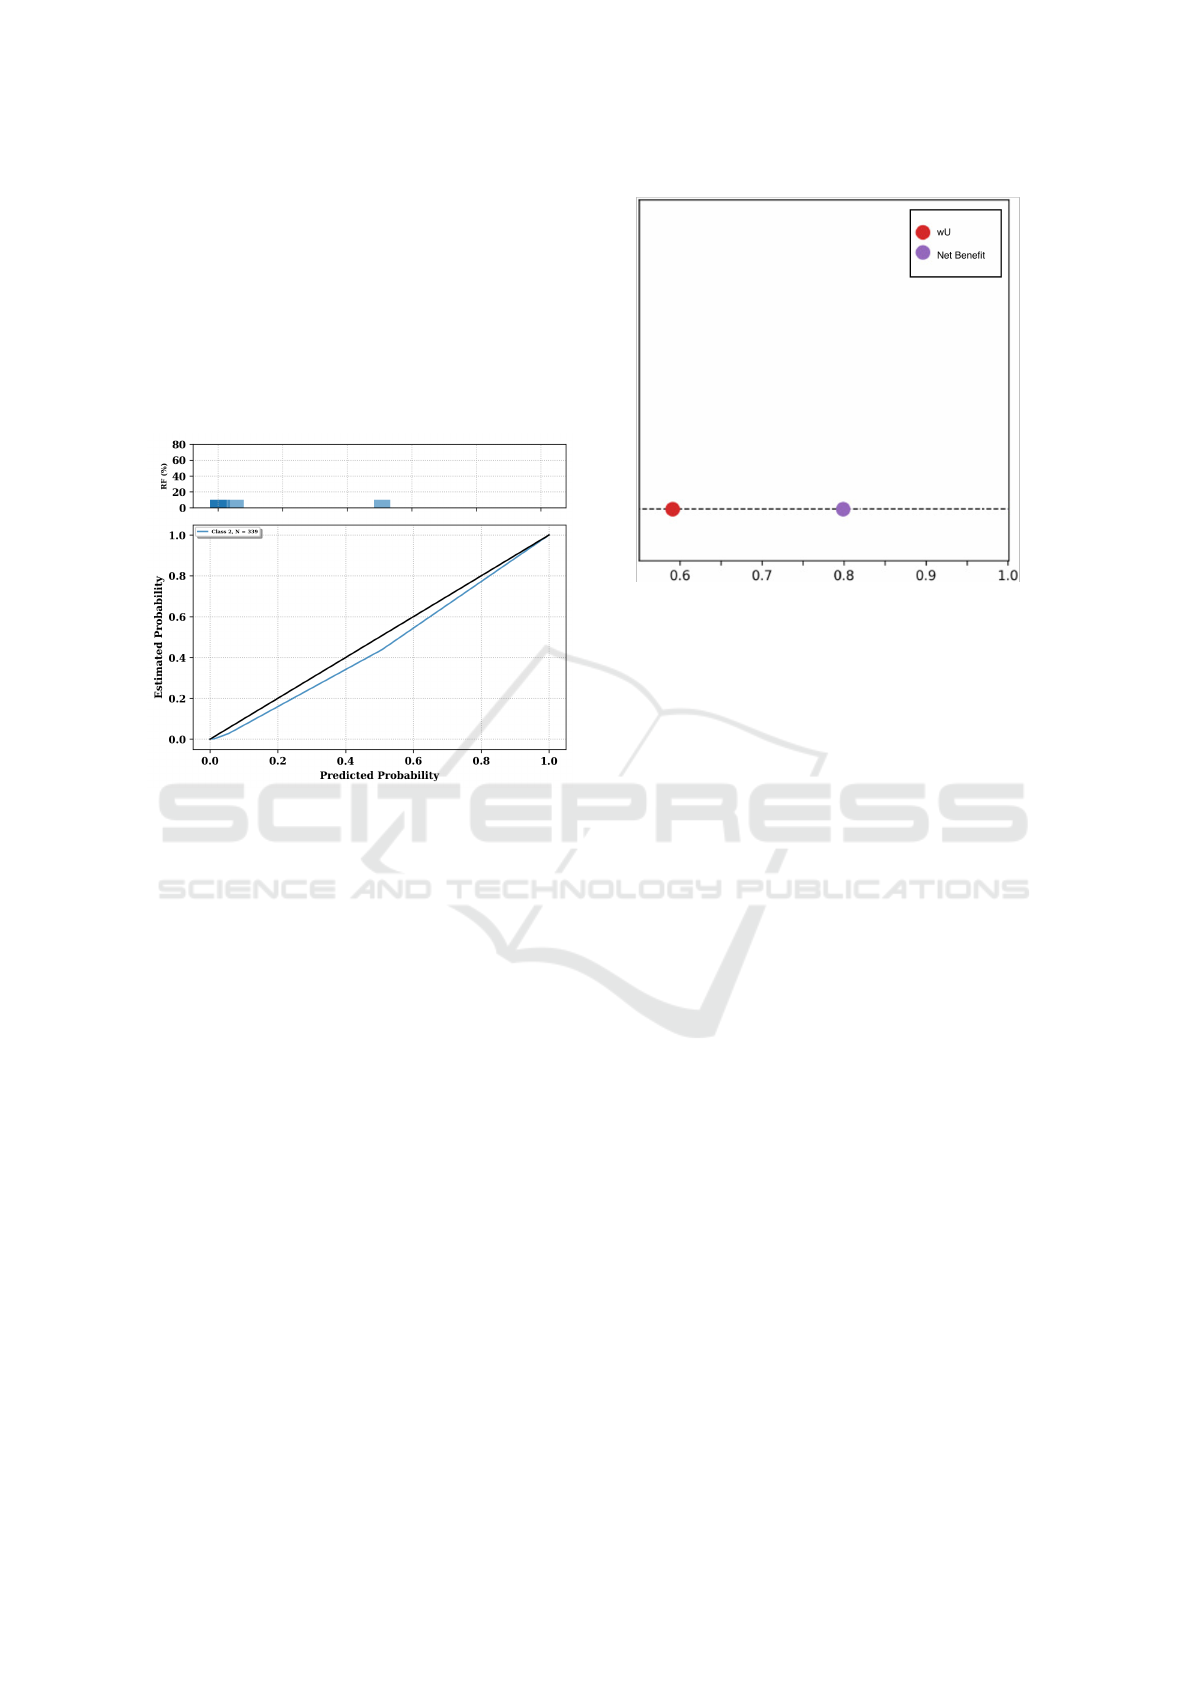
Calibration can also be visualized through cali-
bration curves, plotting mean predicted confidence
scores against observed positive fractions, as shown
in Figure 3. A perfectly calibrated DSS would have
its curve align with the diagonal. The distance of the
curve from this diagonal provides insights into the
calibration quality, with curves above the diagonal in-
dicating over-forecasting and those below indicating
under-forecasting, and is directly employed to com-
pute the ECI metrics.
Figure 3: The graph shows a reliability diagram, with the
bars representing the observed frequency of outcomes (Rel-
ative Frequency, RF) for predicted probabilities in each bin.
The lower sub-plot is the calibration curve itself, displaying
the relationship between predicted probabilities and the es-
timated probability of an outcome. A perfectly calibrated
model would align with the diagonal line.
5 UTILITY
Utility, in the context of DSS, refers to its capacity to
facilitate decisions that yield optimal outcomes at re-
duced costs. Consider a scenario where a DSS aids
in correctly diagnosing and treating a patient: while a
given cost is associated with providing the treatment,
the benefits (ensuring the patient’s health) are sub-
stantial and largely outweigh the costs. Conversely,
incorrect treatments or missed diagnoses can lead to
significant costs, both financial and in terms of patient
well-being. Ideally, with an effective DSS in place,
the decision-making process should incur lower costs
compared to scenarios without the DSS, in line with
Friedman’s “fundamental theorem” of Biomedical In-
formatics: “A person working in partnership with an
information resource is ‘better’ than that same person
unassisted” (Friedman, 2009).
Utility assessment, especially using the Net Ben-
Figure 4: Screenshot of the visual output of the utility mod-
ule.
efit approach (Vickers et al., 2016), requires that DSS
predictions not only be accurate but also yield tangi-
ble benefits upon implementation. This assessment is
built by first defining appropriate values for costs and
benefits of both true and false positive predictions,
which in turn determine a sensible threshold for clas-
sifying instances as positive or negative, and then us-
ing this information to produce a weighted estimate of
the DSS’s ability to maximize benefits (i.e., maximize
true positives) while minimizing costs (i.e., minimize
false positives). These benefits are typically gauged
against standard baselines. In healthcare, these base-
lines might be “treat all” or “treat none” scenarios.
5.1 Metrics and Visualizations
The tool leverages the novel utility metric of weighted
Utility (wU), first introduced in (Campagner et al.,
2022). wU is based on the level of confidence of raters
on their own annotation, as well as on the relevance
of the training cases. As shown by (Campagner et al.,
2022), this metric generalizes the more common Net
Benefit (Vickers et al., 2016), as well as other met-
rics for the assessment of utility and accuracy, while
at the same time offering a more flexible and holistic
assessment that also takes into account three crucial
elements.
The first crucial element is Error Hierarchy: The
DSS should be fine-tuned to avoid errors associated
with higher consequences. Then, the DSS should of-
fer Assistance in Crucial Cases: weights assigned to
various cases ensure that more significant decisions
carry more weight in the utility assessment. Finally,
an optimal DSS should not resort to guessing; instead,
HEALTHINF 2024 - 17th International Conference on Health Informatics
224

it should demonstrate Confidence in Predictions, en-
suring consistent and reliable decision-making sup-
port. In the visualization, the wU is compared to the
Net Benefit score, as to also provide a more familiar
metric to assess utility.
6 RELIABILITY
An often hidden assumption behind most of the
metrics in literature is that the ground truth used
for both training and evaluation of models is per-
fectly reliable and reflective of the truth (hence,
the commonly adopted names ground truth or gold
standard). In practice, however, such ground truths
are produced by aggregating the opinions of different
annotators, that may present significant differences in
their labelling behaviour with regards to agreement,
confidence and competence. This, in turn, can affect
the estimated accuracy of any DSS system trained
or evaluated on the basis of such labels, which can
thus significantly differ from its theoretical accuracy,
i.e., its agreement with the true labels of which the
ground truth labeling is but an approximation. For
this reason, the assessment of data reliability is of
paramount importance, as it allows to quantify how
much a ground truth can be relied upon by gauging
the agreement (and its quality) among the annotators
who were involved to produce it, as well as the
influence of potential data reliability issues onto
DSS’s performance estimates.
Several approaches have been proposed in the lit-
erature to measure the reliability of a ground truth,
most of which are based on the so-called P
o
met-
ric, which simply measures the agreement among the
labels produced in a multi-rater setting. Typically,
however, this naive approach is augmented so as to
take into account the possibility of agreements emerg-
ing due only to chance: different models of chance,
thus, result in different metrics, among which the
most commonly adopted ones are the Krippendorff’s
α (Krippendorff, 2018) and Cohen’s k (or its general-
ization due to Fleiss) (Fleiss et al., 1981). Such met-
rics, however, only have a limited model of chance
that may not be reflective of the actual uncertainty and
confidence exhibited by the involved annotators, and
furthermore they do not take into account other im-
portant aspects of data reliability, namely the annota-
tors’ competence and confidence.
6.1 Metrics and Visualizations
This tool embeds the novel reliability metric pre-
sented by (Cabitza et al., 2020a) to quantify the extent
a ground truth, generated in multi-rater settings, is a
reliable basis for the training and validation of ma-
chine learning predictive models. To define this met-
ric, three dimensions are taken into account: agree-
ment (that is, how much a group of raters mutually
agree on a single case); confidence (that is, how much
a rater is certain of each rating expressed); and com-
petence (that is, how accurate a rater is). Therefore,
this metric is a a conservative, chance-adjusted, rater-
aware metric of inter-rater agreement, producing a
reliability score weighted for the raters’ confidence
and competence while only requiring the former in-
formation to be actually collected, as the latter can
be obtained by the ratings themselves, if no further
information is available.Although some have argued
the data required for this metric is rarely included in
datasets, such as done in (Gu et al., 2022), the metric
seems to have promoted more exhaustive data collec-
tion in this regard.
The output is the visualization presented in Figure
5. As for Figure 6, values below 0.67 indicate unreli-
able data for most practical purposes; values between
0.67 and 0.8 should be used with caution for deli-
cate and sensitive applications (like in medical predic-
tive models). Values above 0.8 can be considered of
sufficient or good reliability, according to the score,
although optimality depends on the application use
case.
The tool also provides a nomogram by which
to assess the theoretical accuracy of a classifica-
tion model, given the reliability of its ground truth:
this aims at highlighting how theoretical estimates of
model performance are consistently overestimated if
ground truth reliability is not properly taken into ac-
count.
Figure 5: A visualization of the output of the Reliability
tool, displaying the distribution of confidence scores across
the raters.
Answering the Call to Go Beyond Accuracy: An Online Tool for the Multidimensional Assessment of Decision Support Systems
225

Figure 6: A visualization of the output of the Reliability
tool, displaying the Krippendorff’s alpha, Percent of Agree-
ment (Po), Weighted Reliability Score for a Rasch model
estimate (ρR) and the Weighted Reliability Score informed
by the reported accuracy for each rater (ρa).
7 HUMAN INTERACTION
Up until now, our discussion has predominantly fo-
cused on evaluating the performance of the Deci-
sion Support Systems (DSS) in a vacuum, as though
it operates independently in an automated decision-
making framework. However, in real-world applica-
tions, especially in critical contexts, this scenario is
far from reality. Ideally, these systems are not de-
ployed to single-handedly make decisions. Instead,
they play a pivotal role in assisting human profession-
als in their decision-making processes.
Yet, an essential question remains largely un-
addressed from the steps and dimensions detailed
above: How does the DSS influence human decision-
making? The latter step of our evaluation journey
delves into whether the DSS genuinely enhances the
quality of the final decisions made by the human
decision-maker.
Through the metrics of technology impact, au-
tomation bias and detrimental algorithmic aversion,
to be explored in the following subsection, we offer
a comprehensive evaluation of a DSS’s role in human
decision-making.
7.1 Metrics and Visualizations
Our assessment expands to gauge the technological
dominance (Sutton et al., 2023) of the DSS — dis-
cerning its influence on human decisions. The ideal
scenario is one where the DSS elevates the quality of
human decisions without inducing cognitive biases,
such as automation bias and detrimental algorithmic
aversion.
Central to our assessment is the human-first
decision-making protocol, first explored in (Cabitza
et al., 2023a). Here, a human decision-maker formu-
lates an initial judgment without DSS input. Follow-
ing exposure to the AI advice, a final decision is made
Table 1: Definition of all possible decision- and reliance-
patterns between human decision makers and their AI sys-
tem (0: incorrect decision, 1: correct decision). We asso-
ciate the attitude towards the AI in each possible decision
pattern which leads to either accepting or discarding the AI
advice, to the main related cognitive biases.
Human
judg-
ment
(H)
AI
sup-
port
(AI)
Final
deci-
sion
(D)
Reliance
pat-
tern
Biases
and
Effects
0 0 0 detrimental
reliance
(dr)
automation
compla-
cency
0 0 1 beneficial
under-
reliance
(bur)
extreme
algo-
rithmic
aversion
0 1 0 detrimental
self-
reliance
(dsr)
conservatism
bias
0 1 1 beneficial
over-
reliance
(bor)
algorithm
appreci-
ation
1 0 0 detrimental
over-
reliance
(dor)
automation
bias
1 0 1 beneficial
self-
reliance
(bsr)
algorithmic
aversion
1 1 0 detrimental
under-
reliance
(dur)
extreme
algo-
rithmic
aversion
1 1 1 beneficial
reliance
(br)
confirmation
bias (in
later
cases)
by the human. This allows us to ascertain the DSS’s
ability to modify or reinforce a human’s initial deci-
sion by contrasting the initial judgment with the final
decision.
From this comparative analysis, we derive the
Framework of Reliance Patterns, as illustrated in
Table 1. Reliance patterns consist of three binary
outcomes: a correct/incorrect first Human Decision
(HD), the AI advice, and the Final Human Decision
(FHD). Given that each of such judgments can can be
right or wrong relative to a ground truth, the possible
decision shifts between exposure to the AI advice and
the FHD offer insights into potential biases of overre-
liance or underreliance. By observing these patterns
in real-world settings, we calculate three pivotal met-
rics:
1. Automation Bias. Assesses if the DSS inad-
vertently leads human decision-makers astray. It
HEALTHINF 2024 - 17th International Conference on Health Informatics
226
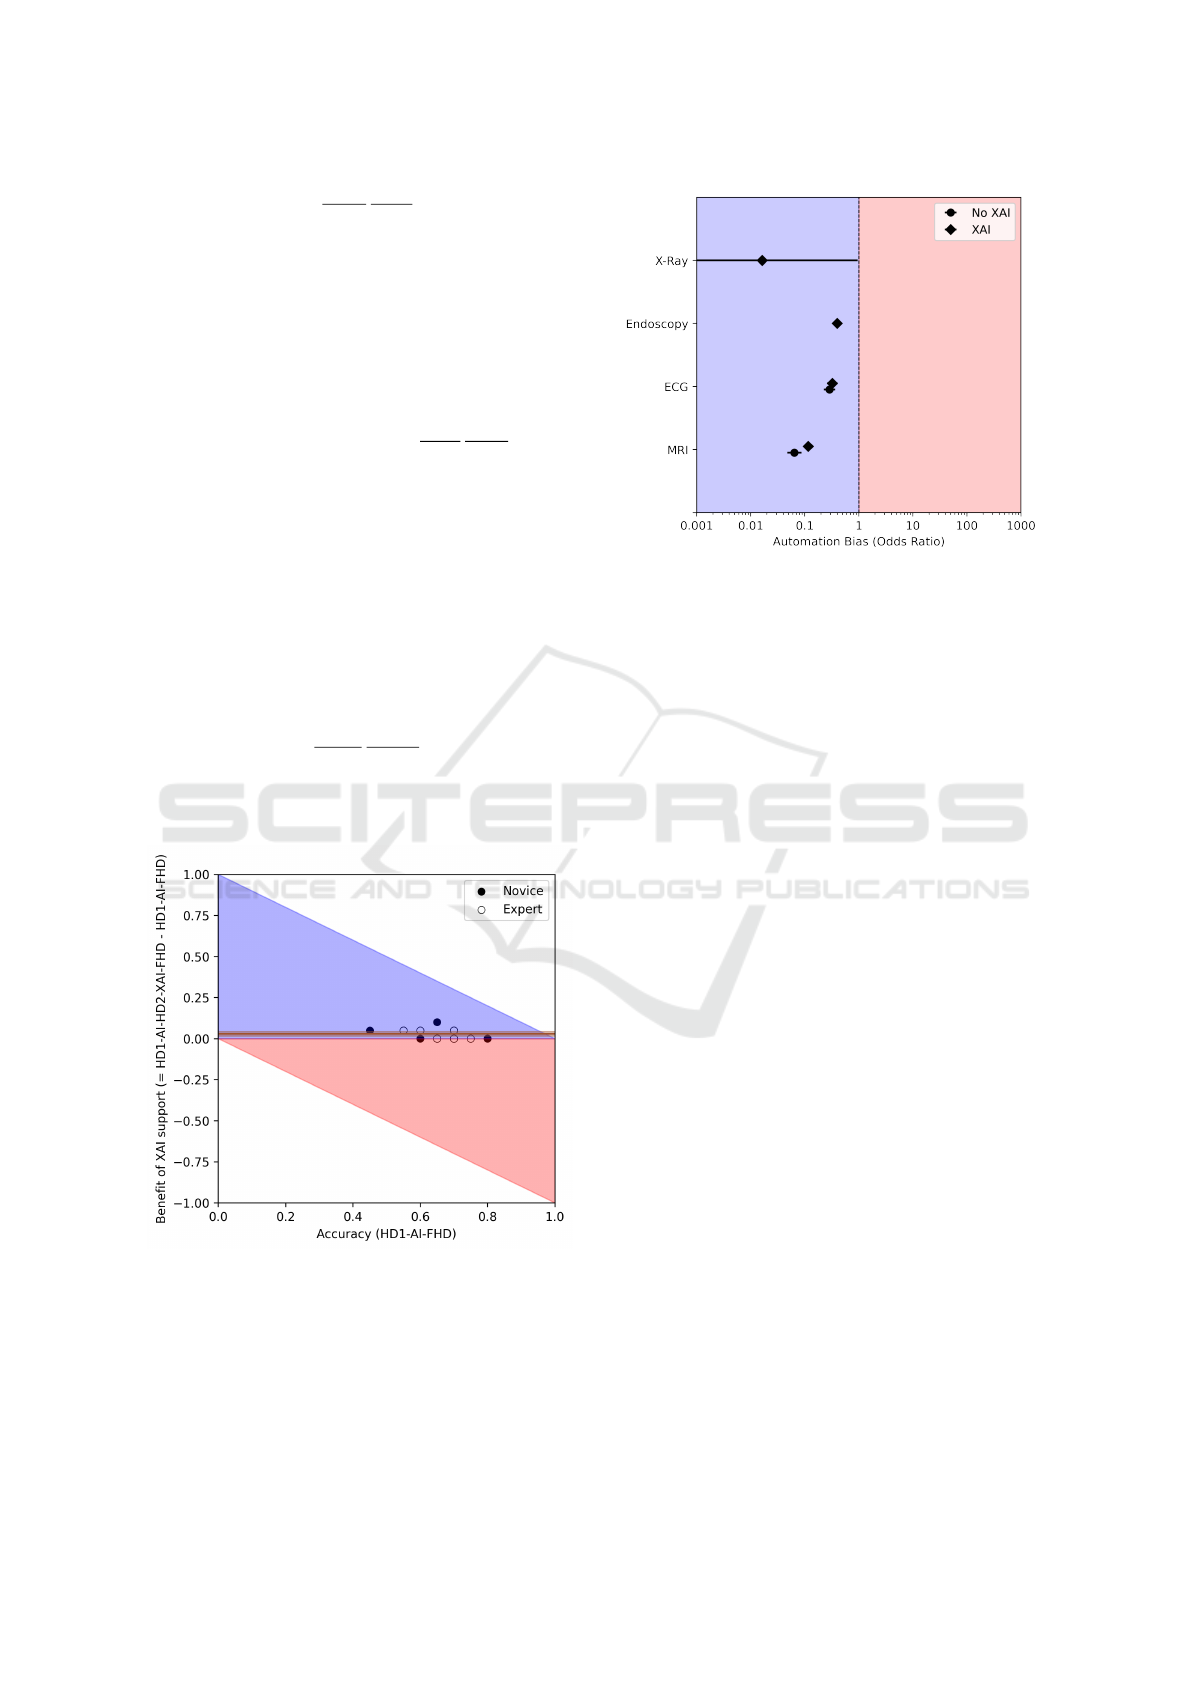
is formulated as
dor
N−dor
N−bsr
bsr
, where dor stands
for Detrimental Over-reliance (i.e., following the
wrong machine advice despite one’s best initial
judgment) and bsr stands for Beneficial Self-
Reliance (i.e., when one’s best judgment leads to
the correct final decision despite the machine’s in-
correct judgment). Figure 8 shows the visualisa-
tion of this metric.
2. Detrimental Algorithmic Aversion. Evaluates
instances where decision-makers disregard cor-
rect DSS recommendations:
dsr
N−dsr
N−bor
bor
, where
dsr means Detrimental Self-Reliance (i.e., follow-
ing one’s own wrong initial judgment despite the
correct machine advice) and bor indicates Benefi-
cial Over-Reliance (i.e., when the machine advice
leads to the correct final decision despite one’s in-
correct first judgment). Its visualisation is identi-
cal to that of Automation Bias, as seen in Figure
8.
3. Technology Impact. Measures the DSS’s in-
fluence on users, gauged through odds ratios
comparing error frequencies conditional on being
aided (AIER) and without AI support (CER). It
is formulated as
CER
1−CER
1−AIER
AIER
. The visualisation
is identical to that of Automation Bias and Detri-
mental Algorirthmic Aversion, as seen in Figure
8.
Figure 7: Example of a Benefit Diagram to visually evalu-
ate the benefit coming from relying on AI. the dots repre-
sent the accuracies of the humans, and the black lines the
average difference in accuracy between the pre-AI and the
post-AI decisions, along with the corresponding 95% confi-
dence interval. The blue region denotes an improvement in
error rates, while the red region denotes a worsening.
A further related notion is the concept of decision
Figure 8: An example of Automation Bias odds ratios, strat-
ified over 4 different case studies. The red region denotes
the presence of automation bias due to the AI intervention,
while the blue region denotes the absence of automation
bias and the presence of algorithmic aversion. Similarly,
in Technology Impact red region denotes an overall nega-
tive effect of the AI intervention, while the blue region de-
notes an overall positive effect; for Detrimental Algorithmic
Aversion, the blue region denotes the absence of detrimental
algorithmic aversion and the presence of algorithm appreci-
ation.
benefit. Intuitively, decision benefit refers to the ad-
vantage (or disadvantage) that an AI system brings
into a decision-making process, measured in terms
of the difference between the accuracy achieved by
the same (or equiparable) physicians when they are
supported by the AI, and the raw accuracy of physi-
cians when they are not supported by the AI. The set-
ting to define and measure the decision benefit is the
same that we defined above, that is: we monitor and
compare the use of the AI system by a team of de-
cision makers, e.g., radiologists, and we interpret AI
(and any other related form of support, such as an eX-
plainable AI) as a socio-technical intervention. The
decision benefit can then be computed as the differ-
ence between the accuracy obtained with the support
of the AI and the accuracy obtained without it, taken
as baseline. In particular, we propose to illustrate this
notion by putting it in relation to the (basal) accuracy
observed before the intervention in terms of a graph-
ical representation that we call benefit diagram (see
Figure 7); this data visualization was inspired by a
similar (unnamed) representation that was first pre-
sented in (Tschandl et al., 2020).
Therefore, the visualizations presented in Figures
7 and 8 offer an insight onto the presence and the level
of Automation Bias, Detrimental Algorithmic Aver-
sion as well as Technology Impact resulting from the
implementation of the AI advice into the decision-
Answering the Call to Go Beyond Accuracy: An Online Tool for the Multidimensional Assessment of Decision Support Systems
227

making process compared to the baseline, unassisted
human decision. This can empower managers and de-
signers in either modifying the system to discourage
overreliance or promote trust, or act onto the (com-
pany or institution) culture, proposing training to pro-
fessionals as to promote a balanced level of trust to-
wards the machine advice.
8 CONCLUSIONS
The tool presented in this paper allows for a multi-
dimensional evaluation of the quality of DSS, taking
into account their robustness (Section 2), data simi-
larity (Section 3), calibration (Section 4), utility (Sec-
tion 5), reliability (Section 6) and human interaction
(Section 7). More generally, this work aims at con-
tributing to the “beyond accuracy” discourse: begin-
ning with the critical recognition that the traditional
metric of accuracy, albeit vital, remains just one piece
of the puzzle, we presented the importance of less
prevalent but equally important metrics for DSS qual-
ity assessment. The twofold intent (contribution to
decision support system evaluation, and to the beyond
accuracy discourse) underscores our development of
the DSS Quality Assessment tool as available to all
the interested community of scholars and practition-
ers. Designed with versatility in mind, this tool caters
to a diverse range of needs, serving as a valuable asset
for researchers, practitioners, and organizations.
We recognize the challenges in gathering all nec-
essary data needed for each evaluation step in prac-
tice. The DSS Quality Assessment tool is designed to
be modular, with each step capable of independent ex-
ecution depending on available data. This flexibility
allows users to tailor the evaluation to their specific
goals and available resources.
In our promotion of a multidimensional assess-
ment of DSS, we conclude by emphasizing the imper-
ative of technovigilance (Cabitza and Zeitoun, 2019).
Beyond mere evaluation, there is a need for continu-
ous oversight and reflection on the deployment, use,
and implications of these systems, especially as new
challenges arise in Medical AI. The modular design
of the DSS Quality Assessment tool, for example, al-
lows for the adaptation and inclusion of additional as-
sessments as needs arise. With the increasing threat of
adversarial attacks on ML systems — a threat posing
significant risks in the medical domain — evaluations
of robustness against such attacks are set to become
more and more relevant in the near future (Li et al.,
2021). This ensures that the tool remains relevant and
useful in the face of these evolving threats.
A genuinely effective Decision Support System
(DSS) must be integrated within a culture that pri-
oritizes technology assessment, vigilantly monitors
outcomes, and is consistently attentive to the effects
observed. As the field of Artificial Intelligence (AI)
evolves, so does our comprehension of how to eval-
uate it. It has become clear that concentrating solely
on accuracy is inadequate. Employing a broad, mul-
tifaceted approach is not merely advantageous – it is
imperative. Our tool, which is readily available online
at no cost, represents a modest yet significant con-
tribution towards realizing this research agenda and
methodology, and it is open for use and validation by
all practitioners and researchers who are aligned with
these principles.
REFERENCES
Araujo, T., Helberger, N., Kruikemeier, S., and De Vreese,
C. H. (2020). In ai we trust? perceptions about auto-
mated decision-making by artificial intelligence. AI &
society, 35:611–623.
Assale, M., Bordogna, S., and Cabitza, F. (2020). Vague
visualizations to reduce quantification bias in shared
medical decision making. In VISIGRAPP (3: IVAPP),
pages 209–216.
Birhane, A., Kalluri, P., Card, D., Agnew, W., Dotan, R.,
and Bao, M. (2022). The values encoded in machine
learning research. In Proceedings of the 2022 ACM
Conference on Fairness, Accountability, and Trans-
parency, pages 173–184.
Brier, G. W. (1950). Verification of forecasts expressed
in terms of probability. Monthly weather review,
78(1):1–3.
Cabitza, F. and Campagner, A. (2021). The need to sepa-
rate the wheat from the chaff in medical informatics:
Introducing a comprehensive checklist for the (self)-
assessment of medical AI studies. International Jour-
nal of Medical Informatics, 153.
Cabitza, F., Campagner, A., Albano, D., Aliprandi, A.,
Bruno, A., Chianca, V., Corazza, A., Di Pietto, F.,
Gambino, A., Gitto, S., et al. (2020a). The elephant in
the machine: Proposing a new metric of data reliabil-
ity and its application to a medical case to assess clas-
sification reliability. Applied Sciences, 10(11):4014.
Cabitza, F., Campagner, A., Ronzio, L., Cameli, M., Man-
doli, G. E., Pastore, M. C., Sconfienza, L. M., Fol-
gado, D., Barandas, M., and Gamboa, H. (2023a).
Rams, hounds and white boxes: Investigating human–
ai collaboration protocols in medical diagnosis. Arti-
ficial Intelligence in Medicine, 138:102506.
Cabitza, F., Campagner, A., and Sconfienza, L. M. (2020b).
As if sand were stone. new concepts and metrics to
probe the ground on which to build trustable ai. BMC
Medical Informatics and Decision Making, 20(1):1–
21.
Cabitza, F., Campagner, A., Soares, F., et al. (2021). The
importance of being external. methodological insights
HEALTHINF 2024 - 17th International Conference on Health Informatics
228

for the external validation of machine learning mod-
els in medicine. Computer Methods and Programs in
Biomedicine, 208:106288.
Cabitza, F., Fogli, D., and Piccinno, A. (2014). Fostering
participation and co-evolution in sentient multimedia
systems. Journal of Visual Languages & Computing,
25(6):684–694.
Cabitza, F., Natali, C., Famiglini, L., Campagner, A., Cac-
cavella, V., and Gallazzi, E. (2023b). Never tell me
the odds. investigating the concept of similarity and
its use in pro-hoc explanations in radiological ai set-
tings. Under review.
Cabitza, F. and Zeitoun, J.-D. (2019). The proof of the pud-
ding: in praise of a culture of real-world validation for
medical artificial intelligence. Annals of translational
medicine, 7(8).
Campagner, A., Sternini, F., and Cabitza, F. (2022). De-
cisions are not all equal—introducing a utility met-
ric based on case-wise raters’ perceptions. Computer
Methods and Programs in Biomedicine, 221:106930.
Carroll, J. M. and Rosson, M. B. (1992). Getting around the
task-artifact cycle: How to make claims and design by
scenario. ACM Transactions on Information Systems
(TOIS), 10(2):181–212.
Famiglini, L., Campagner, A., and Cabitza, F. (2023). To-
wards a rigorous calibration assessment framework:
Advancements in metrics, methods, and use. In ECAI
2023: Proceedings of the 26th European Conference
on Artificial Intelligence., pages 645–652. IOS Press.
Fleiss, J. L., Levin, B., Paik, M. C., et al. (1981). The mea-
surement of interrater agreement. Statistical methods
for rates and proportions, 2(212-236):22–23.
Friedman, C. P. (2009). A “fundamental theorem” of
biomedical informatics. Journal of the American
Medical Informatics Association, 16(2):169–170.
Gu, K., Masotto, X., Bachani, V., Lakshminarayanan, B.,
Nikodem, J., and Yin, D. (2022). An instance-
dependent simulation framework for learning with la-
bel noise. Machine Learning.
Guo, C., Pleiss, G., Sun, Y., and Weinberger, K. Q. (2017).
On calibration of modern neural networks. In Interna-
tional conference on machine learning, pages 1321–
1330. PMLR.
Kahneman, D., Sibony, O., and Sunstein, C. R. (2021).
Noise: a flaw in human judgment. Hachette UK.
Katsikopoulos, K. V., Simsek, O., Buckmann, M., and
Gigerenzer, G. (2020). Classification in the wild. Ar-
tificial intelligence, 2:80.
Krippendorff, K. (2018). Content analysis: An introduction
to its methodology. Sage publications.
Li, X., Pan, D., and Zhu, D. (2021). Defending against ad-
versarial attacks on medical imaging ai system, clas-
sification or detection? In 2021 IEEE 18th Inter-
national Symposium on Biomedical Imaging (ISBI),
pages 1677–1681. IEEE.
Natali, C. (2023). Per aspera ad astra, or flourishing via
friction: Stimulating cognitive activation by design
through frictional decision support systems. In CEUR
WORKSHOP PROCEEDINGS, volume 3481, pages
15–19.
Smirnov, N. (1948). Table for estimating the goodness of fit
of empirical distributions. The annals of mathematical
statistics, 19(2):279–281.
Steyerberg, E. W. and Harrell, F. E. (2016). Prediction mod-
els need appropriate internal, internal–external, and
external validation. Journal of clinical epidemiology,
69:245–247.
Sutton, S. G., Arnold, V., and Holt, M. (2023). An extension
of the theory of technology dominance: Capturing the
underlying causal complexity. International Journal
of Accounting Information Systems, 50:100626.
Trist, E. L. et al. (1978). On socio-technical systems. So-
ciotechnical systems: A sourcebook, pages 43–57.
Tschandl, P., Rinner, C., Apalla, Z., et al. (2020). Human–
computer collaboration for skin cancer recognition.
Nature Medicine, 26(8):1229–1234.
Vickers, A. J., Van Calster, B., and Steyerberg, E. W.
(2016). Net benefit approaches to the evaluation of
prediction models, molecular markers, and diagnostic
tests. bmj, 352.
Answering the Call to Go Beyond Accuracy: An Online Tool for the Multidimensional Assessment of Decision Support Systems
229
