
Evaluating Movement and Device-Specific DeepConvLSTM Performance
in Wearable-Based Human Activity Recognition
Gabriela Ciortuz
a
, Hawzhin Hozhabr Pour
b
and Sebastian Fudickar
c
Institute of Medical Informatics, University of L
¨
ubeck, Ratzeburger Allee 160, L
¨
ubeck, Germany
Keywords:
Human Activity Recognition, Wearables, Deep Learning, Neural Networks, Time-Series, Behaviour,
Functional Assessment, Physical Condition.
Abstract:
This article provides a comprehensive look at human activity recognition via three consumer devices with
different body placements and a deep hybrid model containing CNN and LSTM layers. The used dataset
consists of 53 activities recorded from the motion sensors (IMUs) of the three devices. Compared to the
available human activity recognition datasets, this dataset holds the biggest number of classes, enabling us to
provide an in-depth analysis of activity recognition for health-related assessments, as well as a comparison
with other benchmark models such as a CNN and LSTM model. In addition, we categorize the activities into
six movement groups and discuss their relevance for health-related assessments. Our results show that the
hybrid model outperforms the benchmark models for all devices individually and all together. Furthermore,
we show that the smartwatch could as a standalone consumer device classify activities in the six movement
groups very well and for most of the use cases using a smartwatch would be practical.
1 INTRODUCTION
The interest in wearable-based Human Activity
Recognition (HAR) has rapidly grown because of its
ability to monitor health and well-being indicators
of individuals as digital biomarkers (Mekruksavanich
et al., 2020). HAR research has mainly focused on
wearable-based approaches, as they have been pre-
ferred over camera systems due to privacy concerns
(Uddin and Soylu, 2021). Moreover, consumer de-
vices, such as smartphones and smartwatches are eas-
ily accessible, omnipresent and have a high user ac-
ceptance (Dave et al., 2022). Considering the om-
nipresence of smartphones, it is a logical step to lever-
age data obtained from smartphone sensors for con-
tinually collecting data in different contexts (Friedrich
et al., 2019). Other consumer devices, such as smart-
watches and smart glasses can also enable the con-
tinuous monitoring of daily activities beyond the con-
fines of personal living spaces, unlocking opportuni-
ties for a more thorough comprehension of people’s
health, contributing especially to the early detection
of physical condition degradation, timely diagnosis
a
https://orcid.org/0000-0001-9443-7825
b
https://orcid.org/0000-0003-4404-7313
c
https://orcid.org/0000-0002-3553-5131
and prognosis of health issues (Dave et al., 2022).
In addition, based on the foundation of HAR, cor-
responding health quality indicators, such as power
measurements and functional assessment parameters
can be extracted (Hellmers et al., 2018). Depending
on the health-related problem, different activities are
relevant. In the context of chronic disease monitoring,
for example in heart disease or diabetes, accelerome-
ters can provide information about the total amount,
intensity and duration of daily physical activity (Hans
Van Remoortel et al., 2012). HAR helps in monitor-
ing patients’ exercise routines, degree of mobility, and
compliance with prescribed activities.
Many methods have been proposed for HAR,
starting with traditional machine learning algorithms,
all the way to Deep Learning (DL) models, such
as Convolutional Neural Networks (CNN), Recur-
rent Neural Networks (RNN), Transformer-based and
deep hybrid models, containing multiple types of lay-
ers (Li et al., 2018; Augustinov et al., 2023).
Comparison studies have highlighted the effec-
tiveness of hybrid deep learning models over feature
learning methods for HAR (Li et al., 2018). One
popular hybrid model which has become state-of-the-
art for HAR is the DeepConvLSTM (Ord
´
o
˜
nez and
Roggen, 2016). This DeepConvLSTM hybrid ar-
chitecture has produced outstanding results in many
746
Ciortuz, G., Hozhabr Pour, H. and Fudickar, S.
Evaluating Movement and Device-Specific DeepConvLSTM Performance in Wearable-Based Human Activity Recognition.
DOI: 10.5220/0012471300003657
Paper published under CC license (CC BY-NC-ND 4.0)
In Proceedings of the 17th International Joint Conference on Biomedical Engineering Systems and Technologies (BIOSTEC 2024) - Volume 2, pages 746-753
ISBN: 978-989-758-688-0; ISSN: 2184-4305
Proceedings Copyright © 2024 by SCITEPRESS – Science and Technology Publications, Lda.

open-access datasets, outperforming other deep learn-
ing models (Bock et al., 2022; Aboo and Ibrahim,
2022).
Most of the existing HAR studies usually deal
with the classification of five and up to 27 classes
(Zhang et al., 2022). Available literature either fo-
cused on a specific use case with a limited number
of activities of interest or used all the labelled activ-
ities in publicly available datasets to prove that their
models worked for the classification task (Gil-Mart
´
ın
et al., 2020).
As a result, it remains uncertain, if the DeepCon-
vLSTM can classify very various types of activities
and scale up to classify between a large number of
classes. To close this gap, in our article, we train the
CogAge dataset collected in (Li et al., 2020) using the
DeepConvLSTM. The CogAge dataset has 53 classes,
making it the biggest HAR dataset known in terms of
the number of activity labels. This fact makes it the
ideal dataset for performing an in-depth evaluation of
the classification results for three consumer devices -
a smartphone, a smartwatch and smart glasses.
The main contributions of this article are:
• We train and evaluate a DeepConvLSTM model
using a dataset of 53 activities.
• We analyse and compare the classification re-
sults of the DeepConvLSTM as benchmark mod-
els such as CNN and LSTM.
• We experiment with data from three consumer de-
vices placed on three different body parts, high-
lighting the health-related use cases for each sen-
sor.
• We propose a new classification of activities into
six movement groups of interest for health-related
assessments.
2 BACKGROUND AND RELATED
WORK
The following two main aspects in HAR research are
usually of great importance: Which type of activities
are to be classified and what algorithms perform that
classification task the best?
2.1 Types of Activities in HAR
Many categorisations of human activities have been
suggested, that facilitate the development and evalua-
tion of HAR models especially for video-based HAR
(Hussain et al., 2020). For wearable-based HAR,
the main categories of activities are atomic activities,
for which (Gil-Mart
´
ın et al., 2020) proposed classify-
ing them into postures, gestures and repetitive actions
and complex activities such as Activities of Daily
Living (ADLs) (Nisar et al., 2020). Atomic activ-
ities are short-term, simple actions (Morshed et al.,
2023), which combined in longer sequences make up
an ADL, which is generally a complex task (Nisar
et al., 2020).
Our as well as other studies/datasets (Li et al.,
2020; Roggen et al., 2012) categorized atomic activi-
ties based on state or locomotion and behavioural ac-
tivity types. State or locomotion activities are related
to the posture or means of moving from one place to
another (Roggen et al., 2012). Behavioural activities
characterize the actions or the behaviour of the subject
(Li et al., 2020). The latter activities are more diffi-
cult to recognize because of multiple factors: Firstly,
many more behavioural activities can be defined than
state activities, and secondly, they can be very similar
in their movement pattern.
In our paper, we focus on behavioural atomic ac-
tivities. We leave the state activities out of our analy-
sis because they have already been analysed in-depth
and consumer devices can easily recognize such ac-
tivities by employing simple models, such as CNNs.
Recognizing more complex activities either demands
a substantial amount of training data or some Recur-
rent Neural Networks (RNN) that process long-term
dependencies to enable the learning of intricate fea-
tures (Abbaspour et al., 2020).
2.2 DeepConvLSTM
Hybrid CNN-LSTM models have been used very of-
ten in HAR because they combine the powers of
both CNN and LSTM layers to process sequential
data (Ord
´
o
˜
nez and Roggen, 2016). By employing
CNN layers, the model can extract spatial features.
Additionally, the LSTM layers can capture tempo-
ral changes from raw sensor data (Roy et al., 2023).
(Ord
´
o
˜
nez and Roggen, 2016) first proposed the Deep-
ConvLSTM. (Bock et al., 2022) proposed that a more
shallow architecture.
The CNN-LSTM architecture is comprised of two
1D CNN layers at first, followed by a dropout layer,
a 1D MaxPooling and a flattening layer, which are
all wrapped in a time-distributed layer, allowing for
the same layers to process all the subsequences in the
window. After the processed data is flattened, it is
fed to a stack of LSTM layers before a dropout and
two dense layers, of which the last layer uses a soft-
max activation for the classification (Phyo and Byun,
2021). Figure 1 depicts the model architecture.
Evaluating Movement and Device-Specific DeepConvLSTM Performance in Wearable-Based Human Activity Recognition
747

Figure 1: The architecture of the DeepConvLSTM model
used in our experiments.
3 METHODS
In the following subsections, the methods and the
dataset used in our study are introduced: The dataset
used, the preprocessing steps applied before the train-
ing of the neural network as well as the experiments
that we conducted.
3.1 Dataset Description
We used a publicly available dataset of behavioural
atomic activities collected from four subjects in (Li
et al., 2020) with three devices: A Google NEXUS
5X smartphone, a Microsoft Band 2 and Jins MEME
glasses placed on the body of the subjects.
The subjects were asked to perform the 55 activi-
ties at least 20 times in two sessions recorded on two
different days. The three devices measured data using
different sampling rates and also had different sensor
channels. The smart glasses provided data from two
sensor modalities: Three-axis accelerometer and gy-
roscope sampled at 20 Hz. The smartwatch provided
the same two sensor modalities as the smart glasses
but sampled at 67 Hz. The smartphone data comes
from four sensor modalities all sampled at 200 Hz:
Three-axis accelerometer, gravity, gyroscope, and lin-
ear accelerometer.
The original CogAge dataset from (Li et al., 2020)
has 55 classes for two configurations: One configura-
tion where both hands were used for the activities and
one configuration, where only the left hand, where the
smartwatch was on, was used. Since we wanted to
differentiate between the various activities, we chose
the left-hand-only configuration and removed two la-
bels, for which there were no measurements done
with the left hand only, leading to 53 labels used in our
study. In contrast to other prominent public datasets
for HAR using wearable data, the CogAge dataset
has by far the highest number of classes. The three
datasets with the highest number of classes reported
in (Zhang et al., 2022) have 27, 19 and 18 classes,
respectively. Consequently, we have at least twice as
many classes as these commonly used public datasets.
This underscores the suitability of the CogAge dataset
for our study’s specific scope, allowing us to compre-
hensively assess the model’s performance across the
three devices and a wide array of behavioural activi-
ties.
For the training and testing of the models, we used
a subject-dependent split of the dataset, where the
data from a first recording session were used for train-
ing, and the data from the second recording session
for testing, ensuring an almost equal split between
training and testing data. Figure 2 depicts the 53 ac-
tivities we used and the number of segments of each
activity in the training and testing dataset.
3.2 Preprocessing
Before feeding the data into the deep neural network
we first applied a Z-score normalization Secondly,
similarly to other works (Irshad et al., 2022; Mah-
mud et al., 2020) using multiple devices with differ-
ent sampling rates, we resampled the data to achieve a
better comparison of the results of the models trained
on the devices individually and on all the devices to-
gether. We upsampled the data to 200 Hz, which
is the highest sampling frequency of the three de-
vices. Because upsampling may lead to overfitting,
we have also downsampled the data to 20 Hz. This
approach did not yield as good results as the upsam-
pling method, because of the loss of too much infor-
mation, thus we proceeded with the upsampled data.
Furthermore, we modified the data representation
to be able to feed it to the hybrid CNN-LSTM model,
which uses subsequences as input to the CNN layers.
A well-crafted feature representation results in more
informative and discriminative features, which in turn
contributes to an improvement in overall performance
(Ciortuz et al., 2023).
3.3 Deep Models
We established a DeepConvLSTM model designed to
process sequences of four seconds duration and a spe-
HEALTHINF 2024 - 17th International Conference on Health Informatics
748
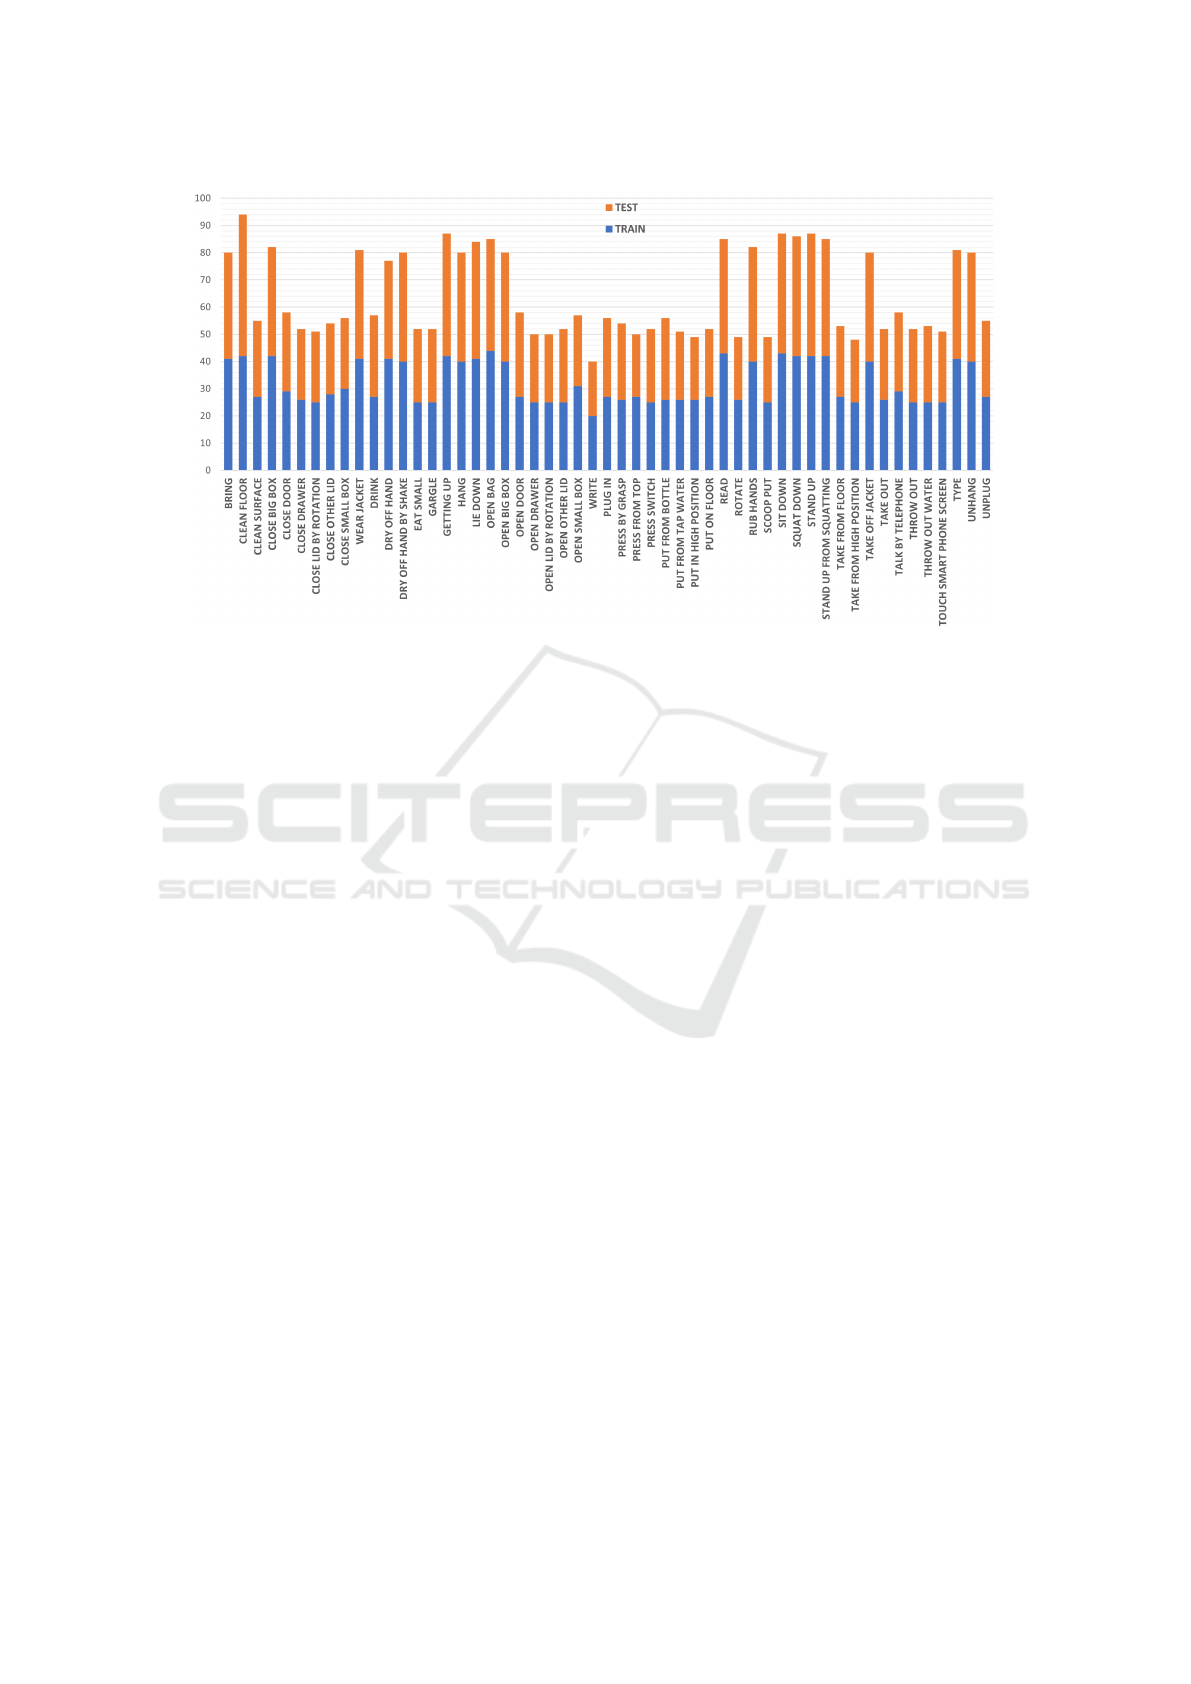
Figure 2: Number of segments of each activity in the dataset used for training and testing.
cific number of features, as required by the respec-
tive sensor or combinations of sensors as mentioned
in Chapter 3.2.
Using the same sampling frequency for all sensors
after upsampling allowed us to build subsequences of
the same length to feed to the CNN layers. Consid-
ering the factors mentioned above, we segmented the
data in subsequences of 160 milliseconds, leading to
a total of 25 subsequences per sample. The subse-
quences are encoded by the CNN layers, flattened and
then fed to the LSTM layers.
As benchmark models, we trained a CNN model
containing three 1D convolutional layers with Max-
Pooling, then a flattening layer and a dense layer for
the classification. We also trained an LSTM model
with one LSTM and one dense layer before a sec-
ond dense layer for classification. Both models were
trained for the same number of epochs as the Deep-
ConvLSTM.
3.4 Experiments
We trained device-specific models for each of the
three devices as well as one combined model to an-
alyze the performance in recognizing the different
types of activities in the dataset and allow investiga-
tion of the benefit of deploying device-specific mod-
els.
Each experiment was conducted as follows: For
each device and all of them together, we trained and
evaluated the models ten times and provided the re-
sults in the form of the mean of each metric. We
trained the models using the Adam optimiser with
a categorical cross-entropy loss function for 1000
epochs. Then we computed the prediction of the test
data on the model that achieved the highest validation
accuracy during training.
We also employed hybrid ConvLSTM architec-
tures with different depths by adding one to four more
LSTM layers to the model. A deeper hybrid archi-
tecture increased the complexity of the model with-
out improving the results, similar to the outcomes in
(Bock et al., 2022). Consequently, we decided to use
a simplified model containing only two LSTM layers.
For the evaluation part, we grouped the activities
into six groups of interest for health-related assess-
ments as follows:
1. Opening/Closing: Close Big Box, Close Door,
Close Drawer, Close Lid By Rotation, Close
Other Lid, Close Small Box, Open Bag, Open Big
Box, Open Door, Open Drawer, Open Lid By Ro-
tation, Open Other Lid, Open Small Box
2. Press and Pull: Plug In, Press By Grasp, Press
From Top, Press Switch, Unplug
3. Raising/Lowering: Bring, Hang, Put From Bot-
tle, Put From Tap Water, Put In High Position,
Put On Floor, Scoop Put, Take From Floor, Take
From High Position, Take Out, Throw Out Water,
Throw Out, Unhang
4. Body Movement: Clean Floor, Getting Up, Lie
Down, Sit Down, Squat Down, Stand Up, Stand
Up From Squatting, Take Out Jacket, Wear Jacket
5. Hand to Head: Drink, Eat Small, Gargle, Talk
By Telephone
Evaluating Movement and Device-Specific DeepConvLSTM Performance in Wearable-Based Human Activity Recognition
749
6. Continuous Hand/Head Movements: Clean
Surface, Dry Off Hand, Dry Off Hand By Shake,
Read, Rotate, Rub Hands, Touch Smart Phone
Screen, Type, Write
3.5 Statistical Evaluation
As evaluation metrics of the models, we included the
average F1-score (AF1), the accuracy, the Mean Av-
erage Precision (MAP) and the Area Under the Curve
(AUC).
4 RESULTS
The results in form of the mean of the Average F1
score, Accuracy, MAP and AUC in % of the activity
recognition over 10 runs for each of the three devices
individually as well as trained together and for each
model: CNN, LSTM and DeepConvLSTM are shown
in Table 1.
We plotted the class F1 score in each of the groups
mentioned above and per each device for a better un-
derstanding of their performance. The mean tendency
per group can be seen in Table 2.
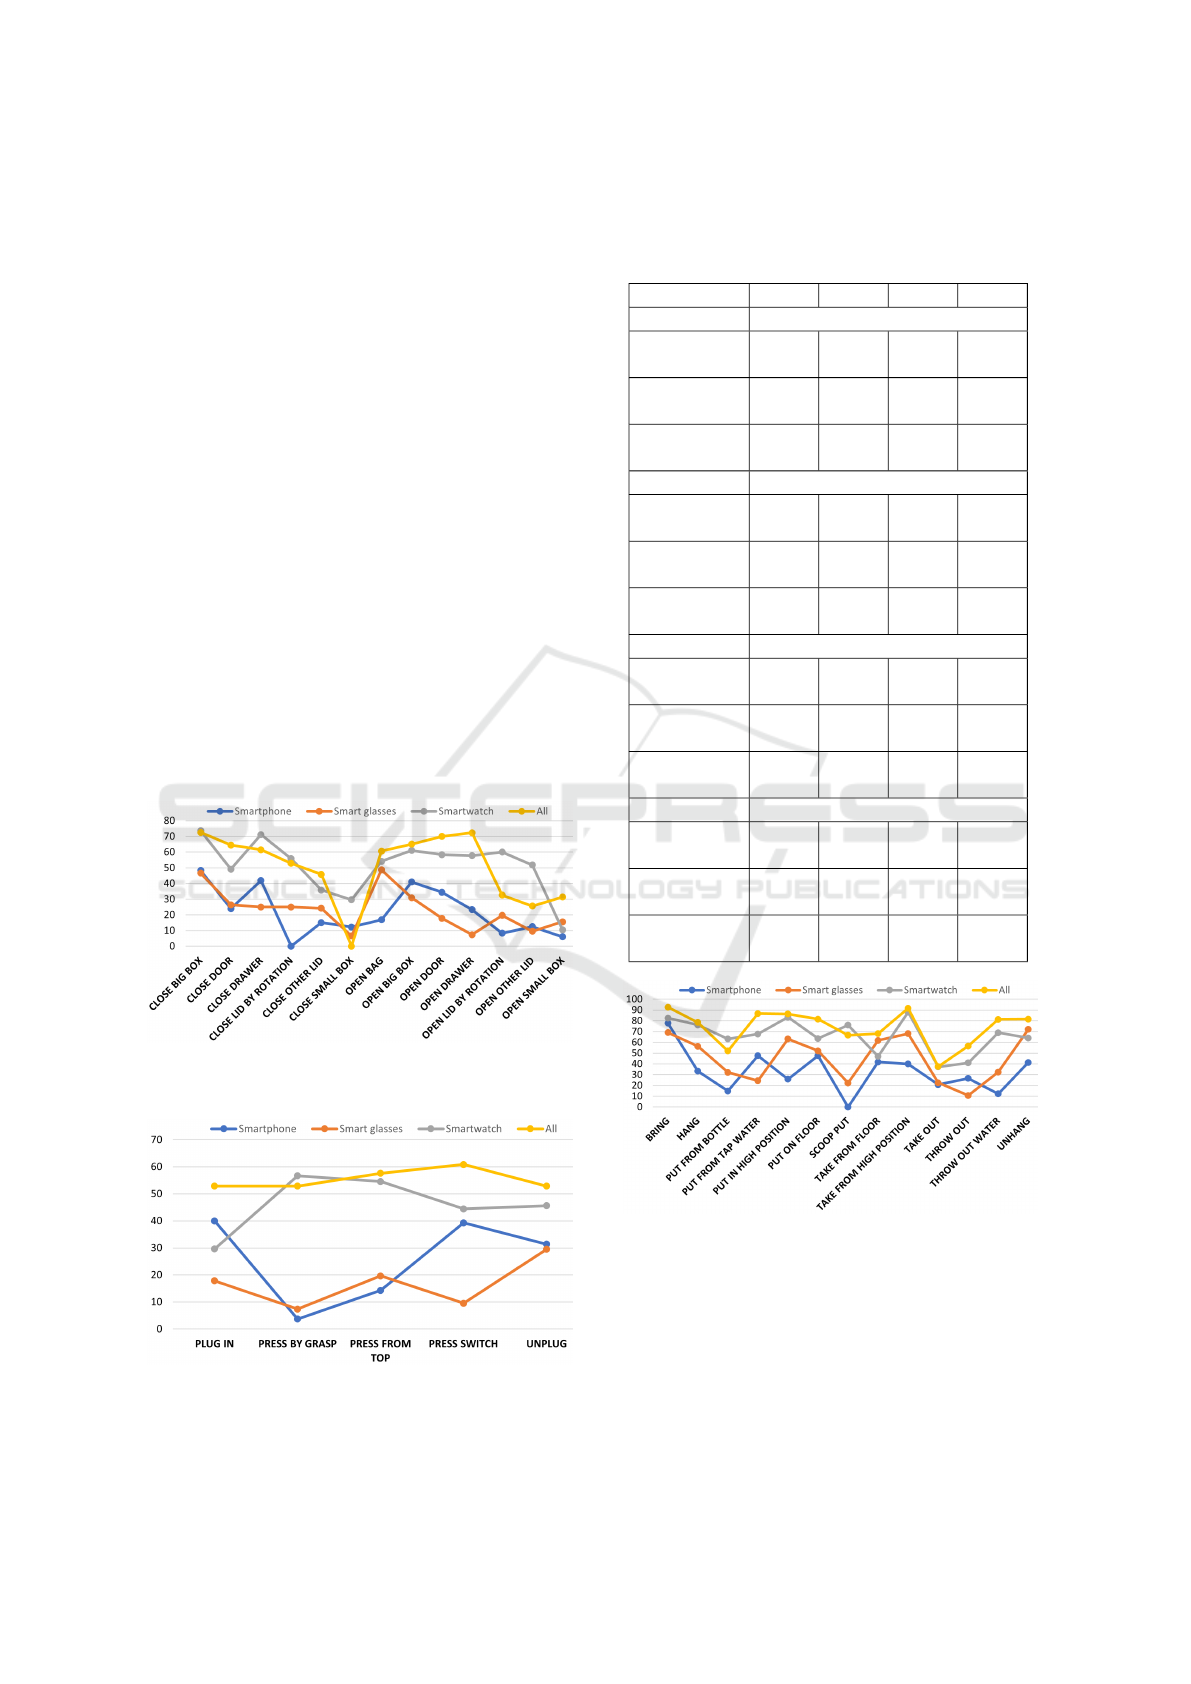
Figure 3: The F1 score per class in group 1 (Clos-
ing/Opening).
Figure 4: The F1 score per class in group 2 (Press and Pull).
Table 1: The mean of the Average F1 Score, Accuracy,
MAP and AUC (in %) of the activity recognition over 10
runs for smartphone, smart glasses and smart watch indi-
vidually and all together.
AF1 Acc MAP AUC
Smartphone
CNN
model
23.75 25.55 23.40 82.89
LSTM
model
23.34 23.71 20.61 83.01
Deep
ConvLSTM
32.07 32.13 30.35 86.02
Smart glasses
CNN
model
28.55 29.09 27.29 86.82
LSTM
model
36.85 37.06 34.59 86.83
Deep
ConvLSTM
37.07 37.37 35.67 86.62
Smartwatch
CNN
model
48.35 48.54 48.51 91.41
LSTM
model
54.08 54.25 54.77 93.41
Deep
ConvLSTM
61.78 61.84 64.06 95.40
All devices
CNN
model
62.73 66.52 69.81 96.54
LSTM
model
51.45 51.78 52.27 92.78
Deep
ConvLSTM
65.64 65.65 68.80 96.11
Figure 5: The F1 score per class in group 3 (Rais-
ing/Lowering).
5 DISCUSSION
We observe in Table 1 that the DeepConvLSTM mod-
els outperform the benchmark CNN and LSTM mod-
els, making it an obvious choice of architecture for
each sensor or all of them together as well. At the
HEALTHINF 2024 - 17th International Conference on Health Informatics
750
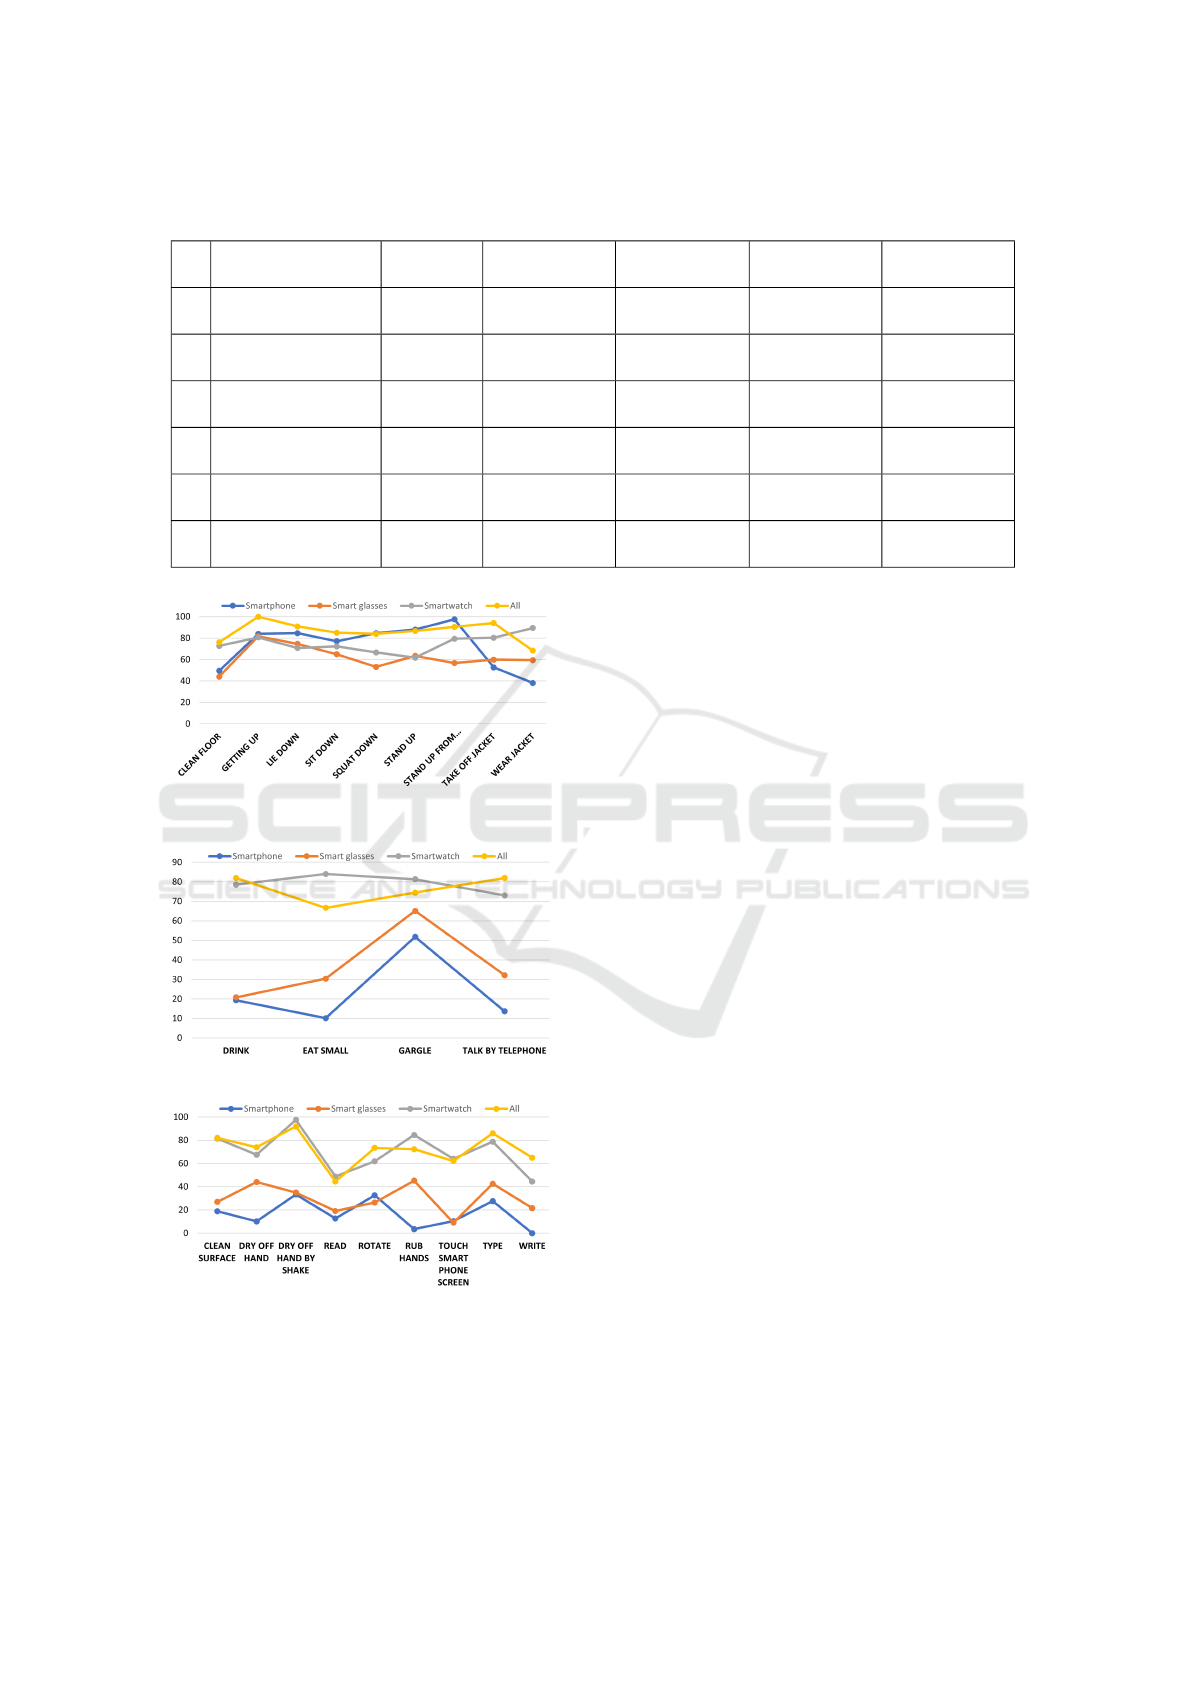
Table 2: The mean (and standard deviation) of the F1 Score (in %) of the activities per group for the smartphone, smart glasses
and smart watch independently as well as all together.
Group
Nr. of
Activities
Smartphone Smart glasses Smartwatch All
1.
Opening/
Closing
13 21.85 (14.66) 23.33 (12.66) 51.45 (16.55) 50.37 (21.22)
2.
Press
and Pull
5 25.72 (14.39) 16.78 (7.89) 46.17 (9.56) 55.39 (3.30)
3.
Raising/
Lowering
13 33.08 (19.05) 45.17 (20.73) 66.04 (15.46) 73.94 (16.10)
4.
Body
Movement
9 72.94 (19.51) 62.93 (10.53) 74.94 (7.94) 86.18 (8.93)
5.
Hand
to Head
4 23.74 (16.72) 37.12 (16.72) 79.23 (4.07) 76.27 (6.32)
6.
Continuous Hand/
Head Movement
9 16.57 (11.58) 30.01 (11.84) 69.90 (16.29) 72.37 (13.36)
Figure 6: The F1 score per class in group 4 (Body Move-
ment).
Figure 7: The F1 score per class in group 5 (Hand to Head).
Figure 8: The F1 score per class in group 6 (Continuous
Hand/Head Movements).
same time, the same table shows, that the CNN is a
better choice over the LSTM, when there are many
features and higher sampling frequencies, such as for
the smartphone (F1 scores 23.75 % and 23.34 %) and
all devices together (F1 scores 62.73 % and 51.45 %).
In contrast for the smart glasses and smartwatch, the
LSTM model performed much better than the CNN
(F1 scores 36.85 % and 28.55 % for the smart glasses
and 53.08 % and 48.35 % for the smartwatch). These
findings highlight the fact, that the DeepConvLSTM
can be generally applied to different HAR classifica-
tion tasks achieving very good results. The DeepCon-
vLSTM achieved an F1 score between 3% and 14%
higher than the other models regardless of the sam-
pling frequency, segment length and number of fea-
tures in the data.
For the evaluation, we categorized the activities
into six groups. The grouping was done by the level
of similarity of the activities and then we analysed
the relevance of each group for health-related assess-
ments, as outlined below.
In general, the tendency in most groups of sim-
ilar activities was that considering the data from all
sensor devices for training achieved higher classifi-
cation performance than the device-specific training
performance, with two exceptions: Group 1: Clos-
ing/Opening where the mean F1 score of the smart-
watch individually is 51.45 %, which is over one
% higher than the mean F1 score using all the sen-
sor channels (50.37%) and Group 5: Hand to Head,
where the smartwatch also outperformed the mean F1
score of all the channels by almost three % (79.23
% and 76.18 %). Since using all of the sensors is
not possible in many contexts and because specific
devices performed very well, we can argue that one
device can be used independently, without many dis-
advantages. For example, when working with elderly
users in a real-life context, using more than one de-
vice might be overwhelming for them.
Looking at the first group (Closing/Opening) in
Figure 3, containing 13 activities related to open-
Evaluating Movement and Device-Specific DeepConvLSTM Performance in Wearable-Based Human Activity Recognition
751

ing or closing, we observe that the smartwatch per-
formed very well in classifying them (54.56 % mean
F1 score) - see 2. Such activities might be relevant
in monitoring rehabilitation after operations or while
recovering from cerebrovascular strokes for example.
Group number two contains five activities where a
pressing or pulling motion is performed. These are
also activities where the hand is involved, thus the
smartwatch is suitable and enough for their recog-
nition, achieving an F1 score of 46.17% (Using all
the devices, the model classification F1 score was
55.39%) - see Table 2. For the activities of press-
ing a switch, plugging and unplugging, we observe
in 4 that the smartphone was also highly relevant, de-
noting, that the subjects performing that activity first
performed a body movement, such as walking to the
light switch or bending toward a power plug. Recog-
nizing simple pressing and pulling actions is relevant
for people who are bedridden due to illness, injury, or
some other physical condition.
Raising or lowering actions (group three) requires
the subject to be more mobile in his arms, enabling
movements such as putting or taking an object from
the floor or a high position - see Figure 5 and con-
tains 13 such activities. The highest mean F1 scores
of the activities in this group is reached by training all
the devices together (74.94 %) followed by the smart-
watch training F1 score (66.04 %) as shown in Ta-
ble 2 Such actions are prevalent in physical exercises
and could be recognized to check if a person complies
with the recommended list of exercises at home.
Body Movements (group four) contains nine more
complex exercises where the whole body is involved
as shown in Figure 6. Being able to wear or take off a
jacket on its own requires complex mobility in the up-
per body. Transitions such as sitting down and getting
up are already part of functional assessments such as
the Timed-Up-and-Go (TUG). The TUG is a common
geriatric assessment test that can be recognized using
wearables and used for motor symptoms assessment
in subjects with Parkinson’s Disease (Kleiner et al.,
2018). Our results show, that a smartphone in the
subject’s left pocket can also recognize these activi-
ties without problems, achieving an F1 score almost
as high as the smartwatch (72.94 % and 74.23 %) -
see Table 2.
The activities in group five are four movements
where the patient raises his arm to their head. In
this case, the smartwatch achieves the highest perfor-
mance (79.23 %) - see Table 2. In Figure 7 we see
that the smart glasses are also highly relevant in mea-
suring the movement of the head, for example, while
eating, gargling and talking by telephone.
The group of continuous Hand or Head Move-
ments (group six) is different from the other groups
because its nine activities are characterized by repeti-
tive similar movements - see 8. Performing repetitive
movements is also associated with physical exercises
for example in monitoring the evolution of chronic
diseases.
In our study we observed, that the smartwatch in-
dividually performed very well for the classification
having only a 4% lower F1 score than the F1 score
achieved by the training of all the devices at once. We
can argue that the difference is negligible in clinical
practice and that the sensibility of the smartwatch is
high enough when considering that using all the de-
vices instead of one, comes with many more chal-
lenges.
We want to point out that our contribution is es-
sential for future studies and lies in offering a compre-
hensive overview of activities that are potentially rele-
vant for HAR in the context of health-related research.
Additionally, we have shown which activities can be
recognized well by which specific sensor, which en-
ables future studies to choose the specific sensor that
works best for their intended research.
6 CONCLUSION
We have trained and evaluated the DeepConvLSTM
model for the classification of a large number of di-
verse activities collected from three devices and com-
pared the classification results with those from bench-
mark models, such as CNN and LSTM. The place-
ment of the devices on different body parts highlights
the strengths of each sensor and its practical signifi-
cance for future research.
Combining the sensors might improve the accu-
racy of HAR, but there are some cases, especially
in the health-related field where it is not realistic to
wear all three devices at once. At the same time,
training models with multiple sensors is challenging
and requires the synchronisation of the data and spe-
cialised models that can deal with different sampling
frequencies. We have shown, that the DeepConvL-
STM is able to overcome these challenges and outper-
form other models such as CNN and LSTM to classify
53 different activities.
This diversity of the dataset we used, containing
the largest number of classes, is important in facilitat-
ing an in-depth analysis of the performance of HAR
using three different devices. Futhermore, the com-
prehensive grouping and analysis of activities in six
distinct categories contribute to the relevance of our
study for health-related assessments.
Together, these contributions advance the under-
HEALTHINF 2024 - 17th International Conference on Health Informatics
752

standing of HAR, especially in the context of health
monitoring and assessment.
ACKNOWLEDGEMENTS
The study is funded by the German Federal Ministry
of Education and Research (Project No. 01ZZ2007).
REFERENCES
Abbaspour, S., Fotouhi, F., Sedaghatbaf, A., Fotouhi, H.,
Vahabi, M., and Linden, M. (2020). A comparative
analysis of hybrid deep learning models for human ac-
tivity recognition. Sensors, 20(19):5707.
Aboo, A. K. and Ibrahim, L. M. (2022). Human activity
recognition using a hybrid lstm-cnn deep neural net-
work. Webology.
Augustinov, G., Nisar, M. A., Li, F., Tabatabaei, A., Grze-
gorzek, M., Sohrabi, K., and Fudickar, S. (2023).
Transformer-based recognition of activities of daily
living from wearable sensor data. In iWOAR ’22,
pages 1–8, Rostock, Germany. ACM.
Bock, M., Hoelzemann, A., Moeller, M., and Laerhoven,
K. V. (2022). Investigating (re)current state-of-the-art
in human activity recognition datasets. Frontiers in
Computer Science, 4.
Ciortuz, G., Grzegorzek, M., and Fudickar, S. (2023).
Effects of time-series data pre-processing on the
transformer-based classification of activities from
smart glasses. In iWOAR ’23, New York, NY, USA.
Association for Computing Machinery.
Dave, R., Seliya, N., Vanamala, M., and Tee, W. (2022).
Human activity recognition models using limited con-
sumer device sensors and machine learning. CoRR,
abs/2201.08565.
Friedrich, B., Cauchi, B., Hein, A., and Fudickar, S. (2019).
Transportation mode classification from smartphone
sensors via a long-short-term-memory network. page
709–713, New York, NY, USA. Association for Com-
puting Machinery.
Gil-Mart
´
ın, M., San-Segundo, R., Fern
´
andez-Mart
´
ınez, F.,
and de C
´
ordoba, R. (2020). Human activity recogni-
tion adapted to the type of movement. Computers &
Electrical Engineering, 88:106822.
Hans Van Remoortel, S. G., Raste, Y., Burtin, C., Louvaris,
Z., Gimeno-Santos, E., Langer, D., Glendenning, G.,
Hopkinson, N., Vogiatzis, I., Peterson, B., Wilson, F.,
Mann, B., Rabinovich, R., Puhan, M., and Troosters,
T. (2012). Validity of activity monitors in health and
chronic disease: A systematic review. The interna-
tional journal of behavioral nutrition and physical ac-
tivity, 9:84.
Hellmers, S., Kromke, T., Dasenbrock, L., Heinks, A.,
Bauer, J. M., Hein, A., and Fudickar, S. (2018).
Stair climb power measurements via inertial measure-
ment units - towards an unsupervised assessment of
strength in domestic environments. In BIOSTEC 2018
- HEALTHINF, pages 39–47, Funchal.
Hussain, Z., Sheng, Q. Z., and Zhang, W. E. (2020). A
review and categorization of techniques on device-free
human activity recognition. Journal of Network and
Computer Applications, 167:102738.
Irshad, M. T., Nisar, M. A., Huang, X., Hartz, J., Flak, O.,
Li, F., Gouverneur, P., Piet, A., Oltmanns, K. M., and
Grzegorzek, M. (2022). Sensehunger: Machine learn-
ing approach to hunger detection using wearable sen-
sors. Sensors, 22(20).
Kleiner, A. F. R., Pacifici, I., Vagnini, A., Camerota, F., Cel-
letti, C., Stocchi, F., De Pandis, M. F., and Galli, M.
(2018). Timed up and go evaluation with wearable
devices: Validation in parkinson’s disease. Journal of
Bodywork and Movement Therapies, 22(2):390–395.
Li, F., Shirahama, K., Nisar, M. A., Huang, X., and Grze-
gorzek, M. (2020). Deep transfer learning for time se-
ries data based on sensor modality classification. Sen-
sors, 20(15):4271.
Li, F., Shirahama, K., Nisar, M. A., K
¨
oping, L., and Grze-
gorzek, M. (2018). Comparison of feature learning
methods for human activity recognition using wear-
able sensors. Sensors, 18(2).
Mahmud, S., Tonmoy, T. H. M., Bhaumik, K. K., Rahman,
M. A. K., Amin, A. M., Shoyaib, M., Khan, M. A. H.,
and Ali, A. A. (2020). Human activity recognition
from wearable sensor data using self-attention.
Mekruksavanich, S., Jitpattanakul, A., Youplao, P., and Yu-
papin, P. (2020). Enhanced hand-oriented activity
recognition based on smartwatch sensor data using
lstms. Symmetry, 12:1570.
Morshed, M. G., Sultana, T., Alam, A., and Lee, Y.-K.
(2023). Human action recognition: A taxonomy-
based survey, updates, and opportunities. Sensors,
23(4).
Nisar, M. A., Shirahama, K., Li, F., Huang, X., and
Grzegorzek, M. (2020). Rank pooling approach for
wearable sensor-based ADLs recognition. Sensors,
20(12):3463.
Ord
´
o
˜
nez, F. J. and Roggen, D. (2016). Deep convolutional
and lstm recurrent neural networks for multimodal
wearable activity recognition. Sensors, 16(1).
Phyo, P. and Byun, Y. (2021). Hybrid ensemble deep
learning-based approach for time series energy predic-
tion. Symmetry, 13:1942.
Roggen, D., Calatroni, A., Nguyen-Dinh, L.-V., Chavar-
riaga, R., and Sagha, H. (2012). OPPORTUNITY
Activity Recognition. UCI Machine Learning Repos-
itory.
Roy, B., Malviya, L., Kumar, R., Mal, S., Kumar, A.,
Bhowmik, T., and Hu, J. (2023). Hybrid deep learn-
ing approach for stress detection using decomposed
eeg signals. Diagnostics, 13.
Uddin, M. Z. and Soylu, A. (2021). Human activity recog-
nition using wearable sensors, discriminant analysis,
and long short-term memory-based neural structured
learning. Scientific Reports, 11(1).
Zhang, S., Li, Y., Zhang, S., Shahabi, F., Xia, S., Deng, Y.,
and Alshurafa, N. (2022). Deep learning in human
activity recognition with wearable sensors: A review
on advances. Sensors, 22(4).
Evaluating Movement and Device-Specific DeepConvLSTM Performance in Wearable-Based Human Activity Recognition
753
