
Prediction of Kellgren-Lawrence Grade of Knee Osteoarthritis by Deep
Residual Networks Using MR Image
with Segmented Image and Slice Position
Daniele Manfredonia
1,2 a
, Seiichi Harata
2 b
, Takuto Sakuma
2 c
, Francesco Trov
`
o
1 d
and Shohei Kato
2 e
1
Dipartimento di Elettronica, Informazione e Bioingegneria, Politecnico di Milano, Milano, Italy
2
Department of Engineering, Graduate School of Engineering, Nagoya Institute of Technology, Nagoya, Japan
Keywords:
Knee Osteoarthritis (KOA), Magnetic Resonance Imaging (MRI), Kellgren Lawrence Grade (KLG), Residual
Networks, Squeeze-and-Excitation, Segmented Image, Slice Position.
Abstract:
This research explores the application of deep learning techniques, specifically employing a residual neural
network, to predict Kellgren-Lawrence grade (KLG) in osteoarthritis patients using magnetic resonance im-
ages (MRI). Taking advantage of the characteristics of images, the proposed model integrates the MRI slice
number and the use of segmented images. Unlike conventional approaches, we adopt a one-to-one image
processing strategy, so our model takes each slice individually as input and returns a prediction for each of
them to enhance the model’s ability to focus on specific slices and increase the results’ interpretability. Fur-
thermore, results on real-world data corroborate the idea that the segmented image can provide more accurate
prediction by allowing our network to focus on the crucial parts of the knee. The empirical results show the
model’s promising performance in predicting KLG, demonstrating its potential for accurate and detailed diag-
nosis of osteoarthritis. This research contributes to advancing studies on the early prediction of osteoarthritis
by proposing an effective and interpretable deep-learning framework for osteoarthritis assessment.
1 INTRODUCTION
Osteoarthritis is a debilitating joint disease that poses
a significant health challenge worldwide. It is
characterized by the degeneration of articular car-
tilage, subchondral bone changes, osteophyte for-
mation, and joint space narrowing. An accurate
and timely disease progression assessment is cru-
cial for effective clinical management. Indeed, treat-
ing knee osteoarthritis (KOA) may involve surgical
methods, e.g., osteotomy, arthroscopic interventions,
knee arthroplasty, or conservative therapies. How-
ever, surgical interventions are considered almost ex-
clusively in the case the disease is in its advanced
stage. Instead, for milder degrees of such a pathol-
ogy, it is common to prefer pharmacological and non-
pharmacological approaches Vaishya et al. (2016).
a
https://orcid.org/0009-0004-9316-553X
b
https://orcid.org/0000-0003-1644-6392
c
https://orcid.org/0000-0002-4752-5985
d
https://orcid.org/0000-0001-5796-7667
e
https://orcid.org/0000-0003-4130-2729
Among the various grading systems utilized
to evaluate osteoarthritis severity, the Kellgren-
Lawrence grade (KLG) grading system Kellgren and
Lawrence (1957) has stood the test of time as a widely
accepted and validated method. More specifically, it
consists of a four-values scale, going from the value
1 for the mildest state of osteoarthritis to the value 4
for the most severe. Traditionally, radiographic imag-
ing, particularly X-rays, has been employed to deter-
mine KLGs Ahmed and Mstafa (2022). While ef-
fective, this approach has limitations, as it provides
a static and two-dimensional view of the joint, often
missing to distinguish the subtleties of early-stage os-
teoarthritic changes Roemer et al. (2018). In recent
years, there has been a paradigm shift toward lever-
aging advanced medical imaging techniques, such
as magnetic resonance imaging (MRI), to provide a
more comprehensive and nuanced understanding of
the disease Guida et al. (2021). The use of MRI
as a substitute for X-rays is justified by its ability
to provide a more complete picture of the entire ar-
ticulation. Indeed, structural abnormalities detected
1300
Manfredonia, D., Harata, S., Sakuma, T., Trovò, F. and Kato, S.
Prediction of Kellgren-Lawrence Grade of Knee Osteoarthritis by Deep Residual Networks Using MR Image with Segmented Image and Slice Position.
DOI: 10.5220/0012471200003636
Paper published under CC license (CC BY-NC-ND 4.0)
In Proceedings of the 16th International Conference on Agents and Artificial Intelligence (ICAART 2024) - Volume 3, pages 1300-1307
ISBN: 978-989-758-680-4; ISSN: 2184-433X
Proceedings Copyright © 2024 by SCITEPRESS – Science and Technology Publications, Lda.

by MRI, such as cartilage damage, osteophytes, and
bone marrow lesions, were commonly present in the
knees of middle-aged patients without radiographic
evidence of KOA Kinds et al. (2013). Among the
MRI findings, synovitis had the most pronounced ef-
fect on knee pain and could be a therapeutic target
in patients with early KOA. So, although MRI is a
more expensive technique than X-rays, from a medi-
cal point of view, they are essential in analyzing this
problem Roemer et al. (2018).
This paper delves into the promising domain of
osteoarthritis assessment using MRI images, specif-
ically focusing on predicting KLGs. MRI offers a
unique advantage by allowing for multi-planar imag-
ing, detailed visualization of cartilage, bone, and soft
tissues, and, most importantly, the ability to capture
dynamic aspects of the joint. By harnessing the power
of deep learning techniques Goodfellow et al. (2016),
this research aims to develop a robust and accurate
predictive model that can streamline the KLG grad-
ing process, ultimately improving diagnostic preci-
sion and facilitating early interventions in osteoarthri-
tis management.
The main contributions of the paper are:
• The design of a novel approach, namely MMRI-
SE-ResNet, for predicting KLG uses the seg-
mented image and the slice number along with the
MR images as input and outputs one prediction
for each slice and aggregates the results;
• An empirical demonstration over a real-world
dataset shows that the proposed approach gives
better results than the existing baselines using
MRI to predict the KOA status of a patient.
The objective of this research is to contribute to
the advancement of non-invasive osteoarthritis assess-
ment, thus enhancing the quality of life for individuals
affected by this joint disorder.
The paper is structured as follows. In Section 2,
we review the most related works to ours. Section 3
provides the formalization of the problem of predict-
ing the OA status of patients. Section 4 describes the
proposed novel methodology and highlights the most
innovative elements designed for the analysed prob-
lem. Section 5.2 proposes a set of experiments on
real-world data and Section 6 draws conclusions and
delineates some future lines of research.
2 RELATED WORKS
The problem of diagnosing the severity of osteoarthri-
tis has been analyzed over the years by many re-
searchers. As outlined before, this has been done in
the past by using X-ray images, which are generally
already available and less expensive. Examples of this
approach can be found in the work by Shamir et al.
(2008); Antony et al. (2017). The studies present in
this line of research model the problem as a multi-
class classification and solve the problem by rely-
ing on classical supervised ML techniques. However,
the obtained results are not impressive, especially be-
cause they fail systematically to distinguish between
the 1 and 2 KLGs of the disease. This is due to the
limited information that can be extrapolated from 2D
X-ray images. Instead, Thomas et al. (2020) devel-
oped an automated model for detecting the severity of
KOA from radiographs achieving 71% accuracy and
70% average F1 score. However, this study requires a
specific standardized protocol to acquire images that
would otherwise jeopardize the results. This makes it
hard to be applied to other real-world cases.
With the advent of deep learning, new approaches
have been applied also to the estimation of KLG using
X-ray images. For instance, Chen et al. (2019) pro-
posed two deep convolutional neural networks to au-
tomatically measure the KOA severity with an ordinal
loss function that assigns larger penalties to misclas-
sification with a larger distance between the predic-
tion and the real severity of the disease. They reached
a multiclass classification accuracy of 69.7%. In the
work by Tiulpin et al. (2018) a deep Siamese CNN ar-
chitecture has been applied to predict the severity of
the OA disease using X-ray images. They exploited
the symmetry existing in the problem, i.e., the sym-
metries between the left and right knees to get an av-
erage multiclass accuracy of 66.71%.
Another line of work is the one taking as input in-
formation the MRI of the knee to segment, and find
correlations between the MRI and the KLG, without
explicitly predicting the KLG. More specifically, the
work developed by Kimura et al. (2022) uses the MRI
image to get an automatic segmentation of the differ-
ent parts of the knee. From this representation, this
work analyses the characteristics of the parts of the
knee affected by osteoarthritis, e.g., their volume, to
highlight the differences between the OA degrees of
severity. Among the other works using MRI for OA
analysis, we cite the work by Harada et al. (2011),
who tried to find the correlation between cartilage vol-
ume and KLG, and Schiratti et al. (2021), who imple-
mented a deep learning method to predict, from MR
images and clinical variables including body mass in-
dex, further cartilage degradation measured by joint
space narrowing at 12 months. However, this last
work cannot be applied as a baseline diagnostic tool
since it makes use of longitudinal data.
Finally, the work by Guida et al. (2021) is the first,
Prediction of Kellgren-Lawrence Grade of Knee Osteoarthritis by Deep Residual Networks Using MR Image with Segmented Image and
Slice Position
1301
to the best of our knowledge, to use a 3D convolu-
tional neural network that combines the information
about MRI to classify osteoarthritis severity degree
by taking into account all the slices simultaneously
reaching the 83% of accuracy in a binary classifica-
tion setting using a dataset of 1100 patients. We will
compare this work with ours in the experimental part
to evaluate its performance in our specific scenario.
3 PROBLEM FORMULATION
3.1 Evaluating Osteoarthritis
We will focus on analyzing how the classification
problem can be tackled from already segmented im-
ages. For this purpose, we will make use of the classi-
fication system proposed by Kellgren and Lawrence,
which is now widely used and considered a standard
in the literature, e.g., Mohammed et al. (2023). This
metric is prescribed to rank the severity of patients
according to an integer numerical value, described as
follows Kohn et al. (2016):
• Grade 0 (none): absence of radiographic changes
of osteoarthritis;
• Grade 1 (doubtful): doubtful joint space narrow-
ing and possible osteophytic lipping;
• Grade 2 (minimal): osteophytes and possible joint
space narrowing;
• Grade 3 (moderate): multiple moderate osteo-
phytes, definite joint space narrowing, sclerosis,
and possible deformity of bony extremities;
• Grade 4 (severe): large osteophytes, marked joint
space narrowing, severe sclerosis and definite de-
formity of the bony ends.
It is worth mentioning that patients with grades
equal to or larger than 2 are commonly required to
proceed with further analyses and controls. This im-
plies that the most crucial patients to discriminate
against are those with disease grades 0 or 1 versus 2
or larger grades. Indeed, an incorrect prediction may
lead to an unnecessary further control (patients with
grade 0 or 1 classified as 2 and above) or suggest no
control to patients having the disease (patients with
grade 2 and above classified as 0 or 1). Therefore,
the patients can be naturally divided into two classes,
which will be formally defined later in the paper.
3.2 Data-Driven Estimation
The problem we will analyze is a classic problem
of supervised learning and, in particular, classifica-
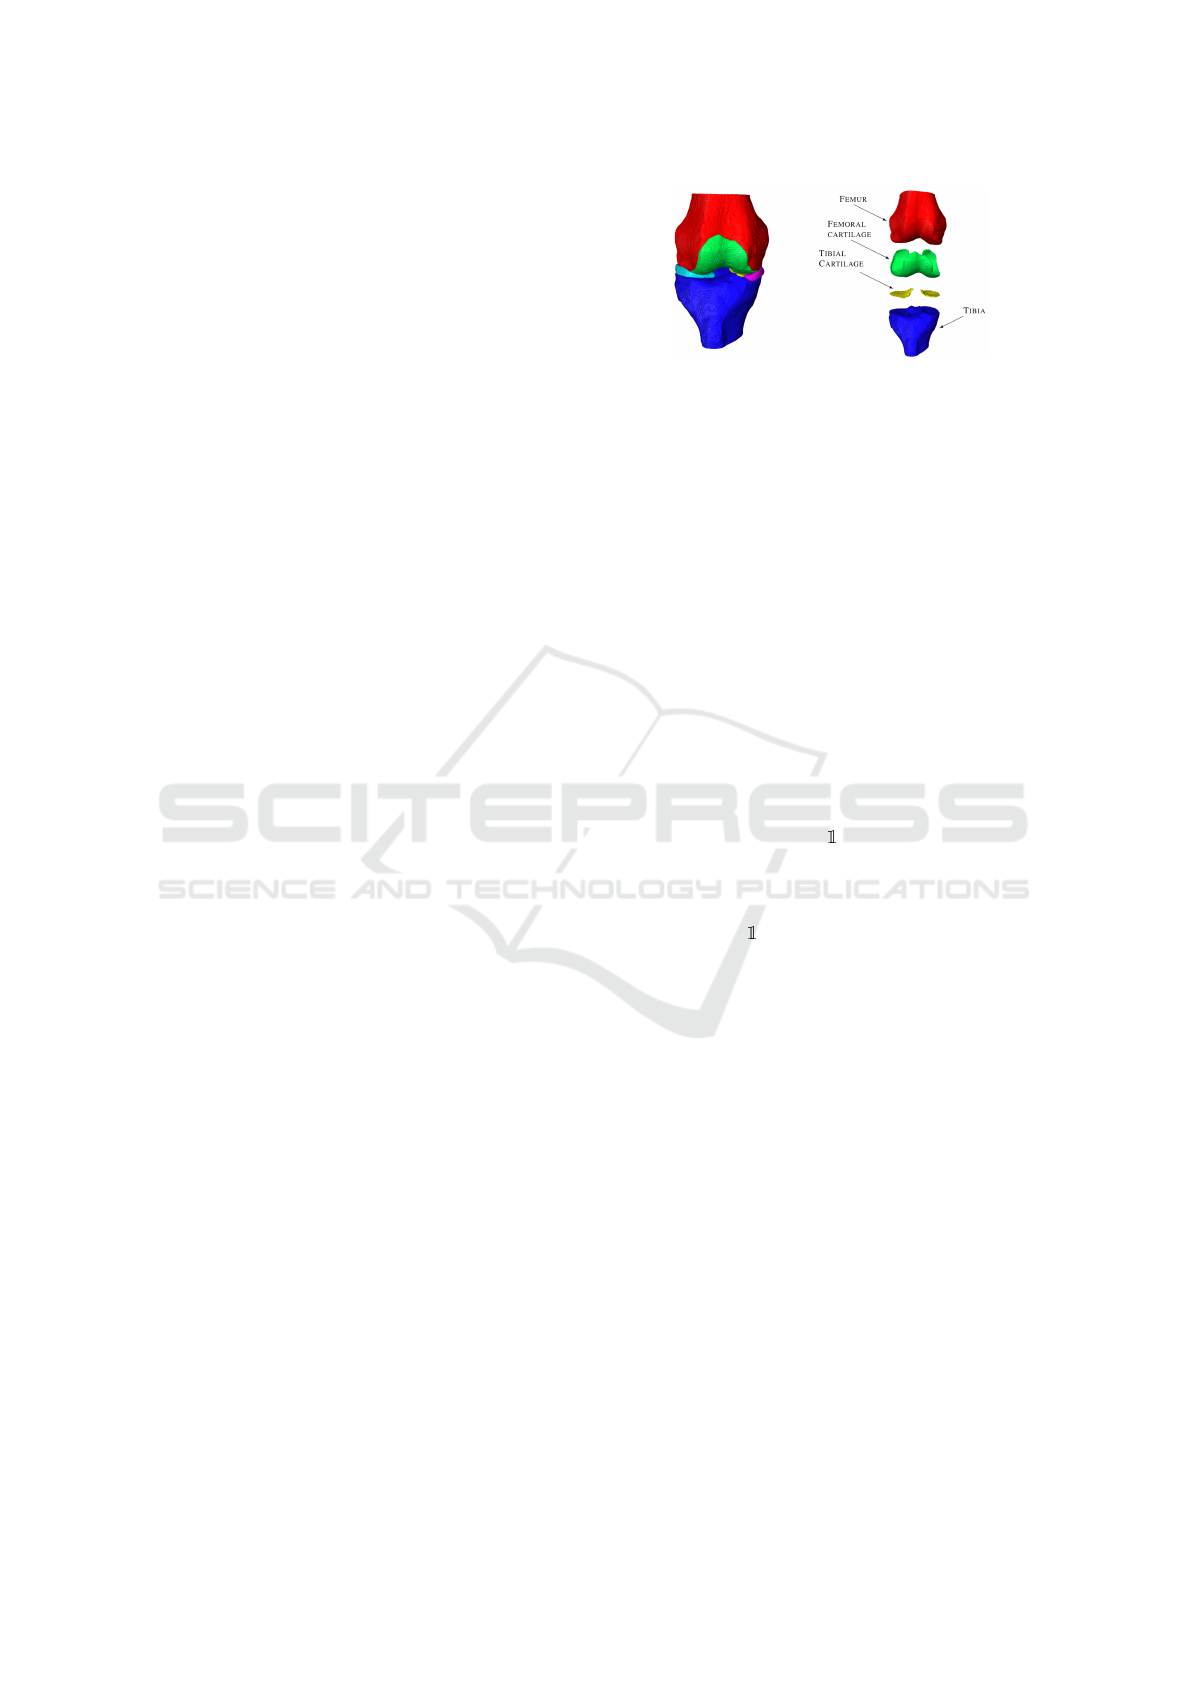
Figure 1: Example of segmentation of the knee. Adapted
from Tack et al. (2021).
tion. We assume to have a dataset {X
i
}
N
i=1
of N
MRI scans X
i
, where each scan is represented as a
sequence X
i
= [X
i,1
, . . . X
i,S
] of S slices. Each slice
X
i,s
∈ {0, . . . 255}
D×D
for s ∈ [1, S], is a raw image,
i.e., an 8-bit grayscale images of size D whose pixels
takes value from 0 to 255.
For each MRI scan, we are given as a correspond-
ing target y
i
∈ {0, 1} the absence or presence of the
disease, i.e., a binary classification problem. In this
case, values 0 and 1 for the KLGs correspond to a neg-
ative outcome of the examination, and instead, larger
values, i.e., 2 to 4 grades, represent a positive out-
come. The goal of our approach is, given a new MRI
scan X, to provide a prediction of the class corre-
sponding to the low and high KLGs ˆy
i
(1 for the pres-
ence of OA and 0 otherwise) for input X
i
that maxi-
mizes the accuracy over the entire learning space:
max
ˆy∈Y
E
X,y
{y = ˆy},
where Y is an appropriate hypothesis space, the ex-
pected value is taken over the joint distribution of the
pairs (X, y) and {·} is the indicator function.
4 PROPOSED APPROACH
4.1 Input of the Model
Let us define first the segmentation Z
i,s
of an MRI
slice X
i,s
that will be used for the definition of the in-
put of our model. Formally, the segmentation Z
i,s
∈
{0, . . . , C − 1}
D×D
, with C = 4 represents a mask of
the original MRI slice X
i,s
. In the matrix Z
i,s
, each
element indicates the specific knee element to which
the corresponding element in X
i,s
is associated. More
specifically, the correspondence of the numbers with
different elements of the segmentation is the follow-
ing: 0 background, 1 femur, 2 femoral cartilage, 3
tibia, and 4 tibial cartilage. An example of the seg-
mented elements on the knee is presented in Figure 1.
The final proposed model uses a tuple (X
i,s
, Z
i,s
, s)
as input, i.e., a combination of the raw image X
i,s
, seg-
mented image Z
i,s
, and slice number s. Our model
ICAART 2024 - 16th International Conference on Agents and Artificial Intelligence
1302
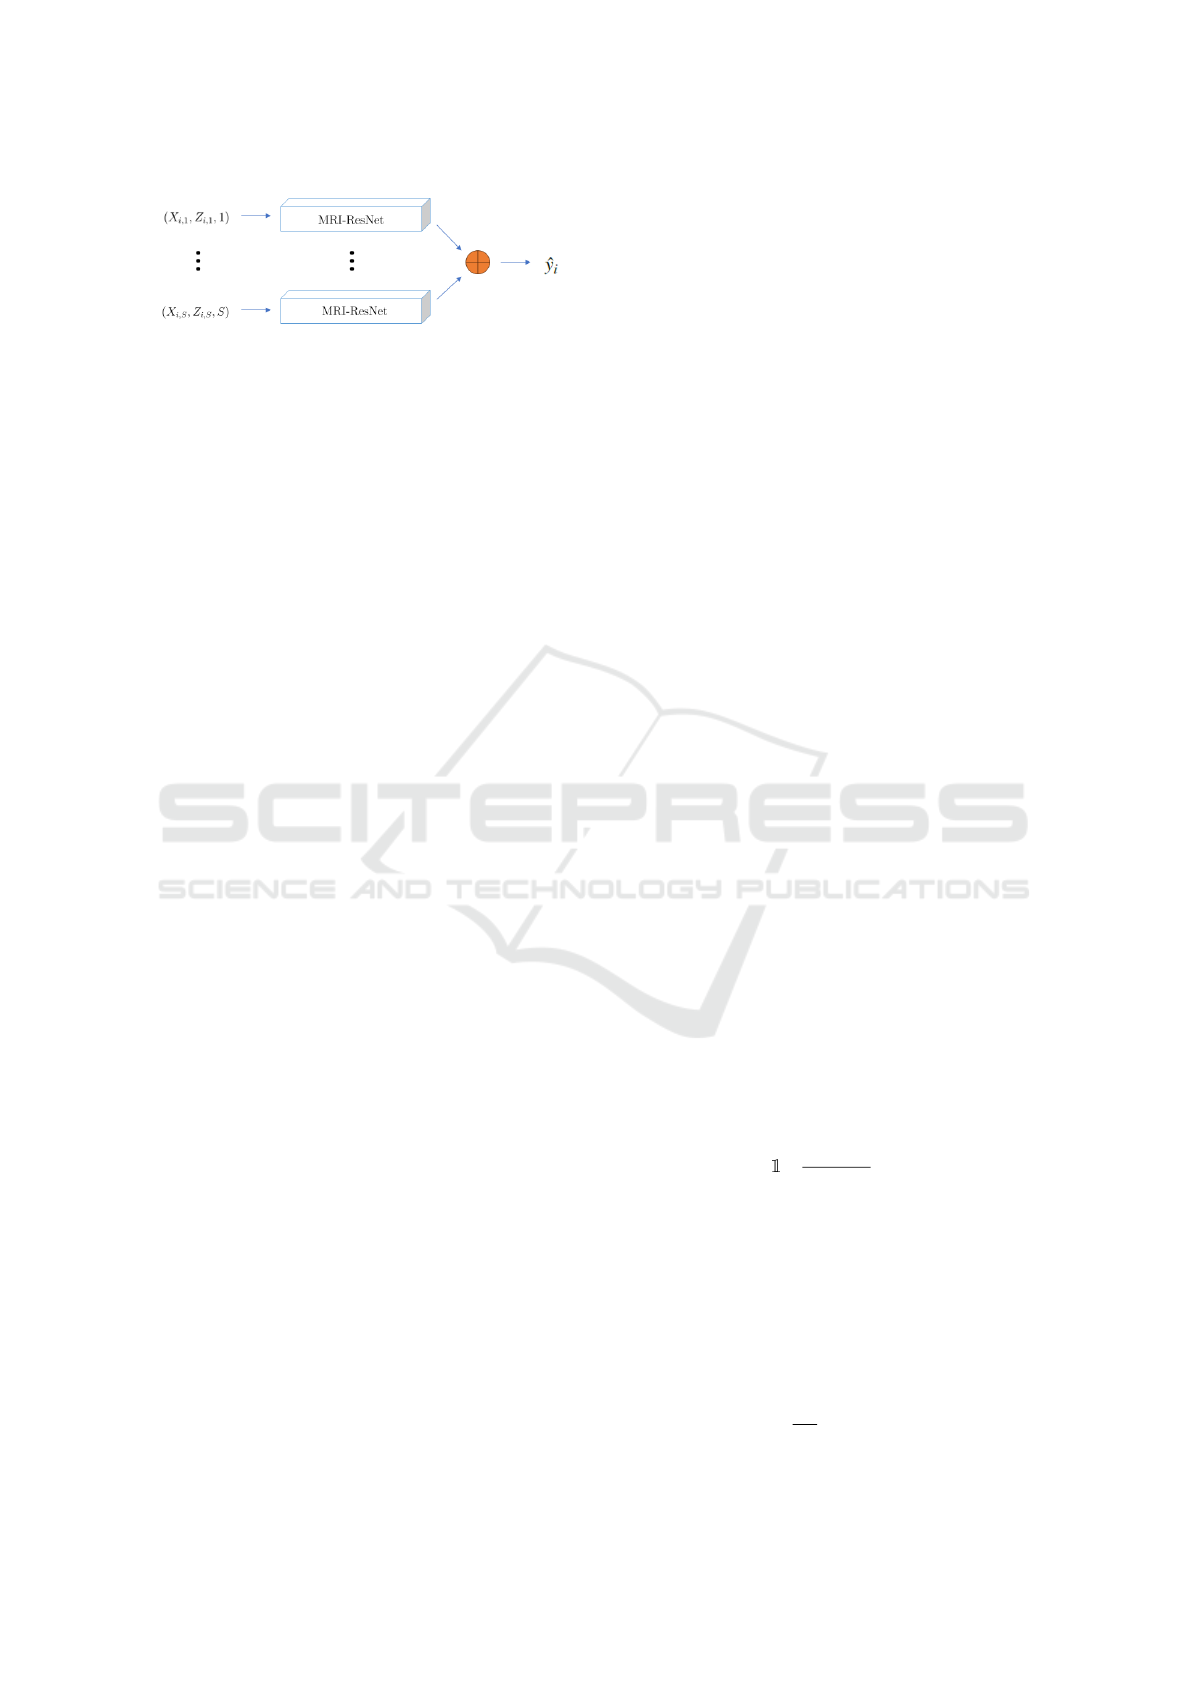
Figure 2: MMRI-ResNet overview.
wants to show how the combination of the segmented
image and the slice number can significantly increase
prediction accuracy for the OA state ˆy
i
for the anal-
ysed problem. A visual representation of the network,
whose details will be described in the following, is
presented in Figure 2.
We remark that differently from the previously
designed methods for evaluating the KLG, in this
work, we are treating each slide independently from
each other. This is in contrast with previous ap-
proaches that provide a single prediction per patient,
e.g., Guida et al. (2021) in which they used a 3D con-
volutional neural network to process the MRI. In our
model, the final outcome for a patient is provided by
integrating all the information provided by the differ-
ent slices (details are provided below).
4.2 The MMRI-ResNet
For capturing the difference between slice positions,
we propose to use a Squeeze and Excitation net-
work (Hu et al., 2018) (SE-ResNet) to capture the re-
lationship between the various feature channels and
to allow injecting the information of slice position s
and add a fusion mechanism to provide a single out-
come per patient. This architecture has been chosen
due to the fact that the original formulation of this
network has shown excellent performance in generic
image recognition tasks in the past Russakovsky et al.
(2015). From now on, we will refer to the newly de-
fined network as Multi MRI SE-ResNet (MMRI-Se-
ResNet), an architecture that will make use of S differ-
ent networks that are specifically crafted to deal with
the MRI images working in parallel. Figure 2 pro-
vides a visual representation of MMRI-Se-ResNet.
In the following, we review the models we de-
sign and highlight the significant contribution that has
been introduced to SE-ResNet. As shown in Fig-
ure 3, our version of the SE-ResNet, namely the MRI-
ResNet starts using a 2D convolution of the original
MRI slice, and this operation is followed by a se-
quence of blocks denoted as R
′
. These blocks are
copies of a modified version of the Residual block
originally used in the ResNet. The output from this
block sequence is subsequently fed into an average
pooling layer and subsequently into a linear layer.
Since the R
′
blocks have a crucial role in our net-
work and represent the element that has been modified
from the ones used in the original SE-ResNet, we pro-
vide a detailed description of its elements. Moreover,
we divide its flow into two parts: the former which is
in common with the residual block in the SE-ResNet,
and the latter which has information about the slice
number plugged. Specifically, the first part is com-
posed as follows:
• 2D batch normalization layer;
• Dropout layer;
• 2D convolutional layer;
• 2D batch normalization layer;
• Leaky ReLU as activation function;
• 2D convolutional layer;
• Leaky ReLU as activation function.
Instead, the second part, shown in Figure 4, is com-
posed as follows:
• global average pooling;
• linear layer to which an input feature correspond-
ing to our slice number is concatenated;
• Leaky ReLU activation function;
• linear layer to which an input feature correspond-
ing to our slice number is concatenated;
• Sigmoid activation function.
The final output consists of a scaled version of the
original input, where the scaling factor is determined
by the second element of the residual block (right flow
in Figure 4).
The final return of the network model provides,
for each slice, the probability ˆp
i,s
that this slice does
or does not belong to a patient with OA. So, in the end,
the number of predictions equals the number of slices
we took as input. The final prediction is obtained by
averaging these probabilities and applying a threshold
of τ = 0.5, formally:
ˆy
i
=
∑
S
s=1
ˆp
i,s
S
≥ τ
. (1)
This method was preferred to majority voting because
it considers not only the fact of having classified a
slice positively or negatively but also the degree of
confidence with which it did so.
The objective of our model is to minimize the bi-
nary cross-entropy loss function L
BCE
with weighted
loss due to an unbalanced dataset. Formally, the loss
is defined as follows:
L
BCE
= −
1
NS
N
∑
i=1
S
∑
s=1
w
y
i
· l
BCE
i,s
, (2)
Prediction of Kellgren-Lawrence Grade of Knee Osteoarthritis by Deep Residual Networks Using MR Image with Segmented Image and
Slice Position
1303
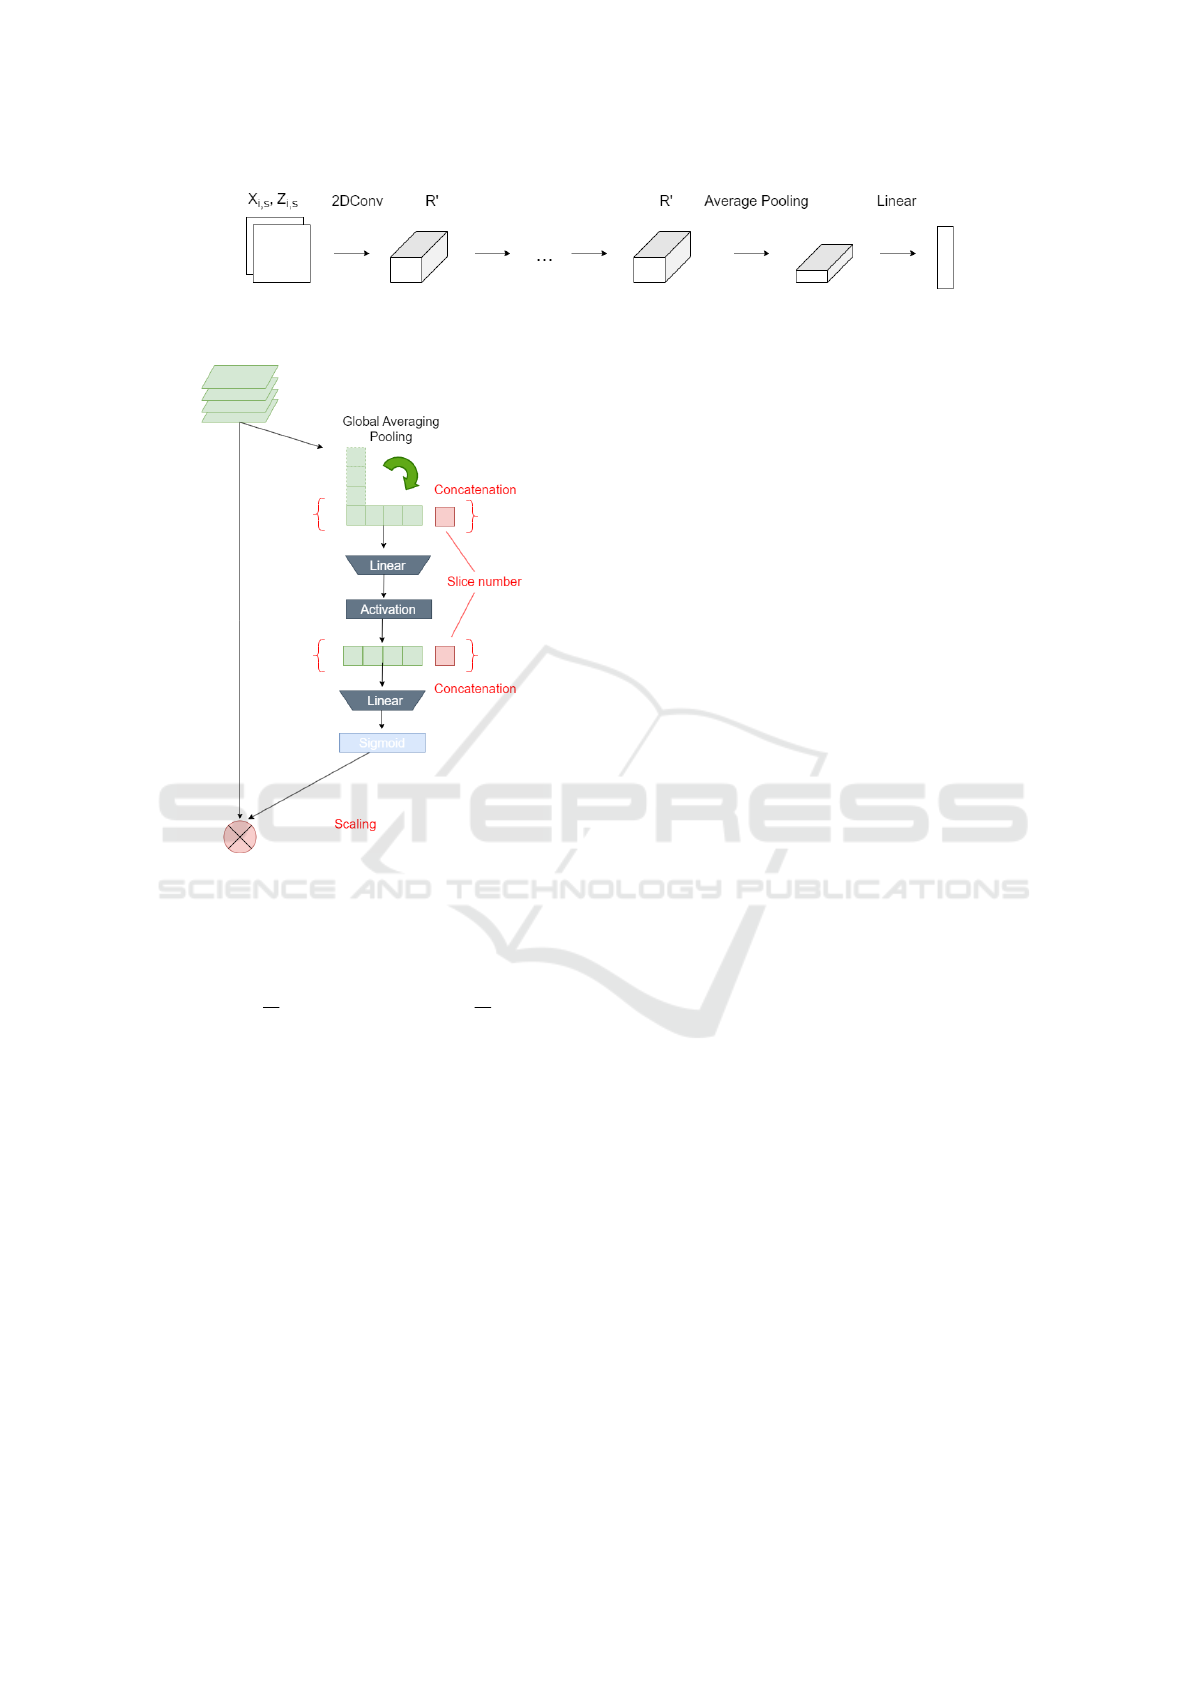
Figure 3: MRI-SE-ResNet network overview.
Figure 4: Visual representation of the second part of the R
′
block. The modifications introduced in this work are high-
lighted in red.
where the cross-entropy loss for a single image is
l
BCE
i,s
:= y
i
· ln ˆp
i,s
+ (1 − y
i
) · ln(1 − ˆp
i,s
)), the weights
are w
y
i
= 1 −
N
0
N
1
if y
i
= 0, and w
y
i
=1
=
N
0
N
1
if y
i
= 1,
and N
0
and N
1
are the number of occurrences for the
negative class and the positive class, respectively. The
use of the weights as defined above is a common tool
to deal with unbalanced classes (Wang et al. (2020)).
We remark that our proposal is based on a two-
step prediction that allows greater interpretability of
the results. Indeed, we have information about the
contribution that each slice provides to the final out-
come in the probability of the slice ˆp
i,s
. This makes it
easier to understand which parts one should focus on
most when deciding the treatment. Our model offers
a notable advantage w.r.t. the X-rays-based ones that
do not provide information on the most relevant areas
that determined the outcome. In general, in medical
engineering, interpretability is preferred over simplis-
tic black-box models that merely process inputs and
outputs without any explanatory capability.
5 EXPERIMENTS
In the following, we applied the proposed methodol-
ogy to a real-world dataset of OA patients and com-
pared its performance with some baseline methods.
Moreover, we also show how the different elements of
the proposed approach impact the final performances.
5.1 Dataset
The Osteoarthritis Initiative (OAI) Nevitt et al.
(2006); Ambellan et al. (2019) provided the dataset
we worked on. It consists of 507 patients with or at
risk of KOA. From the initial dataset, only N = 479
patients were analyzed since the remaining ones do
not have information about the KLG. Each MRI con-
sists of 160 slices, each having dimension 384 × 384.
The corresponding segmented images Z
i,s
were ob-
tained by manual segmentation performed by experts
in the field of radiomics.
Before feeding the data to the model we applied
some pre-processing steps. First, following the sug-
gestions provided in Guida et al. (2021), it was de-
cided to exclude the slices with indexes in {0, . . . , 9}∪
{70, . . . , 89} ∪ {150, . . . 159}. Indeed, these slices
very often consist of a completely dark background,
thus not providing any meaningful information to the
model. Therefore the final input had S = 120. More-
over, due to the fact that MRI scans are generally per-
formed on large areas, each scan has been cropped to
the central area resulting in a slice with D = 224.
5.2 Experimental Settings
We compared our method MMRI-SE-ResNet with
some baselines present in the literature and some vari-
ations of MMRI-SE-ResNet, to highlight each ele-
ment of our proposal. More specifically, we compared
the proposed MMRI-SE-ResNet with:
• 3D Conv by Guida et al. (2021), which uses as
input all MRI-related slices and returns as output
the outcome of the test;
• SE-ResNet by Hu et al. (2018), the network from
which we started to develop our model;
• MMRI-SE-ResNet-S, a version of MMRI-SE-
ResNet making use only of the original image and
ICAART 2024 - 16th International Conference on Agents and Artificial Intelligence
1304
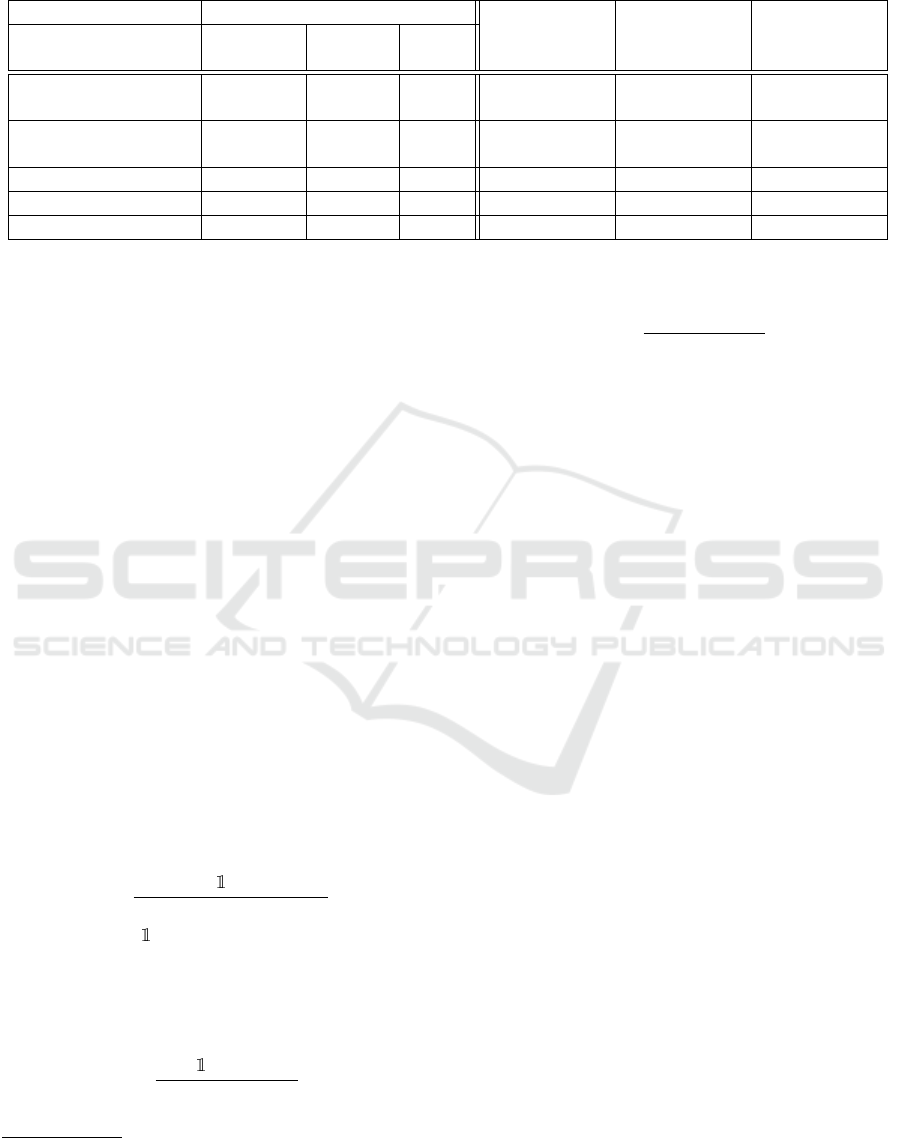
Table 1: Evaluation metrics overview for binary classification of KLG. The proposed model is the best for the evaluation
metrics analyzed. 95% confidence intervals are provided in square brackets.
Model Characteristics
b
sa
b
a
c
F1
Per-slice
prediction
Uses Z
i,s
Uses s
3D Conv
(Guida et al., 2021)
- - - - 62.94 [±5.65] 55.36 [±7.99]
SE-ResNet
(Hu et al., 2018)
◦ - - 63.97 [±2.54] 71.29 [±2.58] 69.41 [±3.07]
MMRI-SE-ResNet-S ◦ - ◦ 65.10 [±1.82 68.71 [±3.90] 64.54 [±5.05]
MMRI-SE-ResNet-Z ◦ ◦ - 69.07 [±3.48] 76.78 [±1.29] 74.86 [±1.99]
MMRI-SE-ResNet
◦ ◦ ◦ 70.14 [±1.25] 78.39 [±3.32] 76.45 [±3.10]
the slice number as input, i.e., requiring as input
the tuple (X
i,s
, s);
• MMRI-SE-ResNet-Z, a version of MMRI-SE-
ResNet making use only of the raw and segmented
MRI, i.e., using the tuple (X
i,s
, Z
i,s
) as input.
Notice that the last three methods will share the struc-
ture of the network (i.e., the layers number, dimen-
sion, and topology) except for the required input.
Training for the 3D Conv has been conducted using
the parameters suggested in Guida et al. (2021) for
training. Conversely, the other methods have been
trained using the Adam optimizer with default param-
eters, a learning rate of 0.001, a batch size of 256, and
a number of epochs of 75. We applied dropout with
a rate of 0.25 and early stopping with the patience of
five epochs to prevent overfitting. The models have
been optimized in terms of the 3D and 2D convolu-
tional layer size. The choice of the final sizes has been
done using a 5-fold cross-validation approach.
1
The performance metrics to compare the different
methods we evaluated are the following:
• ˆsa per-slice accuracy percentage (when available),
which has been obtained by comparing the binary
value returned for each individual slice with the
one of the patient and averaging over all slides:
b
sa :=
∑
N
i=1
∑
S
s=1
{
ˆy
i,s
== y
i
}
SN
· 100,
where ˆy
i,s
:=
{
ˆp
i,s
≥ τ
}
are the predictions pro-
vided by a specific method for slice s and y
i
is the
patient KLG true value;
•
b
a accuracy, the average accuracy percentage we
get for the methods, formally:
ˆa :=
∑
N
i=1
{
ˆy
i
== y
i
}
N
· 100,
where ˆy
i
is the prediction for a specific patient;
1
For further details and for an implementation of the
above methods, see the code repository at https://github.c
om/danimanfre/MMRI-SE-ResNet.git.
•
c
F1 macro F1 score percentage, formally:
c
F1 :=
c
F1
y=0
+
c
F1
y=1
2
· 100,
where
c
F1
y=0
and
c
F1
y=1
are the empirical F1
scores (Taha and Hanbury, 2015) for the positive
and negative classes, respectively.
We test our model using a hold-out approach. 70%
of the samples were used for training, 20% for val-
idation, and 10% for testing. The experiments have
been repeated 5 times using a random split between
the three sets. The 95% confidence intervals for the
measured performances have been reported in the re-
sults in square brackets.
5.3 Results
Table 1 shows the performances of the different meth-
ods and their characteristics. Our approach signifi-
cantly outperforms the baseline ones in terms of ac-
curacy
b
a and macro F1 score
c
F1. In particular, it is
able to provide an increased accuracy of ≈ 15% and
≈ 7% w.r.t. 3D Conv and Se-ResNet, respectively.
Similar improvements are provided in terms of macro
F1 score (≈ 21% and ≈ 7%, respectively).
The MMRI-Se-ResNet-S and MMRI-Se-ResNet-
Z models provide intermediate results between the
baselines and the MMRI-Se-ResNet in terms of per-
slice accuracy
b
sa and accuracy
b
a. However, the use
of the segmentation seems to provide a larger im-
provement than the one given by the slice number.
Conversely, if we look at the macro F1 score, using
MMRI-Se-ResNet-S reduces the score w.r.t. the orig-
inal SE-ResNet, from 69.41% to 64.54% on average.
Instead, the introduction of the information about the
segmentation provided in MMRI-Se-ResNet-Z signif-
icantly improves the macro F1 score of the method.
Finally, using both modifications (i.e., using the slice
number and the segmentation ) to the network results
in being the best choice.
Prediction of Kellgren-Lawrence Grade of Knee Osteoarthritis by Deep Residual Networks Using MR Image with Segmented Image and
Slice Position
1305

5.4 Testing the Significance of the MRI
Based on the previous results, we want to analyse
if the different slices coming from multiple areas of
the knee provide significantly different information to
the MMRI-ResNet method. To do that we trained
two models: one using data corresponding to slices
X
i,s
with s ∈ {20, . . . 70} ∪ {100, . . . 140}, and one us-
ing the data X
i,s
with s ∈ {10, . . . 60} ∪ {110, . . . 150}.
We tested such models to predict the outcome y
i
on
slides coming from s ∈ {90, 99}. The results provide
a per-slide accuracy of 70.1%, and 43.5%, respec-
tively. This shows how the information of a model
using slices that are closer to the test set is more sig-
nificant than those of the model trained on slides that
are not close to the test. Therefore, we need to include
all the information about the different slides in our
model to have a general picture of the phenomenon.
5.5 Discussion
Table 1 shows that segmented images significantly
improve KLG prediction. We believe that including
this input is crucial in our setting. Indeed, this allows
the network to focus only on those areas that are the
most significant to estimate the OA degree.
Let us compare the methods using per-slice pre-
diction and 3D Conv. The results suggest that the
ability to have separate predictions for each slide im-
proves significantly the accuracy of the overall patient
status. This strengthens the idea that the per-slice ap-
proach is valid in this setting. This phenomenon is
especially true in settings in which the data are as
scarce. Indeed, as reported by Guida et al. (2021), 3D
Conv achieved 83% accuracy using a larger cohort of
1100 patients, but, the accuracy decreased to 62.94%
in our setting (479 patients).
Finally, we remark that in a medical setting, the
macro F1 score indicates that models are effective
at correctly identifying positive instances (high re-
call) and minimizing the number of false positives
(high precision). In our case, the proposed MMRI-
ResNet model provides an improvement on average
of such an index of 1.59% w.r.t. the other analysed
models. Therefore, it suggests that our method is a
good choice when an automatic prediction is required.
6 CONCLUSIONS
In this paper we propose a novel architecture to solve
the problem of predicting the presence of OA in knees
using MRI scans. The resulting neural network-based
model, namely MMRI-SE-ResNet, has been designed
on the basis of an existing architecture, i.e., SE-
ResNet, by including information about the segmen-
tation of the knee extending the network architecture.
The application of the above-mentioned method on a
real-world dataset provided an overall prediction ac-
curacy of 78.39% and a macro F1 score of 76.45, out-
performing the existing method present in the litera-
ture. In general, the idea of processing the slices in-
dividually obtains better results than an approach that
considers all the slices simultaneously.
The contribution of using the segmented image
is significant in the prediction. Moreover, the use
of slice numbers, which indicate the position of the
slice in the knee, in combination with the segmenta-
tion provides a marginal improvement.
There are several works that we aim to pursue.
Currently, the predictions of each slice are averaged to
generate the final prediction, however, they might be
of different interest depending on the specific pathol-
ogy of the patient. This is usually supported by some
a priori medical evidence, that could be exploited to
focus more on some specific slides, e.g., modifying
the weighting scheme using such information.
Using standardized images from OAI introduces
biases due to consistent positioning and focus. This
may lead to a lack of variation in patient presenta-
tion, potential overfitting to specific protocols, and
challenges in generalizing to diverse clinical scenar-
ios. To address these limitations another interesting
study would use external validation over data coming
from different clinical centers to validate the results
we got in this study. At the same time, using those
data as a training source would allow us to assess the
limit of the method when applied to larger datasets.
Similar techniques could be applied also to distin-
guish the 5 KLGs, by considering a multiclass clas-
sification problem. An interesting development could
extend our architecture for this setting.
Finally, the developed model is promising for ef-
fective application in the diagnosis and prediction of
OA in different parts of the body, e.g., hands Hau-
gen and Bøyesen (2011). This is possible due to the
similarities in the scoring systems for both knee and
hand joints, and the compatibility of MRI acquisition
techniques.
ACKNOWLEDGEMENTS
This work was supported in part by JSPS KAKENHI
under grant #JP19H01137 and #JP20H04018, and
part by the commissioned research by National Insti-
tute of Information and Communications Technology
(NICT), JAPAN.
ICAART 2024 - 16th International Conference on Agents and Artificial Intelligence
1306

REFERENCES
Ahmed, S. M. and Mstafa, R. J. (2022). Identifying severity
grading of knee osteoarthritis from x-ray images us-
ing an efficient mixture of deep learning and machine
learning models. Diagnostics, 12(12):2939.
Ambellan, F., Tack, A., Ehlke, M., and Zachow, S. (2019).
Automated segmentation of knee bone and cartilage
combining statistical shape knowledge and convolu-
tional neural networks: Data from the osteoarthritis
initiative. Medical Image Analysis, 52:109–118.
Antony, J., McGuinness, K., Moran, K., and O’Connor,
N. E. (2017). Automatic detection of knee joints
and quantification of knee osteoarthritis severity using
convolutional neural networks. International Confer-
ence on Machine Learning and Data Mining.
Chen, P., Gao, L., Shi, X., Allen, K., and Yang, L. (2019).
Fully automatic knee osteoarthritis severity grading
using deep neural networks with a novel ordinal loss.
Computerized Medical Imaging and Graphics, 75:84–
92.
Goodfellow, I., Bengio, Y., and Courville, A. (2016). Deep
learning. MIT press.
Guida, C., Zhang, M., and Shan, J. (2021). Knee os-
teoarthritis classification using 3d cnn and mri. Ap-
plied Sciences, 11(11):5196.
Harada, Y., Osamu Tokuda, K. F., Shiraishi, G., Motomura,
T., Kimura, M., and Matsunaga, N. (2011). Relation-
ship between cartilage volume using mri and kellgren-
lawrence radiographic score in knee osteoarthritis
with and without meniscal tears. American Journal
of Roentgenology.
Haugen, I. K. and Bøyesen, P. (2011). Imaging modalities
in hand osteoarthritis-status and perspectives of con-
ventional radiography, magnetic resonance imaging,
and ultrasonography. Arthritis research & therapy,
13(6):1–8.
Hu, J., Shen, L., and Sun, G. (2018). Squeeze-and-
excitation networks. In Proceedings of the IEEE con-
ference on computer vision and pattern recognition,
pages 7132–7141.
Kellgren, J. H. and Lawrence, J. (1957). Radiological as-
sessment of osteo-arthrosis. Annals of the rheumatic
diseases, 16(4):494.
Kimura, W., Sakuma, T., and Kato, S. (2022). Segmentation
of cartilage regions in knee osteoarthritis mr images
using transunet. International Conference on Knowl-
edge Information and Creativity Support Systems.
Kinds, M. B., Marijnissen, A. C., Bijlsma, J. W., Boers, M.,
Lafeber, F. P., and Welsing, P. M. (2013). Quantita-
tive radiographic features of early knee osteoarthritis:
development over 5 years and relationship with symp-
toms in the check cohort. The Journal of rheumatol-
ogy, 40(1):58–65.
Kohn, M. D., Sassoon, A. A., and Fernando, N. D. (2016).
Classifications in brief: Kellgren-lawrence classifica-
tion of osteoarthritis. Clinical Orthopaedics and Re-
lated Research, 474:1886–1893.
Mohammed, A. S., Hasanaath, A. A., Latif, G., and Bashar,
A. (2023). Knee osteoarthritis detection and severity
classification using residual neural networks on pre-
processed x-ray images. Diagnostics, 13(8):1380.
Nevitt, M., Felson, D., and Lester, G. (2006). The os-
teoarthritis initiative. Protocol for the cohort study,
1.
Roemer, F. W., Kwoh, C. K., Hayashi, D., Felson, D. T., and
Guermazi, A. (2018). The role of radiography and mri
for eligibility assessment in dmoad trials of knee oa.
Nature Reviews Rheumatology, 14(6):372–380.
Russakovsky, O., Deng, J., Su, H., Krause, J., Satheesh, S.,
Ma, S., Huang, Z., Karpathy, A., Khosla, A., Bern-
stein, M., Berg, A. C., and Fei-Fei, L. (2015). Ima-
geNet Large Scale Visual Recognition Challenge. In-
ternational Journal of Computer Vision, 115(3):211–
252.
Schiratti, J.-B., Dubois, R., Herent, P., Cahan
´
e, D., Dachary,
J., Clozel, T., Wainrib, G., Keime-Guibert, F., La-
lande, A., Pueyo, M., Guillier, R., Gabarroca, C., and
Moingeon, P. (2021). A deep learning method for pre-
dicting knee osteoarthritis radiographic progression
from mri. Arthritis Research & Therapy, 23(1):262.
Shamir, L., Ling, S. M., Scott, W. W., Bos, A., Orlov, N.,
Macura, T. J., Eckley, D. M., Ferrucci, L., and Gold-
berg, I. G. (2008). Knee x-ray image analysis method
for automated detection of osteoarthritis. IEEE Trans-
actions on Biomedical Engineering, 56(2):407–415.
Tack, A., Ambellan, F., and Zachow, S. (2021). Towards
novel osteoarthritis biomarkers: Multi-criteria evalua-
tion of 46,996 segmented knee mri data from the os-
teoarthritis initiative. PloS one, 16(10):e0258855.
Taha, A. A. and Hanbury, A. (2015). Metrics for evaluating
3d medical image segmentation: analysis, selection,
and tool. BMC medical imaging, 15(1):1–28.
Thomas, K. A., Łukasz Kidzi
´
nski, Halilaj, E., Fleming,
S. L., Venkataraman, G. R., Oei, E. H. G., Gold, G. E.,
and Delp, S. L. (2020). Automated classification of
radiographic knee osteoarthritis severity using deep
neural networks. Radiology: Artificial Intelligence,
2(2):e190065.
Tiulpin, A., Thevenot, J., Rahtu, E., Lehenkari, P., and
Saarakkala, S. (2018). Automatic knee osteoarthri-
tis diagnosis from plain radiographs: a deep learning-
based approach. Scientific reports, 8(1):1727.
Vaishya, R., Pariyo, G. B., Agarwal, A. K., and Vijay, V.
(2016). Non-operative management of osteoarthritis
of the knee joint. Journal of clinical orthopaedics and
trauma, 7(3):170–176.
Wang, C., Deng, C., and Wang, S. (2020). Imbalance-
xgboost: leveraging weighted and focal losses for
binary label-imbalanced classification with xgboost.
Pattern Recognition Letters, 136:190–197.
Prediction of Kellgren-Lawrence Grade of Knee Osteoarthritis by Deep Residual Networks Using MR Image with Segmented Image and
Slice Position
1307
