
A Tool for 3D Representation of the 2D Thermographic Breast
Acquisitions
Eudoxia L. S. Moura
1,3 a
, Gleidson M. Costa
2 b
, Tiago B. Borchartt
2 c
and Aura Conci
3 d
1
Federal Institute of Education, Science and Technology of Rond
ˆ
onia, Ariquemes, Brazil
2
Department of Informatics, Federal University of Maranh
˜
ao, Brazil
3
Institute of Computing, Federal Fluminense University, Brazil
Keywords:
3D Breast Models, Thermography Images, Edge Detection.
Abstract:
This study enhances the three-dimensional reconstruction of the breast surface from two-dimensional thermal
images at five different angles. The process involves the use of a convolutional neural network U-net for image
segmentation, extraction of relevant points and curves, geometric transformations to add a dimension to the
curves, and modeling with Rational Non-uniform B-splines Surface (NURBS). The work aims to improve the
previously proposed algorithm by making modifications to the rotation points and cutting regions to achieve a
more comprehensive breast contour. In a quantitative evaluation of the results, comparing thermal images and
Structured Light Scanner images with the Costa’s and new algorithm, we observed that, concerning scanning,
the Costa’s algorithm has an average of 37.07% with a standard deviation of 6.27, while the new algorithm
exhibits an average of 14.06% with a standard deviation of 7.28. When compared to thermal images, the
Costa’s algorithm has an average of 37.47% with a standard deviation of 7.24, whereas the new algorithm
shows an average of 14.77% with a standard deviation of 7.37. These results indicate that the new algorithm
significantly improves the representation of the breast shape compared to the Costa’s algorithm.
1 INTRODUCTION
Breast cancer is the most common type of cancer
among women and the second most death related
(Bray et al., 2018). With an early diagnosis and
proper treatment in the beginning, it can be curable
(Venkataramani et al., 2015; Koay et al., 2004). There
are many possible exams to detect a breast cancer, but
the mammography is the most popular (Otmani et al.,
2024). Besides being an invasive exam, it is consid-
ered the gold standard (Koay et al., 2004).
The thermography is a non-invasive exam that
analyses the heat distribution over the body (breast
region in this case) (Pricigalli et al., 2023). It is acces-
sible, fast, propitiates very early detection due to the
possibility of detection of the beginning of the huge
cellular multiplication of the cancerous are and its the
usage on dense breast for young woman observations
(Lanisa et al., 2014; Jockers, 2019).An abnormal heat
a
https://orcid.org/0000-0003-1911-1555
b
https://orcid.org/0009-0006-0429-6074
c
https://orcid.org/0000-0002-3709-8385
d
https://orcid.org/0000-0003-0782-2501
distribution on the images can be related to the cancer
formation, as long as it can increase the metabolism
of the area. But computational tools are necessary to
help specialists on decision about whereas there is a
benign or malignant nodule in a mamothermograpy
examination (Borchartt, 2013).
The diagnosis of thermography exams is made
by analyzing the captured images looking for abnor-
mal features. (Raghavan et al., 2023). Thermogra-
phy images follows the protocol proposed by (Silva
et al., 2014) using static and dynamic data acquisi-
tions. Twenty images are captured after cooling the
patient while the person body surface is returning to
the environmental temperature (natural warm) in the
dynamic data acquisition protocol. Moreover, only
five images are taken by using the static protocol.
However, static acquisitions are taken positioning
the patient in five different angle in relation to the
camera frontal direction position. In order to have a
good observation of the breast the angles between the
coronal body frontal plane and the camera must be 0
o
,
+45
o
, -45
o
, 90
o
and -90
o
. These directions form the
named frontal view (0
o
), positive and negative oblique
views and positive and negative side (90
o
and -90
o
)
138
Moura, E., Costa, G., Borchartt, T. and Conci, A.
A Tool for 3D Representation of the 2D Thermographic Breast Acquisitions.
DOI: 10.5220/0012469500003660
Paper published under CC license (CC BY-NC-ND 4.0)
In Proceedings of the 19th International Joint Conference on Computer Vision, Imaging and Computer Graphics Theory and Applications (VISIGRAPP 2024) - Volume 4: VISAPP, pages
138-146
ISBN: 978-989-758-679-8; ISSN: 2184-4321
Proceedings Copyright © 2024 by SCITEPRESS – Science and Technology Publications, Lda.

views.
Each specific direction and view is important to
increase the possibility of identification of an breast
abnormalities. Side images are as important as frontal
images are (Jeyanathan et al., 2018), and an abnor-
mality not seen on frontal image can be seen on a side
acquisition. Moreover, they allow not only a best view
but the possibility of combine the information from all
images captured separately (Silva, 2010).
Mainly when for more complex diagnosis one
needs to make correlations among the images. How-
ever in such case for combination of all views, its is
necessary to have a tools for make easier to have a
unique form to visualize all five images captured in
one static exam. The aim of this work is to present a
methodology developed to unify the 5 views in a 3d
model properly. Using this, specialist can begins to
analyze the model without the need of mental combi-
nation or no longer necessity to correlate the images
manually (Costa et al., 2023).
In this paper, we propose a methodology to make
a tool that automatic constructs three-dimensional
breast models based on the five images from static
thermography exams (i.e. images of same patient
breasts from different angles). Data used were ac-
quired under a consent of the ethics committee of our
university hospital and ministry of health, being pub-
licly registered. To accomplish the objective, it is nec-
essary to make breast segmentations; extract the key
points and relevant curves from the images; correlate
spatially the key points; correctly positioning and ori-
entation of the curves; increase the dimensional in-
formation of the edge points; create a rational smooth
surface and include texture mapping to render the syn-
thetic tri dimensional model.
In the next section, a review of related works on
breast modeling is explored. After, the approaches
used in this study is presented in Section 3, outlin-
ing the procedures and techniques used for the three-
dimensional modeling of breasts. Section 4 discusses
the results, highlighting the contributions and impli-
cations of our propositions. Section 5 compares the
results, presenting conclusions and suggestions for
future research in this scope.
2 RELATED WORKS
This section presents some works on 3D modelling of
the breast in chronological order.
Silva (2010) developed a three-dimensional re-
construction method for breasts using thermal im-
ages in different positions. The algorithm utilizes
body contours, curves fitted by least squares, and
the NURBS (Non-Uniform Rational B-Splines) tech-
nique to generate 3D meshes. A software was im-
plemented to create three-dimensional models from
infrared exams, highlighting variations between the
actual body and the generated model. However, the
study did not focus on 3D visualization tools for ex-
ams (Silva, 2010) .
Ciechomski et al. (2012) developed a computa-
tional tool for the three-dimensional reconstruction of
the breast from digital photos taken also at three an-
gles (frontal, right lateral, and left lateral). The gener-
ation of the 3D model is based on the identification of
points provided by the user in the 2D images. In this
approach some measurements must be manually in-
cluded, as the distance between the nipples and from
the nipple to the infra mammary fold.
As the main goal of Ciechomski et al. (2012)
is surgery planning, the physician carries out the
planning must define positions and diameters of the
implants for simulation. The software facilitates
the three-dimensional visualization of the breast out-
come. However, it is worth noting that the software
requires user intervention (Ciechomski et al., 2012) .
Viana (2016) created a 3D representation of the
female breast using points from infrared images gen-
erated by a computational program. A MATLAB
R
program corrected coordinates for breast reconstruc-
tion, and the resulting wireframe was exported for
Computational Fluid Dynamics (CFD) preprocess-
ing. The breast’s internal structure was modeled with
3D volumes, replacing lobes, lactiferous ducts, and
anomalies from patient examinations. Tools such
as Gambit
T M
, DesignModeler
R
, and MeshingTM
prepared the geometry for temperature calculations,
while Fluent
R
software calculated temperature val-
ues at mesh points (Viana, 2016).
Costa (2020) introduced an innovative algorithm
for automated 3D breast model construction, utiliz-
ing five images per patient: frontal, oblique right lat-
eral, oblique left lateral, total right lateral, and total
left lateral. Automatic segmentation employed the
U-net convolutional neural network across all views.
Nine curves, six corresponding to main images and
three auxiliary, were created considering different an-
gles. These curves were B-spline adjusted, and model
surfaces were generated using Non-Uniform Ratio-
nal B-Splines (NURBS) from the generated points.
While the model received majority approval from 15
experts, some noted shortcomings included lack of
edge smoothing, decentralized nipple texture, model
flattening, and inadequate depth representation in pa-
tients with larger breasts (Costa et al., 2023).
Saha (2023) addresses the challenge of visualizing
the complete 180
o
mammary region using only 2D
A Tool for 3D Representation of the 2D Thermographic Breast Acquisitions
139

thermal images, reconstructing 3D thermal images of
the breast surface from 2D thermal images captured
at different viewing angles (Saha et al., 2023). The
method consists of five main steps: foreground seg-
mentation, 3D mammary silhouette generation, 2D
visualization generator, loss function, and overlap
function. The segmentation process is applied using
the Otsu binary segmentation method to each of the
five thermal views captured at different angles, result-
ing in corresponding 2D mammary silhouettes. These
silhouettes are utilized in a CNN encoder-decoder ar-
chitecture to generate the 3D mammary silhouette,
which is then employed to obtain random projections
of the silhouettes. The loss function minimizes the
distance between the generated 2D projections and
the actual silhouettes of the input 2D thermal images,
and the overlap function maps the input temperature
values onto the generated 3D silhouette.
3 METHODOLOGY
We here present details of how the three-dimensional
breast surface is constructed from five two-
dimensional thermographic images obtained at
the angles of 0
o
, 45
o
, 90
o
, -45
o
, and -90
o
. Basically,
the reconstruction algorithm addresses five main
steps: (1) segmentation of the 5 original 2d images,
extraction of relevant 2d points and plane curves
(i.e. in the plane of each image), (2) geometric
transformations of these 2d to 3d points and plane
curves to theirs 3d orientation and position; (4)
increasing the dimensional information of the control
points to allow 3d borders , (5) 3d surface modelling
by using Rational Non-uniform B-splines Surface
(NURBS) for breast representation of volunteers, and
its rendering.
This works is dedicated mainly to correct some
previous drawn-back of the NURBS construction, it
is in step 2. We here suggest a set of modifications
in the rotations points and cutting regions to achieve
more complete and smooth breast representations.
3.1 Image Acquisition
This work uses a public data from (Silva et al., 2014)
and available online at Visual Lab DMR website (vi-
sual.ic.uff.br/dmi). The images have a resolution of
640x640 pixels , and are achieved with a thermo-
graphic camera FLIR
R
SC620. The acquisition pro-
tocol captures 25 images for each patient, 20 are un-
der induced superficial temperature modification (dy-
namic protocol), and 5 under constant temperatures
(static protocol) (Silva et al., 2014). Only the static 5
images are used on this work methodology.
Each image represents a different angle between
the camera frontal direction and the patient coronal
plane. Frontal view captures the body plane in the
same direction of the frontal camera plane, that is the
angle between them is 0
o
. Figure 1 first image shows
this view. The oblique on the right lateral view cap-
tures the body rotated to 45
o
to the right around the
cranium- caudal body axis: Figure 1 second image
shows this view. Oblique on the left lateral view , ori-
entated for acquisition the body rotated around 45
o
to
the left in this axis (Figure 1 fourth image shows this
view). The right lateral view puts the body rotated to
90
o
to the right before acquisition (Figure 1 third im-
age shows this view) . The left lateral view rotated to
90
o
to the left the body as can be observed in the final
image of Figure 1).
The proper functioning of the image processing
and edge detection algorithm depends on ensuring
that the 5 input images meet specifications, being cap-
tured without blur or other errors. In lateral images,
it is crucial that the contour of the breasts is visible.
Examinations revealing anomalies in breast shape are
considered only if the visibility of one breast’s silhou-
ette is not impaired by the other. A preprocessing step
is incorporated to eliminate inputs and preserve the
accuracy and reliability of the algorithm’s output.
3.2 Preprocessing
Initially, a simple conversion is performed from tem-
perature data stored for the images to the gray scale,
which operates with only one channel per image. The
conversion is expressed by Equation 1, where, for an
image P, P
i j
represents the temperature value of a
point (i, j) of the stored image array. The minimum
and maximum temperatures in a matrix are denoted
by min and max, respectively. The result, m
i j
, cor-
responds to the new gray scale value of each pixel,
allowing good contrast and visibility of the tempera-
tures:
m
i j
= 255 ×
Pi j − min
max − min
(1)
In the prepossessing step, the dimension of the
gray scale images is also transformed from 640×480
to 256x256. These new images will be used in the
automatic segmentation process.
The frontal view images of the exams will be used
exclusively for the texture mapping in the rendering
step of the three-dimensional model. To obtain a color
representation of this view, their pixels are converted
from gray scale to the RGB (Red, Green, Blue) color
system, following the Look Up Table (LUT) of the
FLIR Rain palette color levels.
VISAPP 2024 - 19th International Conference on Computer Vision Theory and Applications
140
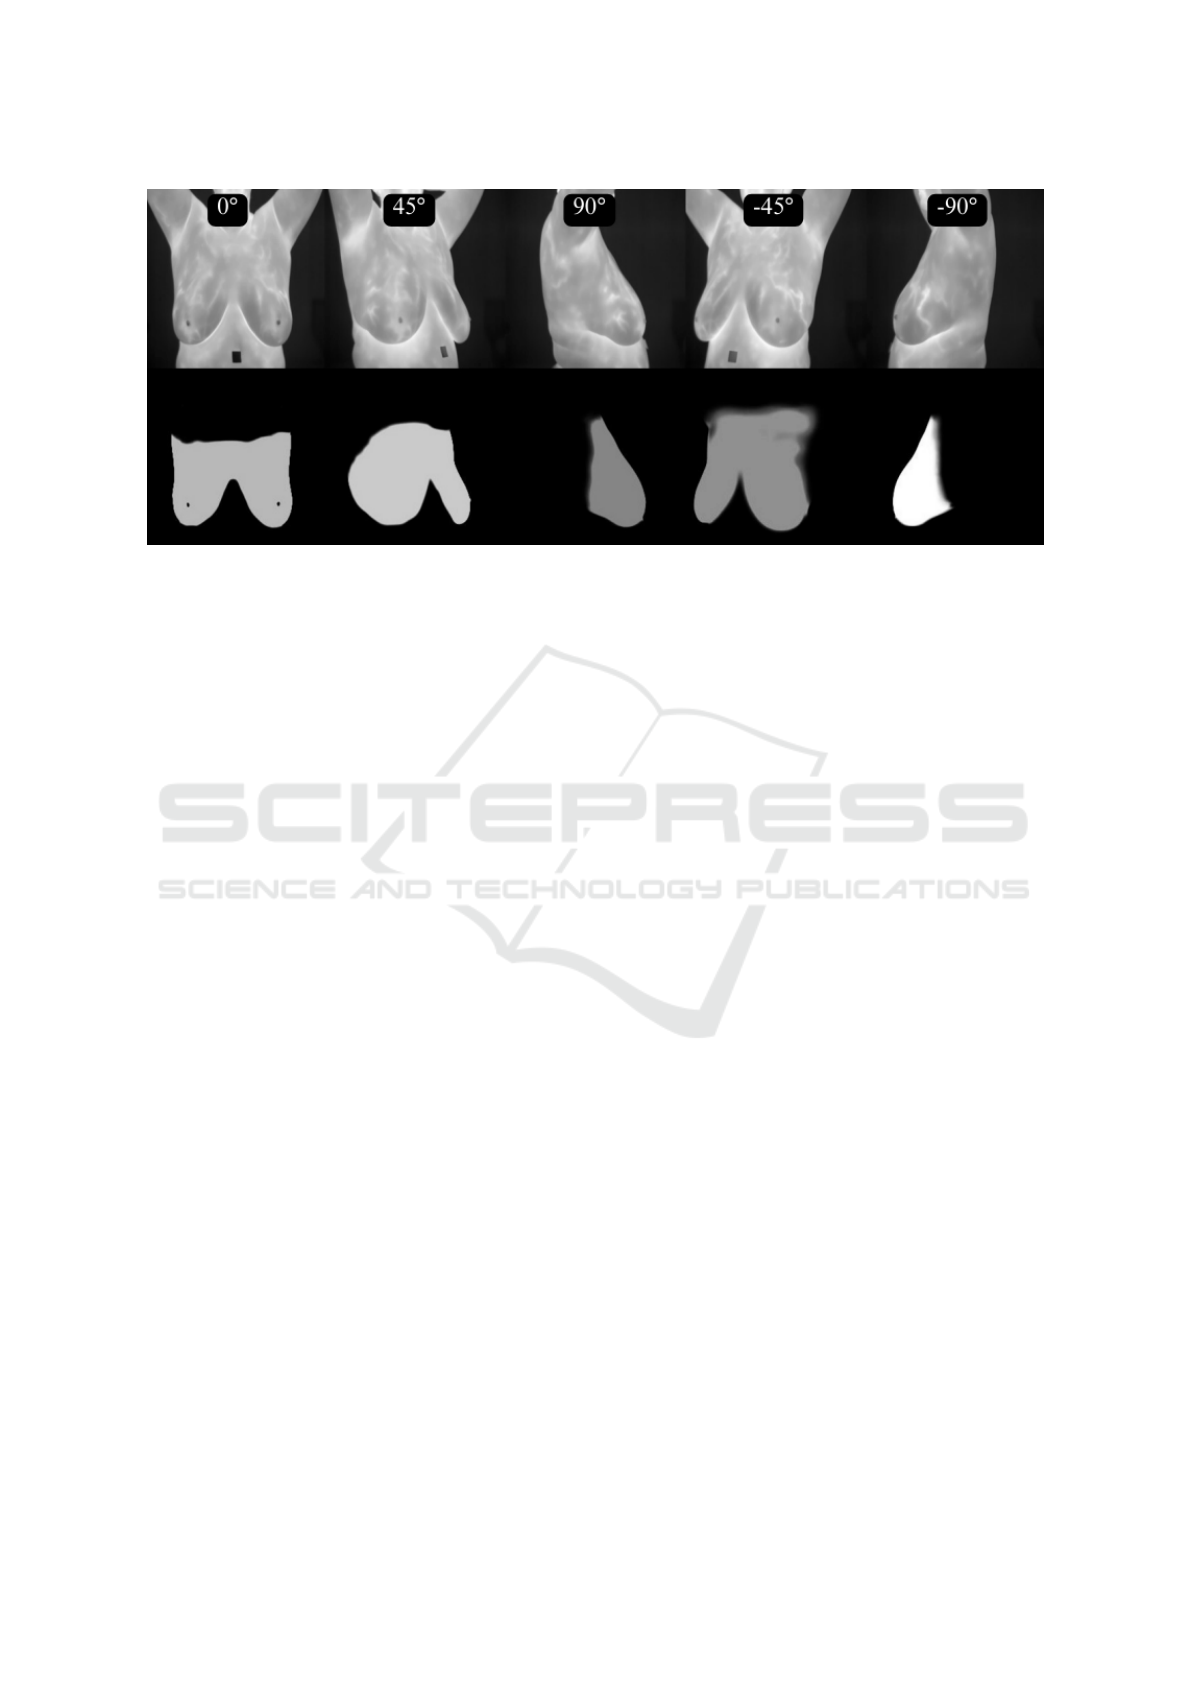
Figure 1: Five images of an thermography exam with the body and camera at five positions. Frontal (0
o
), oblique on the right
lateral (45
o
), right lateral (90
o
), oblique on the left (-45
o
) and left lateral (-90
o
) (first line). Example of automatic segmentation
output using a U-Net architecture and the learned hyper-parameters (second line).
3.3 2D Border Segmentation
The segmentation of the region of interest (ROI) of
the breasts is performed using a deep learning tech-
nique, specifically the architecture of a Convolutional
Neural Network (CNN) named U-Net (Ronneberger
et al., 2015) (Dalmia et al., 2018).
Considering all the data set of patients, a subset
used, 109 (78%) exams were used for training the nets
and 31 (22%) were separated from the database for
testing. The training used 100 epochs in batches of
2 with 50 epochs. Net weights are initialized with
normal distribution of random values. Each convo-
lution uses the rectified linear unit activator (ReLU)
function to allow passing values that are greater than
zero (0). Adam optimizer with learning rate 1x10
−4
is
used (zhixuhao, 2023). This allows the region of the
breasts to be separated (i.e. segmented) from the rest
of the image, as shown in Figure 1. In this figure the
first line of images represents the gray scale input to
the U-net and the second line the segmented results.
After segmentation with the U-net, it is necessary
to perform a filtering step to remove unnecessary ar-
eas. This is achieved by applying a grayscale thresh-
old using the Suzuki approach, transforming the im-
age into binary (Suzuki et al., 1985). Subsequently,
only the area with the highest number of pixels in
each direction is retained. The Canny edge detection
method is then applied to obtain only the largest con-
nected edges in each direction. This process is de-
tailed in (Costa et al., 2023).
3.4 Relevant Edge
Identifying relevant edges and points in each view
(Figure 2) is crucial for understanding breast shape in
width (front views) and depth, thickness, and height
(lateral obliques and side views). These elements are
later used to generate 3D information, transforming
plane curves into spatial ones for surface modeling.
The infra-mammary curve holds particular impor-
tance in this process and serves as a reference to po-
sition other curves. Through the identification of rel-
evant edges and points in each view, a unified 3D co-
ordinate system is established. The four-step process
is employed to identify these relevant edges.
Initially, the algorithm locates points in the lower
region of each edge by searching for the first pixels
from bottom to top in the output of the previous step.
This ensures that only the pixels closest to the bottom
of each of the five edges are stored. Then, a verti-
cal search is conducted, starting from the right side
of each image. Unlike the bottom search, the lateral
search involves scanning each final edge pixel from
the right end to find the closest pixels on this side.
The same approach is applied to define the left edge,
finding the closest pixels on this side.
In the final step, pixels from the first step that are
found three times in steps 2 and 3 are removed. This
ensures the exclusion of points present in the relevant
edges on the right and left sides. The resulting points
constitute the basis for subsequent 3D modeling. This
process is detailed in (Costa et al., 2023).
A Tool for 3D Representation of the 2D Thermographic Breast Acquisitions
141
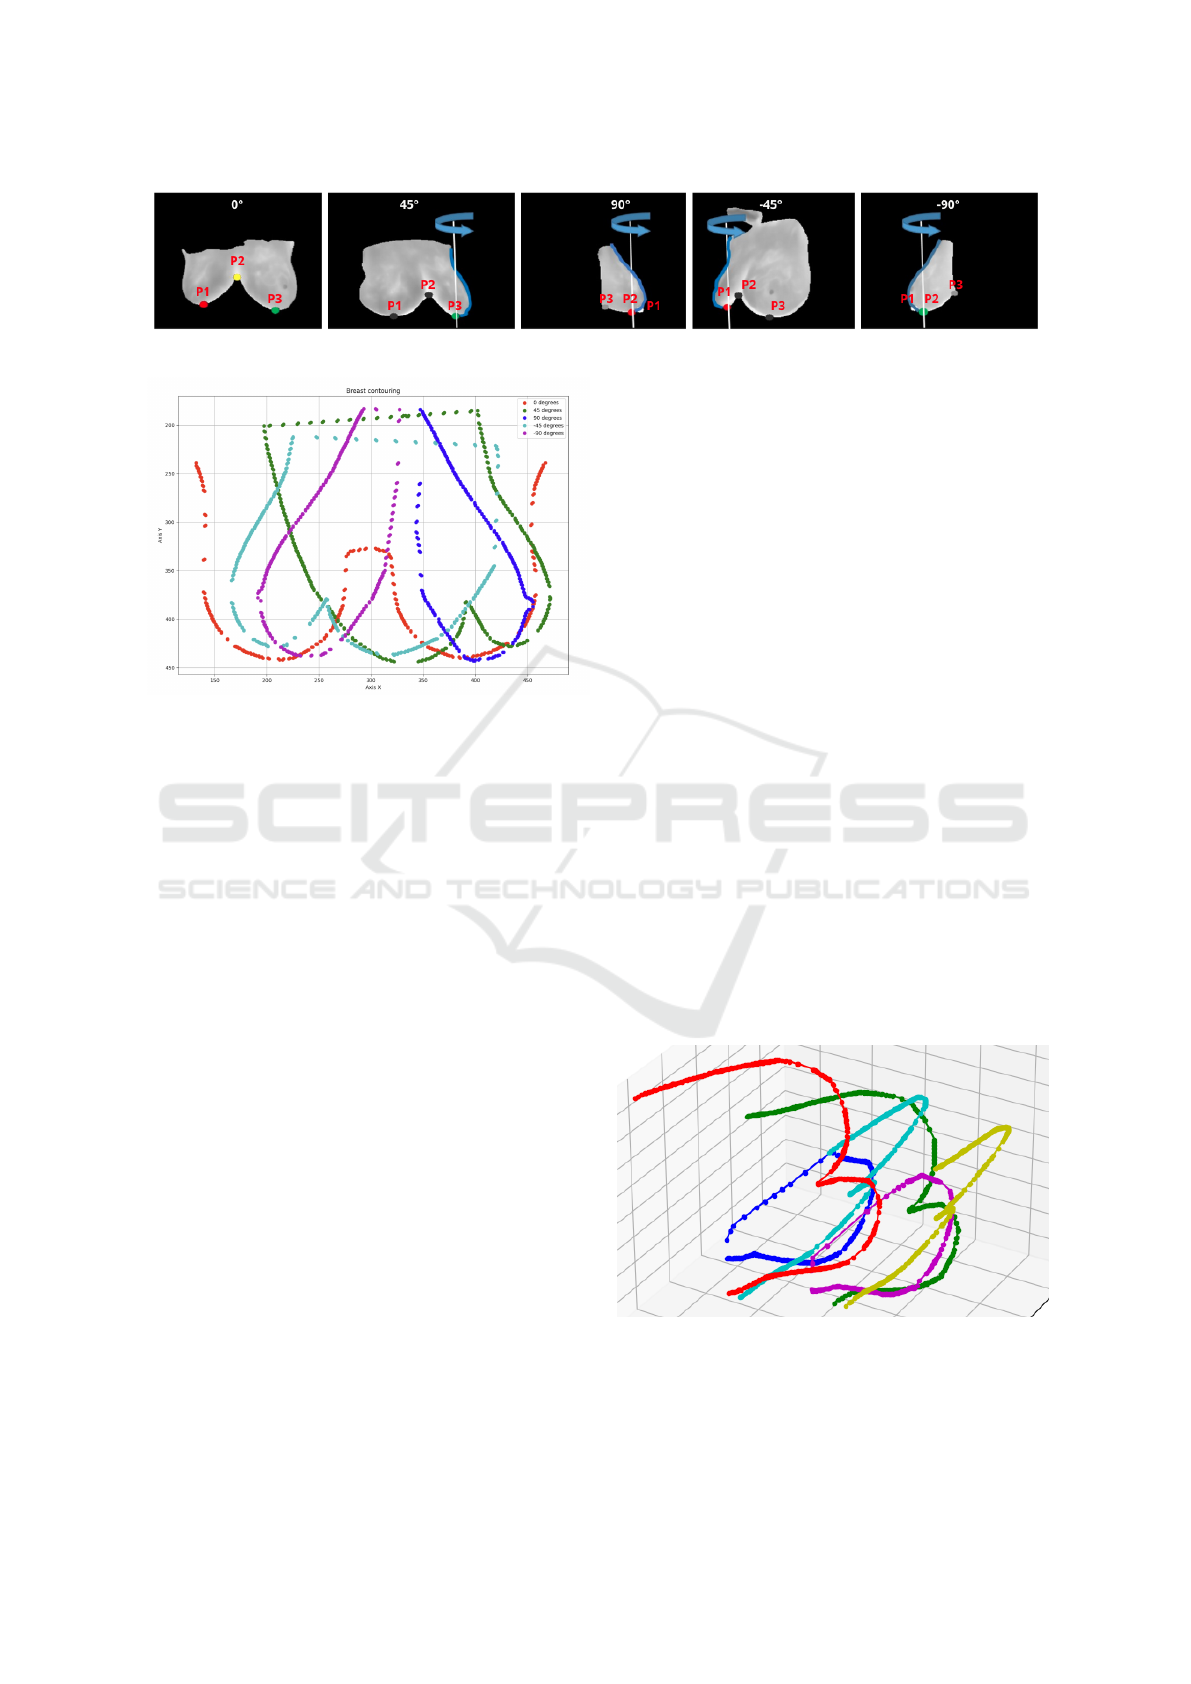
Figure 2: Identification of the relevant edges and key points of each direction.
Figure 3: Relevant edges in a two-dimensional plane: Red
color represents the points from the frontal view; the two
tones of Green color represent the points from the oblique
views; magenta and blue colors represent the points from
the side view.
3.5 Key Points of Breast Edges
Extraction of each view relevant breast edges points
for each examination angle (or for each view) must be
done. For each 2d curve of the last step, this process
consists of the identification of three points named P1,
P2 and P3. Figure 2 shows these points in the images
resulting from segmentation of relevant edges in order
to better identify their meanings. These points belong
to the lower single edge of the 5 views, that is, from
final step of the previous subsection.
On the 0
o
, 45
o
and -45
o
images, a point is found
at the junction of the infra-mammary curves, in the
center of the body, this is named P2, Other two points
correspond to the inflections of the infra-mammary
curves on the right (named P1) and left (P3). For side
images of 90
o
and -90
o
, the beginning and end of the
curve are identified, they are named P1 and P3, and
presented on Figure 2(d). For these view, a third point
(named P2) is defined by lowest point of these curves.
3.6 Geometric Transformation and 3D
Representations
After segmenting the breast limits in various direc-
tions in the 2D plane, key points identified in the pre-
vious step play a crucial role in translating and rotat-
ing the 2D curves to their correct positions in a three-
dimensional space.
A 3D coordinate system is employed, where the X
and Y axes align with the 2D image’s horizontal and
vertical directions, respectively, and the Z-axis is de-
termined by the cross product of X and Y. The trans-
lation of curves involves moving them to the identi-
fied key points, and subsequent rotation is based on
the view directions, creating a 3D representation for
surface generation.
Curves, such as those from 45
o
and -90
o
views,
undergo rotation by their respective angles. For in-
stance, curves from 45
o
and 90
o
views are translated
to point P3, while curves from -45
o
and -90
o
views
are moved to point P1 on the frontal contour (see
Figure 4). This results in rotated curves with di-
verse 3D coordinates based on their rotation angles.
To enhance the 3D representation, auxiliary contours
are created by replicating contours from 45
o
and -
45
o
views to new positions, forming curves rotated
by 135
o
and -135
o
(which rotate at around P3 and P1,
respectively). These contribute to the formation of an
internal curve resembling a valley between two moun-
tains relief. Figure 4 displays these curves. After this
step, the algorithm eliminates all points located above
the zero point on the Z axis, revealing only the surface
of the breast (see Figure 5).
Figure 4: The main curves after their translation and rota-
tion and the auxiliary curves at 135
o
and -135
o
, in yellow
and red, included for modeling the surface of the breast re-
gions.
VISAPP 2024 - 19th International Conference on Computer Vision Theory and Applications
142
3.7 Surface Modelling
So far, six curves that play a crucial role in determin-
ing the breast shape have been identified. In addition
to these, three more curves are incorporated to com-
pose the model, representing the lateral and central
profile of the body. These curves are derived from the
0
o
image, with the first capturing the left contours,
the second capturing the right contours, and the cen-
tral curve generated by connecting the P1 points to a
straight line to the top of the image. This process re-
sults in a total of nine curves: (1) right frontal curve,
(2) left oblique lateral curve, (3) total lateral (right 90
o
angle) curve, (4) left oblique auxiliary curve, (5) cen-
tral auxiliary curve, (6) right oblique auxiliary curve,
(7) total lateral (left 90
o
angle) curve, (8) right oblique
curve, (9) left frontal curve. Figure 5 shows all these
curves.
Figure 5: The set triangular mesh limit points of generated
curves parallel to the cranium caudal body direction used
for rendering the final surface.
These nine 3D curves are initially described by all
their points (raster format). However, for better de-
scription and surface generations, they must be trans-
formed into vector form, i.e., through mathematical
expressions.
As the number of points on each of these curves is
different, an adjustment is used before these. They are
normalize for represent the same number of control
points for each curve. The B-spline function imple-
mented in (Bingol and Krishnamurthy, 2019) is em-
ployed for this purpose.
The nine (9) B-Splines curves (in blue) and
NURBS Surface created are shown in Figure 5 by
green dots. They are represent the vertices of the tri-
angles that generated the mesh, obtained after apply-
ing a generator of the surface by NURBS (Azevedo
and Conci, 2003) and delete all positive points (Costa
et al., 2023). The final red shaded surface of these
process can be observed in Figure 6.
Figure 6: Output of Costa’s algorithm showing smaller
breast volume than the patient’s breast.
4 SURFACE IMPROVEMENTS
For the surface, only the curves representing the
breast shape are necessary. For this reason, Costa’s
original algorithm discards points that have positive
Z-axis coordinates (Costa et al., 2023). The result is a
surface that does not fully represent the breast shape
on 90
o
lateral views and includes some irregular ap-
pearing like folders, protrusions and superficial pleats
in the upper parts.
In the quest to refine the model, the decision was
made to display the complete curvature of the breast
in the 90
o
images. The new approach involves exclud-
ing points with Z coordinates greater than the Z coor-
dinate of P3 (representing the end of the infra mam-
mary region and being the point closest to the body’s
center, as shown in the Figure 2). Due to variability
in the position of these points, a strategy was adopted
to calculate the Z average between the two P3 points
from the 90
o
and -90
o
curves (referred to as PM3).
This has the effect of slightly shifting the curve end
to include some ascendant curve points, providing a
more accurate representation of breast anatomy.
Figure 7: New algorithm result: the complete shape of the
side of the breast is represented.
Another modification to the previous model is
made by translating all Z points of the right frontal
curve and the left frontal curve to PM3, that is re-
sponsible for defining the trunk shape. This change
ensures a more rounded profile for the body. Figure 7
show the result achieved with this modification. Com-
A Tool for 3D Representation of the 2D Thermographic Breast Acquisitions
143
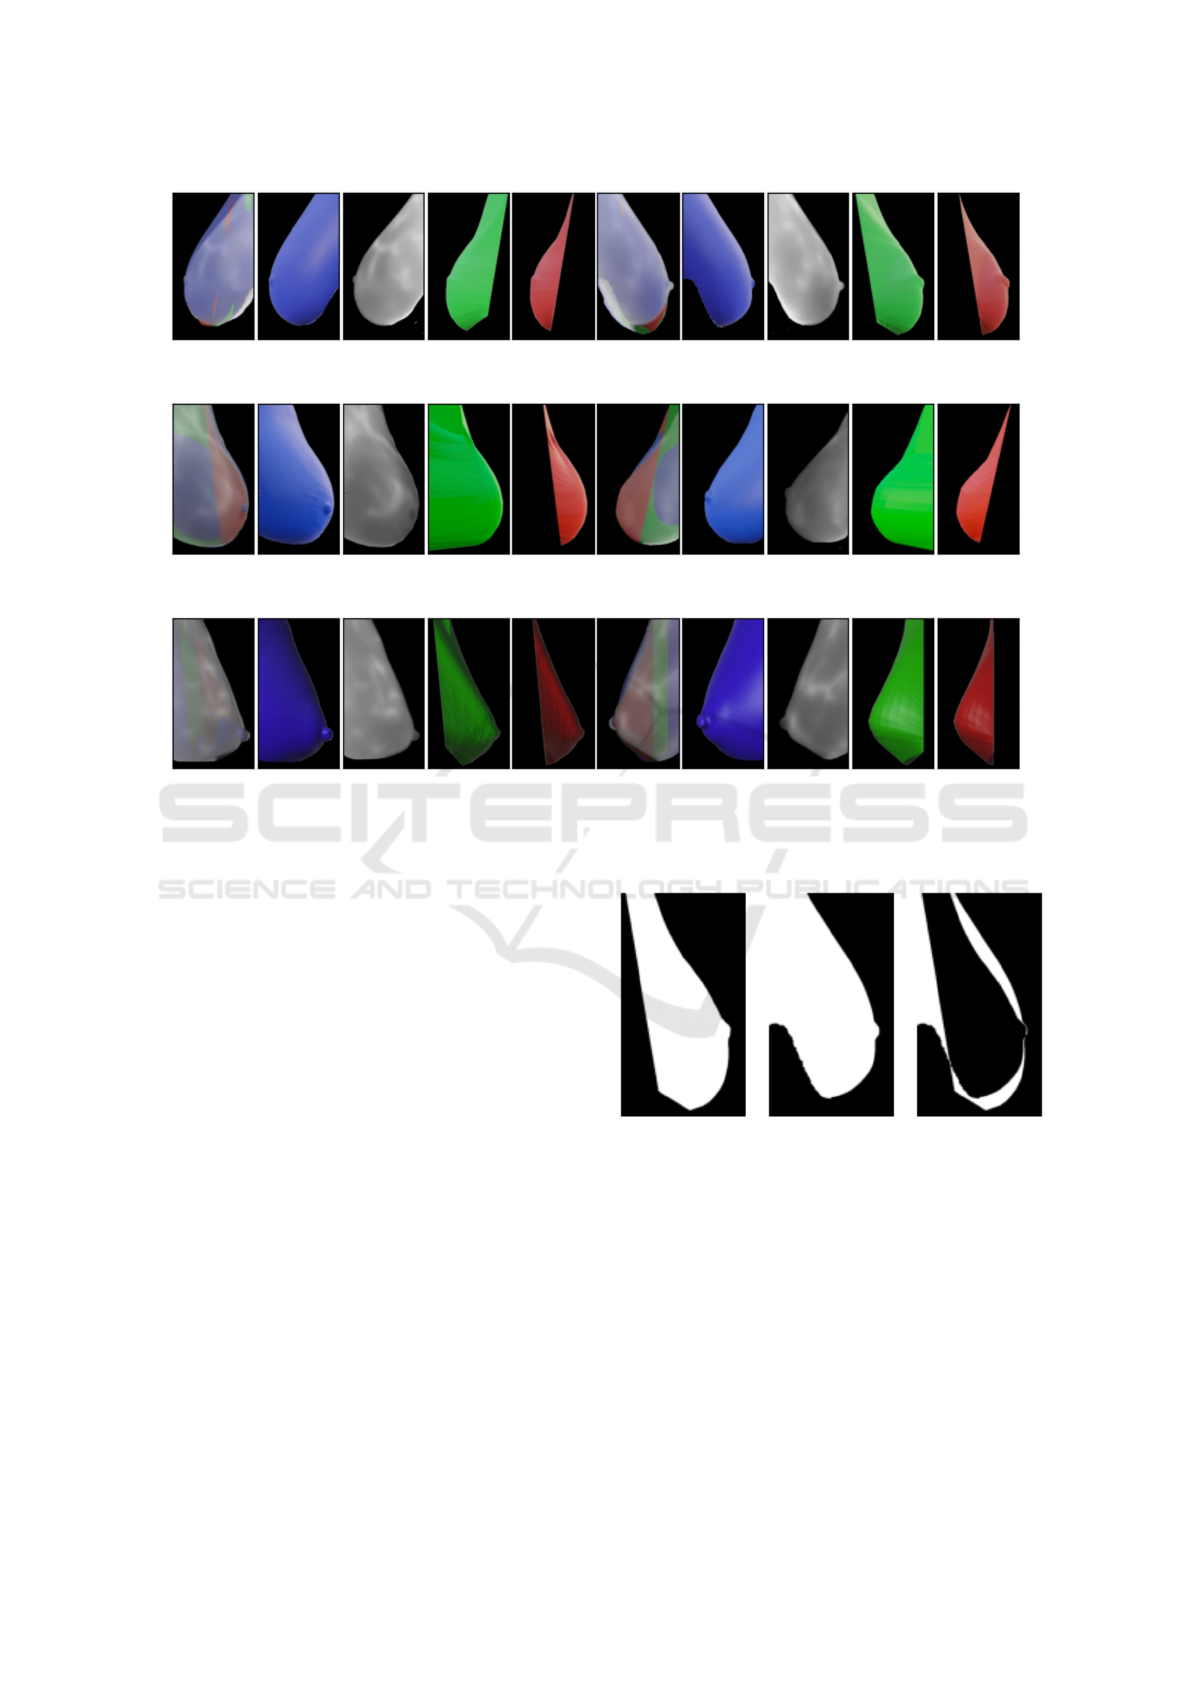
Figure 8: Blue: Structured Light Scanner; Gray: FLIR camera; Green: New algorithm; Red: Costa’s algorithm.
paring the lateral breast contours of both results (i.e
Figure 7 and Figure 6), it is possible to see that now
the resulting surface is more realistic.
5 COMPARING RESULTS
In the present study, a qualitative and quantitative
comparison was carried out between the surfaces cre-
ated by Costa’s algorithms and the new algorithms, as
well as 3D images acquired using the structured light
scanner and 2D images captured by the FLIR camera
at angles of 90
o
and -90
o
degrees, through image anal-
ysis, using data from 3 volunteers. The objective was
to contrast the models generated by the previous al-
gorithm with those produced by the new algorithm, as
well as to analyze the Symmetric Difference between
the data coming from the structured light scanner scan
and FLIR (Conci and Kubrusly, 2017).
Using Blender
R
software, all 3D models and
2D images were superimposed respecting the same
limits, see figure 8. The proposed image com-
parison algorithm uses a visual approach, binariz-
ing each image of interest and then calculating the
symmetric difference between each corresponding
pixel in the two models, see the example in the fig-
ure 9. More images available online on the web-
site (https://sites.google.com/view/three-dimensional-
breast-model).
Figure 9: Binarized images of the New model (left) and
Structured Light Scanner reconstruction (center) of volun-
teer 1 at 90 degree angle. In the last image on the right, the
symmetric differences between the two images is displayed
in white.
Table 1 displays the percentage of difference be-
tween each volunteer’s models for the 90 and -90
degree angles. These values allow comparisons be-
tween thermal images (FLIR) and Scanner acquisi-
tions (Scan) with the Costa’s algorithm (Old) and new
algorithm (New). This table shows, in the bottom line,
the Standard Deviation (SD) of the 6 views used: the
biggest difference in the average values (line 8) is in
VISAPP 2024 - 19th International Conference on Computer Vision Theory and Applications
144

Table 1: Between breast relative symmetric differences, means and standard deviations (SD).
Volunteer–angle New/Old Scan/Old Flir/Old Scan/New Flir/New Flir/Scan
1–(-90
o
) 20.75% 34.90% 38.66% 16.39% 19.45% 4,63%
1–(90
o
) 19.92% 39.79% 37.43% 20.30% 18.87% 5,74%
2–(-90
o
) 28.41% 29.67% 27.86% 4.39% 6.10% 5.34%
2–(90
o
) 47.50% 47.97% 49.75% 5.58% 5.19% 2.96%
3–(-90
o
) 17.36% 33.86% 33.31% 16.74% 16.23% 1,91%
3–(90
o
) 18.31% 36.21% 37.82% 20.97% 22.78% 3.26%
Mean 25.38% 37.07% 37.47% 14.06% 14.77% 3.97%
SD 11.52 6.27 7.24 7.28 7.37 1.50
the Scan/Old and Flir/Old columns. Considering the
DP (line 9), the most critical variation occurs between
the New and Costa’s algorithm.
6 CONCLUSIONS
We can see that the new model represents the breast
with a more pronounced lateral contour, more faith-
fully reflecting the anatomy of the body. The compar-
ison between the previous model and the new model
highlights that there were no significant changes in
the shape of the model’s surface, but rather in the to-
tal volume of the surface included in the breast.
In a quantitative evaluation of the results, compar-
ing FLIR acquisitions (thermal images) and Scanner
with the Costa’s algorithm and New algorithm, we
observed that, concerning scanning, the Costa’s algo-
rithm has an average of 37.07% with a standard de-
viation of 6.27, while the New algorithm exhibits an
average of 14.06% with a standard deviation of 7.28.
When compared to thermal images, the Costa’s algo-
rithm has an average of 37.47% with a standard de-
viation of 7.24, whereas the New algorithm shows an
average of 14.77% with a standard deviation of 7.37
(see Table 1). These results indicate that the New al-
gorithm significantly improves the representation of
the breast shape compared to the Costa’s algorithm.
However, improvements are still possible in the
frontal representation, as well as in adjusting the
alignment of the curves in the upper region of each
breast.
It is important to highlight that textures were not
incorporated in this work. Therefore, this is the ob-
jective of future research, which is the development
of merging all five images into a single textured 3D
object, enabling an overview of infrared scans.
ACKNOWLEDGEMENTS
E.L.S.M. is supported by Federal Institute of Educa-
tion, Science and Technology of Rond
ˆ
onia (IFRO).
A.C. is supported in part by the National Institutes
of Science and Technology (INCT - MACC project),
National Council for Scientific and Technological
(CNPq) under grant 307638/2022-79, the Research
Support Foundation of Rio de Janeiro State (FAPERJ)
over CNE, e-Health Rio and Digit3D (”tem
´
aticos”)
projects (Digit3D projects, 2023).
REFERENCES
Azevedo, E. and Conci, A. (2003). Computac¸
˜
ao gr
´
afica:
teoria e pr
´
atica. Elsevier, Rio de Janeiro.
Bingol, O. R. and Krishnamurthy, A. (2019). NURBS-
Python: An open-source object-oriented NURBS
modeling framework in Python. SoftwareX, 9:85–94.
Borchartt, T. (2013). An
´
alise de imagens termogr
´
aficas
para a classificac¸
˜
ao de alterac¸
˜
oes na mama[Analysis
of thermographic images to classify changes in the
breast]. PhD thesis, Instituto de Computac¸
˜
ao, Uni-
versidade Federal Fluminense, Niter
´
oi, RJ, Brasil.
Bray, F., Ferlay, J., Soerjomataram, I., Siegel, R. L., Torre,
L. A., and Jemal, A. (2018). Global cancer statistics
2018: Globocan estimates of incidence and mortality
worldwide for 36 cancers in 185 countries. CA: a can-
cer journal for clinicians, 68(6):394–424.
Ciechomski, P. H., Constantinescu, M., Garcia, J., Olariu,
R., Dindoyal, I., Huu, S. L., and Reyes, M. (2012).
Development and implementation of a web-enabled
3d consultation tool for breast augmentation surgery
based on 3d-image reconstruction of 2d pictures.
Journal of Medical Internet Research, 14(1):e21.
Conci, A. and Kubrusly, C. (2017). Distance between sets
- a survey. Advances in Mathematical Sciences and
Applications, 26(1):1–18.
Costa, G., Moura, E., Borchartt, T., and Conci, A. (2023).
Modeling the 3d breast surface using thermogra-
phy. In Kakileti, S., Manjunath, G., Schwartz, R.,
and Frangi, A., editors, Artificial Intelligence Over
Infrared Images for Medical Applications (AIIIMA
A Tool for 3D Representation of the 2D Thermographic Breast Acquisitions
145

2023), volume 14298 of Lecture Notes in Computer
Science, page 45–56. Springer.
Dalmia, A., Kakileti, S. T., and Manjunath, G. (2018). Ex-
ploring deep learning networks for tumour segmenta-
tion in infrared images. In 14th Quantitative Infrared
Thermography Conference, Berlin, Germany. DGZfP.
Digit3D projects (2023). Digit3d projects. Acessado em 8
de novembro de 2023.
Jeyanathan, J. S., Shenbagavalli, A., Venkatraman, B., and
Menaka, M. (2018). Analysis of breast thermograms
in lateral views using texture features. In TENCON
2018 - 2018 IEEE Region 10 Conference, pages 2017–
2022, Jeju Island, Korea.
Jockers, D. (2019). Thermography: The new gold standard
in breast cancer screening.
Koay, J., Herry, C., and Frize, M. (2004). Analysis of breast
thermography with an artificial neural network. In The
26th Annual International Conference of the IEEE En-
gineering in Medicine and Biology Society, volume 1,
pages 1159–1162, San Francisco, California. IEEE.
Lanisa, N., Cheok, N. S., and Wee, L. K. (2014). Color
morphology and segmentation of the breast thermog-
raphy image. In 2014 IEEE Conference on Biomedical
Engineering and Sciences (IECBES), pages 772–775,
Miri, Sarawak, Malaysia. IEEE.
Otmani, I., Amroune, M., Rahmani, F. L., Soltani, H.,
Benkhelifa, E., and Conci, A. (2024). Lamis-dmdb:
A new full field digital mammography database for
breast cancer ai-cad researches. Biomedical Signal
Processing and Control, 90:105823.
Pricigalli, N., Moura, E., and Conci, A. (2023). Is symetry
important in breast infrared examinations? In Kak-
ileti, S., Manjunath, G., Schwartz, R., and Frangi,
A., editors, Artificial Intelligence Over Infrared Im-
ages for Medical Applications (AIIIMA 2023), volume
14298 of Lecture Notes in Computer Science, page
67–79. Springer.
Raghavan, K., B, S., and v, K. (2023). Attention guided
grad-cam: an improved explainable artificial intelli-
gence model for infrared breast cancer detection. Mul-
timed Tools Appl.
Ronneberger, O., Fischer, P., and Brox, T. (2015). U-net:
Convolutional networks for biomedical image seg-
mentation. In International Conference on Medical
image computing and computer-assisted intervention,
pages 234–241, Heidelberg, Berlin. Springer.
Saha, A., Kakileti, S., Dedhiya, R., and Manjunath, G.
(2023). 3d-breastnet: A self-supervised deep learn-
ing network for reconstruction of 3d breast surface
from 2d thermal images. In Kakileti, S., Manjunath,
G., Schwartz, R., and Frangi, A., editors, Artificial In-
telligence Over Infrared Images for Medical Applica-
tions (AIIIMA 2023), volume 14298 of Lecture Notes
in Computer Science. Springer, Cham.
Silva, L., C. M. Saade, D., Sequeiros Olivera, G., Silva,
A., Paiva, A., Bravo, R., and Conci, A. (2014). A
new database for breast research with infrared image.
Journal of Medical Imaging and Health Informatics,
4(1):92–100.
Silva, S. V. (2010). Reconstruc¸
˜
ao da Geometria da Mama
a partir de Imagens Termogr
´
aficas[Reconstruction of
Breast Geometry from Thermographic Images]. PhD
thesis, Computer Institute. Universidade Federal Flu-
minense, Niteroi, Brazil.
Suzuki, S. et al. (1985). Topological structural analy-
sis of digitized binary images by border following.
Computer vision, graphics, and image processing,
30(1):32–46.
Venkataramani, K., Mestha, L. K., Ramachandra, L.,
Prasad, S., Kumar, V., and Raja, P. J. (2015). Semi-
automated breast cancer tumor detection with ther-
mographic video imaging. In 2015 37th Annual In-
ternational Conference of the IEEE Engineering in
Medicine and Biology Society (EMBC), pages 2022–
2025, Milan, Italy. IEEE.
Viana, M. (2016). Reconstruc¸
˜
ao tridimensional da mama
feminina a partir de imagens m
´
edicas por infraver-
melho com aux
´
ılio de geometrias substitutas[Three-
dimensional reconstruction of the female mother from
infrared medical images with the aid of surrogate ge-
ometries]. PhD thesis, Universidade Federal de Per-
nambuco.
zhixuhao (2023). Github - zhixuhao/unet. Acessado em 8
de novembro de 2023.
VISAPP 2024 - 19th International Conference on Computer Vision Theory and Applications
146
