
Second-Order Learning with Grounding Alignment: A Multimodal
Reasoning Approach to Handle Unlabelled Data
Arnab Barua
1 a
, Mobyen Uddin Ahmed
1 b
, Shaibal Barua
1 c
, Shahina Begum
1 d
and Andrea Giorgi
2 e
1
School of Innovation, Design and Engineering, M
¨
alardalen University, 722 20 V
¨
aster
˚
as, Sweden
2
Department of Anatomical, Histological, Forensic and Orthopedic Sciences, Sapienza University of Rome, Rome, Italy
Keywords:
Multimodal Reasoning, Autoencoder, Supervised Alignment, Semi-Supervised.
Abstract:
Multimodal machine learning is a critical aspect in the development and advancement of AI systems. How-
ever, it encounters significant challenges while working with multimodal data, where one of the major issues
is dealing with unlabelled multimodal data, which can hinder effective analysis. To address the challenge,
this paper proposes a multimodal reasoning approach adopting second-order learning, incorporating ground-
ing alignment and semi-supervised learning methods. The proposed approach illustrates using unlabelled
vehicular telemetry data. During the process, features were extracted from unlabelled telemetry data using an
autoencoder and then clustered and aligned with true labels of neurophysiological data to create labelled and
unlabelled datasets. In the semi-supervised approach, the Random Forest (RF) and eXtreme Gradient Boost-
ing (XGBoost) algorithms are applied to the labelled dataset, achieving a test accuracy of over 97%. These
algorithms are then used to predict labels for the unlabelled dataset, which is later added to the labelled dataset
to retrain the model. With the additional prior labelled data, both algorithms achieved a 99% test accuracy.
Confidence in predictions for unlabelled data was validated using counting samples based on the prediction
score and Bayesian probability. RF and XGBoost scored 91.26% and 97.87% in counting samples and 98.67%
and 99.77% in Bayesian probability, respectively.
1 INTRODUCTION
Machine learning (ML) has revolutionised various
domains, including healthcare, automotive, agricul-
ture, and education, by utilising data analysis to en-
able better decision-making. In recent years, ML has
made great strides in incorporating multimodal learn-
ing, which involves analysing and integrating infor-
mation from various sources of data such as text, im-
ages, audio, and video. In supervised learning, mul-
timodal learning requires labelled data for all modali-
ties (Baltru
ˇ
saitis et al., 2018). However, if one modal-
ity lacks labels, it can significantly hinder the ability
to extract meaningful correlations and insights across
different modalities. This challenge is particularly
problematic in multimodal contexts, where it is neces-
a
https://orcid.org/0000-0002-9698-8142
b
https://orcid.org/0000-0003-1953-6086
c
https://orcid.org/0000-0002-7305-7169
d
https://orcid.org/0000-0002-1212-7637
e
https://orcid.org/0000-0001-6220-3389
sary to comprehend and capture the multimodal inter-
actions between multiple modalities for specific tasks.
Alignment can play a crucial role in overcoming
this challenge. By aligning multimodal data accu-
rately, relationships and dependencies between dif-
ferent types of data can be captured, which can help
to facilitate a robust learning process (Baltru
ˇ
saitis
et al., 2018). Semi-supervised learning is another
strategy that utilises both labelled and unlabelled data
for decision-making and to provide an effective so-
lution. The combination of alignment and semi-
supervised techniques can yield a solution that ad-
dresses the complexities of unlabelled multimodal
data, paving the way for more accurate, insightful,
and resilient multimodal reasoning systems. This pa-
per addresses multimodal reasoning by incorporating
alignment and semi-supervised learning through mul-
timodal machine learning capabilities.
This work demonstrates multimodal reasoning for
driver mental fatigue classification where one modal-
ity is unlabelled vehicular telemetry data while an-
other provides the ground truth of mental fatigue from
Barua, A., Ahmed, M., Barua, S., Begum, S. and Giorgi, A.
Second-Order Learning with Grounding Alignment: A Multimodal Reasoning Approach to Handle Unlabelled Data.
DOI: 10.5220/0012466500003636
Paper published under CC license (CC BY-NC-ND 4.0)
In Proceedings of the 16th International Conference on Agents and Artificial Intelligence (ICAART 2024) - Volume 2, pages 561-572
ISBN: 978-989-758-680-4; ISSN: 2184-433X
Proceedings Copyright © 2024 by SCITEPRESS – Science and Technology Publications, Lda.
561

neurophysiological data analysis. The nature of ve-
hicular telemetry data is complex, with vehicles con-
tinuously generating large volumes of it. It is a topic
of great importance, as reported in various literature
(Winlaw et al., 2019; Alhamdan and Jilani, 2019).
The aim of this paper is to provide a solution for
handling unlabelled multimodal data through multi-
modal reasoning. The proposed approach of multi-
modal reasoning has two phases. In the first phase,
’first-order learning,’ key features are extracted from
the telemetry data and then clustered into distinct
groups. In the subsequent phase, ’second-order learn-
ing,’ the clustered data is aligned with external la-
bels from neurophysiological data analysis. This en-
ables the use of a semi-supervised learning approach
to classify unlabelled vehicular telemetry data. Au-
toencoder extracts features using unsupervised learn-
ing (Bank et al., 2023), and k-means clustering (Na
et al., 2010) divides them into groups. Labels are
aligned using a supervised alignment approach, and
Random Forest (RF) and eXtreme Gradient Boosting
(XGBoost) are used for classification and labelling in
the semi-supervised approach.
This study has made several contributions to unla-
belled data handling, and they are:
• Multimodal Reasoning: The synergy of align-
ment and semi-supervised learning enhances mul-
timodal reasoning and provides a reliable solution
for analysing unlabelled data.
• Knowledge Representation: Use of autoen-
coders for knowledge representation, which
helped to capture essential information from un-
labelled data and present it in a compressed and
latent form.
• Supervised Alignment and Semi-Supervised
Prediction: Using supervised alignment to align
unlabelled data with true labels of different data
helps in identifying and categorising similar pat-
terns in the unlabelled data. This approach en-
ables a semi-supervised method, which enhances
the model’s ability to classify and understand the
unlabelled dataset more accurately.
• Confidence Assessment for Multimodal Rea-
soning: Two validation strategies, i.e., Bayesian
probability analysis and counting frequency of
samples based on model prediction scores, were
implemented to ensure accurate predictions for
unlabelled samples.
• Cross-Domain Applicability: Enhancing vehic-
ular data analysis through multimodal reasoning
provides a solution for managing unlabelled ve-
hicular telemetry data. Additionally, this solution
provides a template for addressing similar chal-
lenges in various fields, including healthcare, en-
vironmental monitoring, finance, and manufactur-
ing.
The paper is organised as follows: Section 2 pro-
vides a summary of works on multimodal reasoning,
its approaches and vehicular telemetry data. Section 3
describes the details of the applied methodology and
used materials. Section 4 presents the results with fig-
ures. Finally, section 5 discusses the performed anal-
ysis and concludes the paper.
2 RELATED WORKS
Several notable studies have recently highlighted the
advances made in multimodal reasoning. In (Zheng
et al., 2023), the authors propose the DDCoT prompt-
ing technique that combines visual recognition with
critical thinking prompts to improve the reasoning
abilities and explainability of language models in
multimodal contexts. Authors in (Lu et al., 2022)
show that CoT significantly improves the perfor-
mance of large language models in both few-shot and
fine-tuning learning settings, underscoring the poten-
tial of explanations in enhancing AI reasoning capa-
bilities. In (Zhu et al., 2022), multimodal reasoning
is achieved through reverse-hyperplane projection on
Specific Disease Knowledge Graphs (SDKGs) using
structure, category, and description embeddings. A
semi-supervised study on multimodal reasoning is ex-
plored in (Liang et al., 2023). The study involves
quantifying interactions between labelled unimodal
and unlabelled multimodal data.
Vehicular telemetry data is a valuable source of
information that can be used to analyze driver be-
haviour, ensure identification, and improve safety on
roads. Several articles, such as (Cassias and Kun,
2007; Kirushanth and Kabaso, 2018; Gupta et al.,
2023; Rahman et al., 2020), have highlighted the im-
portance of analyzing telemetry data for driver identi-
fication, behaviour analysis, and road safety. How-
ever, labelling vehicular telemetry data for specific
tasks like driver identification and behaviour predic-
tion is challenging for researchers due to various
driving patterns, diverse driving conditions, and traf-
fic conditions, as discussed in (Singh and Kathuria,
2021; Respati et al., 2018; Tselentis and Papadim-
itriou, 2023).
Different methods exist to solve this problem, and
one way is to annotate the label manually. In (Aboah
et al., 2023), video data labels telemetry data with
class numbers assigned by an expert annotator. In
(Taylor et al., 2016), an expert annotator is used. In
(Wang et al., 2017), parameters are clustered and re-
ICAART 2024 - 16th International Conference on Agents and Artificial Intelligence
562

lated to established parameters. Lastly, in (Alvarez-
Coello et al., 2019), telemetry data is labelled by cal-
culating instance relevance. Automatically annota-
tion is also a popular procedure, and the main ben-
efit is that it saves time. Authors in (Vasudevan et al.,
2017) used telemetry data to detect drowsiness where
they identified events and determined intensity using
a statistical approach with a sliding window. Finally,
they labelled data based on intensity. The fusion tech-
nique integrates vehicular telemetry data with other
sources, like visual or physiological data, instead of
annotation. In (Wang et al., 2022), features from la-
belled video and vehicular telemetry data were fused
for classification. In (Islam et al., 2020; Islam et al.,
2023), mutual information was used to create a tem-
plate for physiological features, which was fused with
vehicular telemetry data for behaviour analysis.
Vehicular telemetry data handling can be a chal-
lenging task, despite being labelled. Researchers usu-
ally resort to statistical, supervised or unsupervised
techniques to extract features. For instance, articles
such as (Li et al., 2017; Papadelis et al., 2007; Barua
et al., 2023) employ ApEn to calculate entropy values,
but this approach has a significant drawback as it pro-
duces only one entropy value for the entire signal. In
(Vasudevan et al., 2017), the Analysis of Covariance
(ANOVA) approach is used to obtain the p-value pa-
rameter, which helps identify statistically significant
features. Additionally, unsupervised methods, like
PCA, are also used for feature extraction as in (Taylor
et al., 2016). Moreover, articles such as (Wang et al.,
2022; Siami et al., 2020) use stacked autoencoders to
extract features from vehicular telemetry data.
The paper presents a unique research approach
that focuses on handling unlabelled multimodal data.
Unlike similar works, the approach performs mul-
timodal reasoning by aligning unlabelled telemetry
data with the ground truth from neurophysiologi-
cal data analysis and applying a semi-supervised ap-
proach to relabel undefined data. The approach does
not involve feature fusion or manual or automatic
alignment, and it does not follow the statistical ap-
proach for feature extraction. In this proposed work,
to validate the model’s decision on unlabelled data,
two methods are used: counting samples utilizing
threshold value and prediction probability score, and
using Bayesian probability. The approach of multi-
modal reasoning is validated by the evaluation of con-
fidence.
3 MATERIALS AND METHODS
This section outlines the materials and research
methodology that includes both first-order and
second-order learning approaches. The methodology
consists of 8 steps, from raw data processing to the
validation of results, as illustrated in Figure 1.
3.1 Materials
In this research, the vehicular telemetry data was col-
lected from a simulator study. The research tool was
a driving simulator consisting of a real car seat, a real
dashboard with a steering wheel, manual gearshift,
pedals, and a display with three monitors providing
a 160° view. Thirty-four professional drivers with
normal or corrected-to-normal vision were recruited
to participate in the study. The experiment was con-
ducted following the principles outlined in the Dec-
laration of Helsinki of 1975, as revised in 2008. To
reduce the impact of mental fatigue, the experiment
took place in the afternoon. Each participant trained
for 15 minutes and then instructed to drive the vehi-
cle in the simulator for 45 minutes continuously ac-
cording to what was suggested by scientific literature
(Thiffault and Bergeron, 2003; Garc
´
ıa et al., 2010).
The simulator had two driving routes; the first 17 par-
ticipants drove on Route 1, and the remaining partic-
ipants drove on Route 2, and the speed limit was set
at 40 km/h. The trajectory of both driving routes is
presented in Figure 2.
3.2 First Order Learning
There are four steps involved in first-order learning:
raw data, exploratory data analysis, feature extraction,
and clustering. The following details each step.
Raw Data. Following the data collection process, a
preliminary analysis of telemetry data was conducted.
Out of 48 signals, 19 were selected for further anal-
ysis. Twenty-five signals with binary values of 0 and
1 were excluded due to their potential to cause over-
fitting. The timestamp is not used for analysis but
used for sorting and filtering data chronologically and
identifying anomalies or outliers. Additionally, GPS-
related signals were not included to improve the over-
all generalisability of the model.
Exploratory Data Analysis. After selecting the
signals, exploratory data analysis was carried out, and
high correlations between signals were identified. For
instance, a strong correlation of 0.98 was found be-
tween the signals speed forward and vehicle velocity.
Second-Order Learning with Grounding Alignment: A Multimodal Reasoning Approach to Handle Unlabelled Data
563
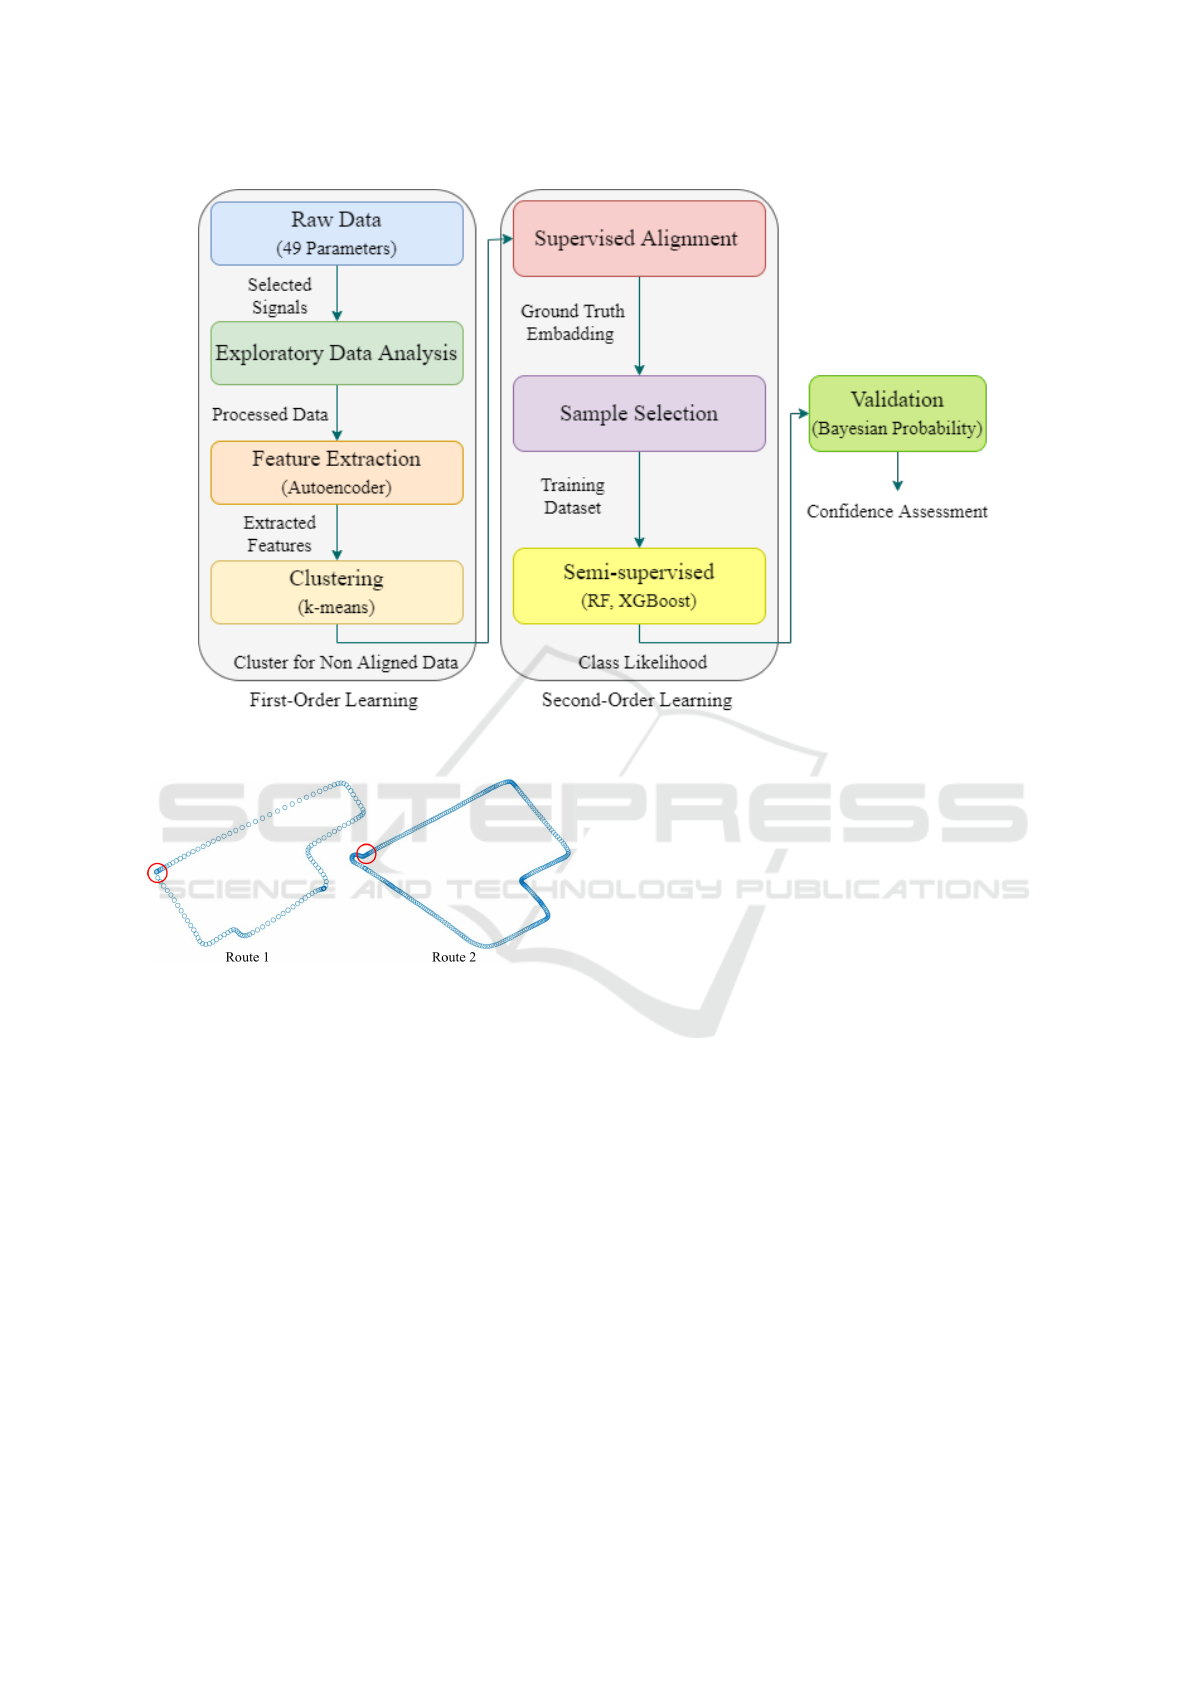
Figure 1: A multimodal reasoning framework of second-order learning paradigm.
Figure 2: Vehicle driving routes with start and end positions
marked by a red circle for each lap.
Only four out of the 19 selected signals had a corre-
lation of less than 0.30. After completing the anal-
ysis, the processed dataset had a final dimension of
19 × 85975, where 19 represents the number of sig-
nals, and 85975 represents the number of samples.
Feature Extraction. The dataset has a multi-
collinearity problem due to most of the correlated sig-
nals, which can reduce the predictive power and gen-
eralization of a model (Li and Vu, 2015). There are
various ways to address this issue, such as selecting
one from correlated signals and identifying the im-
portant signals. However, these methods may exclude
important information and can not be applied because
the data collected for this study has no ground truth.
To address this issue, an autoencoder is used as an un-
supervised feature extraction method. It is preferred
over other methods as it captures non-linear relation-
ships in data and learns lower-dimensional represen-
tations. The purpose of using the autoencoder is to
represent a dataset of correlated signals in a latent
space where each one will have less correlation.
Autoencoders were originally introduced in
(Rumelhart et al., 1985) as a type of neural network
that is specifically designed to reconstruct its input.
The main purpose of the autoencoders is to provide
an informative representation of the data, which can
be used for various implications like clustering (Bank
et al., 2023). The autoencoder can be presented by the
equation below,
a = g(W
d
, b
d
; f (W
e
, b
e
;x)) (1)
In Equation 1, the encoder and decoder are rep-
resented by f (·) and g(·), respectively. The output
of the encoder f (·) is the latent space representation,
which later serves as input to the decoder g(·). The
weight matrices for the encoder and decoder are de-
noted by W
e
and W
d
, while d
e
and d
d
represent the
bias vectors for the encoder and decoder, respectively.
This paper uses a vanilla sparse autoencoder model,
and its summary is presented in Table 1. The en-
coder includes the input layer up to dense layer 2,
while the remaining layers represent the decoder. The
last layer of the encoder (dense 2), which is the out-
put of the encoder, has 7 units. L1 regularization
with value 1e
−4
is added with this layer, which adds
a penalty for non-sparse representations and encour-
ICAART 2024 - 16th International Conference on Agents and Artificial Intelligence
564

ages the model to learn sparse representation of the
input data in the latent space. Early stopping criteria
are used on validation loss where the value of patience
is 10 and min delta is 0.0001. Seven features were
derived from the encoder part as the output shape of
the last encoder layer is 7, and the number of samples
remains the same as the input.
Table 1: Summary of the autoencoder model.
Layers Output Shape Param
input (Input Layer) None, 19 0
dense (Dense) None, 12 240
dense 2 (Dense) None, 7 91
dense 3 (Dense) None, 12 96
dense 4 (Dense) None, 19 247
Total params: 674
Trainable params: 674
Clustering. Since there is no ground truth avail-
able for the collected telemetry data, the encoded data
is segregated using the clustering approach. The k-
means clustering algorithm is used in this research
paper, which is preferred over others due to its sim-
plicity, convenience, and efficiency, especially when
dealing with a large dataset (Hu et al., 2023; Na et al.,
2010). Here, the number of clusters selected for de-
veloping the k-means is 3, determined using the el-
bow method. Apart from the number of clusters, the
values for other hyperparameters are set to their de-
fault values, such as max iter is 300, n init is 10, and
init is k-means++. Results after applying the k-means
cluster algorithm discussed in section 4.
3.3 Second Order Learning
Supervised alignment, sample selection, and semi-
supervised learning are the three steps of second-
order learning. Details for each step are provided be-
low.
.Supervised Alignment. The clustering algorithm
produced a good result, with distinctive separation
between data points and only a few overlaps. How-
ever, without ground truth, it’s impossible to iden-
tify the meaning of each cluster. To overcome this
challenge, the study employed the multimodal align-
ment approach, which looks for relationships between
instances from two or more modalities (Baltru
ˇ
saitis
et al., 2018). Specifically, the supervised alignment
technique was used, where data are aligned with la-
bels from different sources to guide the alignment
process (Huang et al., 2023).
As vehicular telemetry data was being collected,
neurophysiological data was also captured simultane-
ously. Experts in the field evaluated this data and as-
signed labels to each minute. These labels were gen-
erated using mind drowsiness and the eye blink rate
index. The process of assigning these labels can be
found in the following article (Di Flumeri et al., 2022;
Di Flumeri et al., 2016). Binary values were used to
label the data, with 0 indicating high and 1 indicating
low mental fatigue. Before aligning the labels with
the encoded features, the minutes that the expert does
not label for mind drowsiness and eye blink rate are
labelled as 2. Afterwards, alignment is performed,
fusing the encoded features and labels. This helps
establish a relationship between vehicular telemetry
data and neurophysiological data.
Sample Selection. After the alignment process, a
similarity check is performed between the cluster la-
bels and the labels of drowsiness and eye-blink rate.
Out of 85975 encoded samples, the labels of 37429
samples are correctly matched with mind drowsi-
ness, while the labels of 36679 samples are correctly
matched with eye-blink rate. Among the labels of
37429 samples matched with mind drowsiness, the la-
bel of 2898 samples is categorized into labels 0 and 1,
whereas the rest are labelled as 2. Similarly, among
the labels of 36679 samples matched with the eye-
blink rate, 2341 samples belong to labels 0 and 1, and
the rest belong to label 2. Therefore, a total of the la-
bel of 2898 samples of mind drowsiness and label of
2341 samples of eye-blink rate were merged together,
and after dropping duplicates, a total of 5055 encoded
samples were used for further processing.
Semi-Supervised Learning. The dataset, compris-
ing 5055 encoded samples related to mind drowsiness
and eye blink rate with labels 0 and 1, can be consid-
ered a labelled dataset and is suitable for binary clas-
sification. However, there is a concern regarding the
samples labelled as 2. This is because they do not nec-
essarily indicate low or high levels of mental fatigue.
Specifically, 34531 out of 37429 samples are related
to mind drowsiness, and 34338 out of 36679 are re-
lated to eye blink rate. To address this issue, a semi-
supervised learning approach is being employed.
In machine learning, a common challenge is deal-
ing with large amounts of unlabelled data, and one
way to address this is through semi-supervised learn-
ing, which combines labelled and unlabelled data for
building a good classifier (Zhu, 2005). The self-
training approach has been employed in this study
from a range of semi-supervised techniques. In this
approach, a supervised classifier is first trained on
a small amount of labelled data. Then, the trained
model is used to predict the labels for the unlabelled
Second-Order Learning with Grounding Alignment: A Multimodal Reasoning Approach to Handle Unlabelled Data
565

data. The most confident predictions are then added
to the labelled data to re-train the model. To imple-
ment the self-training approach, the labelled dataset
of 5055 encoded samples was utilized and classified
using the RF and XGBoost algorithms. The results
show an accuracy of 98% and 97% using RF and
XGBoost, respectively. The default hyperparameters
used to build the RF and XGBoost are presented in
Table 2.
Table 2: Hyperparameters used in RF and XGBoost for
classifying.
Classifier Models Hyperparameters Details
Random Forest n estimators : 100
criterion : gini
min sample split : 2
min sample leaf : 1
XGBoost n estimators : 100
learning rate : 0.3
eval metric : logloss
booster : gbtree
The samples labelled 2 were used to create an un-
labelled dataset. Rather than including all, the fo-
cus was on 34531 samples related to mind drowsi-
ness out of 37429 total samples. This resulted in
a final unlabelled dataset of 34531 samples. The
dataset was used to test both trained models. Based
on the probability of prediction, the unlabelled sam-
ples were labelled according to their class. The la-
belled samples were then merged with the prior la-
belled dataset, which consisted of 5055 samples, to
retrain the model. The retrained models produced ex-
cellent test accuracy results of over 98%.
3.4 Validation
The probability prediction score for both classes is
analyzed to determine whether an undefined sample
should be relabeled as 0, indicating high or 1, indicat-
ing low mental fatigue. This analysis helps determine
the confidence of the model. In this paper, two ap-
proaches were used to validate the model’s confidence
percentage.
In the first approach, to determine the confidence
of a model, the prediction probability distribution of
any class on unlabelled samples is first selected. Next,
two threshold values are defined by analyzing the
probability score. These threshold values are then
used to create a condition that counts the number of
samples that satisfy it. The percentage of samples that
satisfy the condition can be considered as the confi-
dence of the model. For instance, suppose there are
two threshold values, 0.7 and 0.4, both chosen by ana-
lyzing the prediction probability score. The condition
is to count the number of samples that have a proba-
bility score greater than 0.7 or less than 0.4. The total
number of samples that satisfy this condition is used
to calculate the percentage. Algorithm 1 presents the
first approach in pseudo-code.
Algorithm 1: Evaluating model confidence on unla-
belled data using model’s probability score.
Data: unlabelledDataset - Unlabelled dataset
Result: Percentage of sample meets the
confidence criteria
Assume: Model is already trained on labelled
dataset
probabilities ← Predictions(unlabelledData)
Determine thresholdLow, thresholdHigh from
probabilities
satis f yingSamples ← 0
foreach probability in probabilities do
if probability ≤ thresholdLow or
probability ≥ thresholdHigh then
satis f yingSamples ←
satis f yingSamples + 1
end
end
return (
satis f yingSamples
length(unlabelledData)
) × 100
The second approach used to validate the model’s
confidence is the Bayesian probability, which is a sys-
tematic method for updating beliefs based on new ev-
idence (Meyniel et al., 2015). It calculates the poste-
rior probability using the Bayesian theorem. Since
there are two classes, 0 and 1, the posterior prob-
ability for a sample is calculated for both classes.
Then, it is compared with the prediction probability
score. Counting the similarity of each sample be-
tween prediction probability and posterior probabil-
ity, the confidence is calculated. Algorithm 2 presents
the pseudo-code for the second approach.
4 RESULTS
4.1 Results from First-Order Learning
Prior to inserting the data for feature extraction,
Min-Max Normalization is performed to ensure
that all signals are scaled to a similar range, re-
sulting in better performance. Following this,
the normalised data is passed through the autoen-
coder for feature extraction. The autoencoder
training process had a total of 300 epochs, but it
stopped at epoch 46 due to early stopping criteria
ICAART 2024 - 16th International Conference on Agents and Artificial Intelligence
566
Algorithm 2: Evaluating model confidence on unla-
belled data using Bayesian probability.
Data: unlabelledData - Dataset
Result: Percentage of consistent samples
Assume: Model is already trained on labelled
dataset
probabilities ← Predictions(unlabelledData)
posteriors ← BayesianPosterior(probabilities,
Prior)
consistent ← 0
foreach sample in unlabelledData do
Extract probClass0, probClass1 from
probabilities of sample
Extract posteriorClass0, posteriorClass1
from posteriors of sample
if (probClass0 > probClass1 and
posteriorClass0 > posteriorClass1) or
(posteriorClass0 < posteriorClass1 and
posteriorClass0 < posteriorClass1) then
consistent ← consistent +1
end
end
return (
consistent
length(unlabelledData)
) × 100
being met. The validation loss did not show any
improvement greater than 0.0001 over the last 10
epochs, from epoch 37 to 46. This satisfied the
conditions for early stopping with ’patience=10’ and
’min delta’ = 0.0001. Therefore, based on the trend
of training and validation loss and early stopping cri-
teria, the model effectively converged by epoch 46.
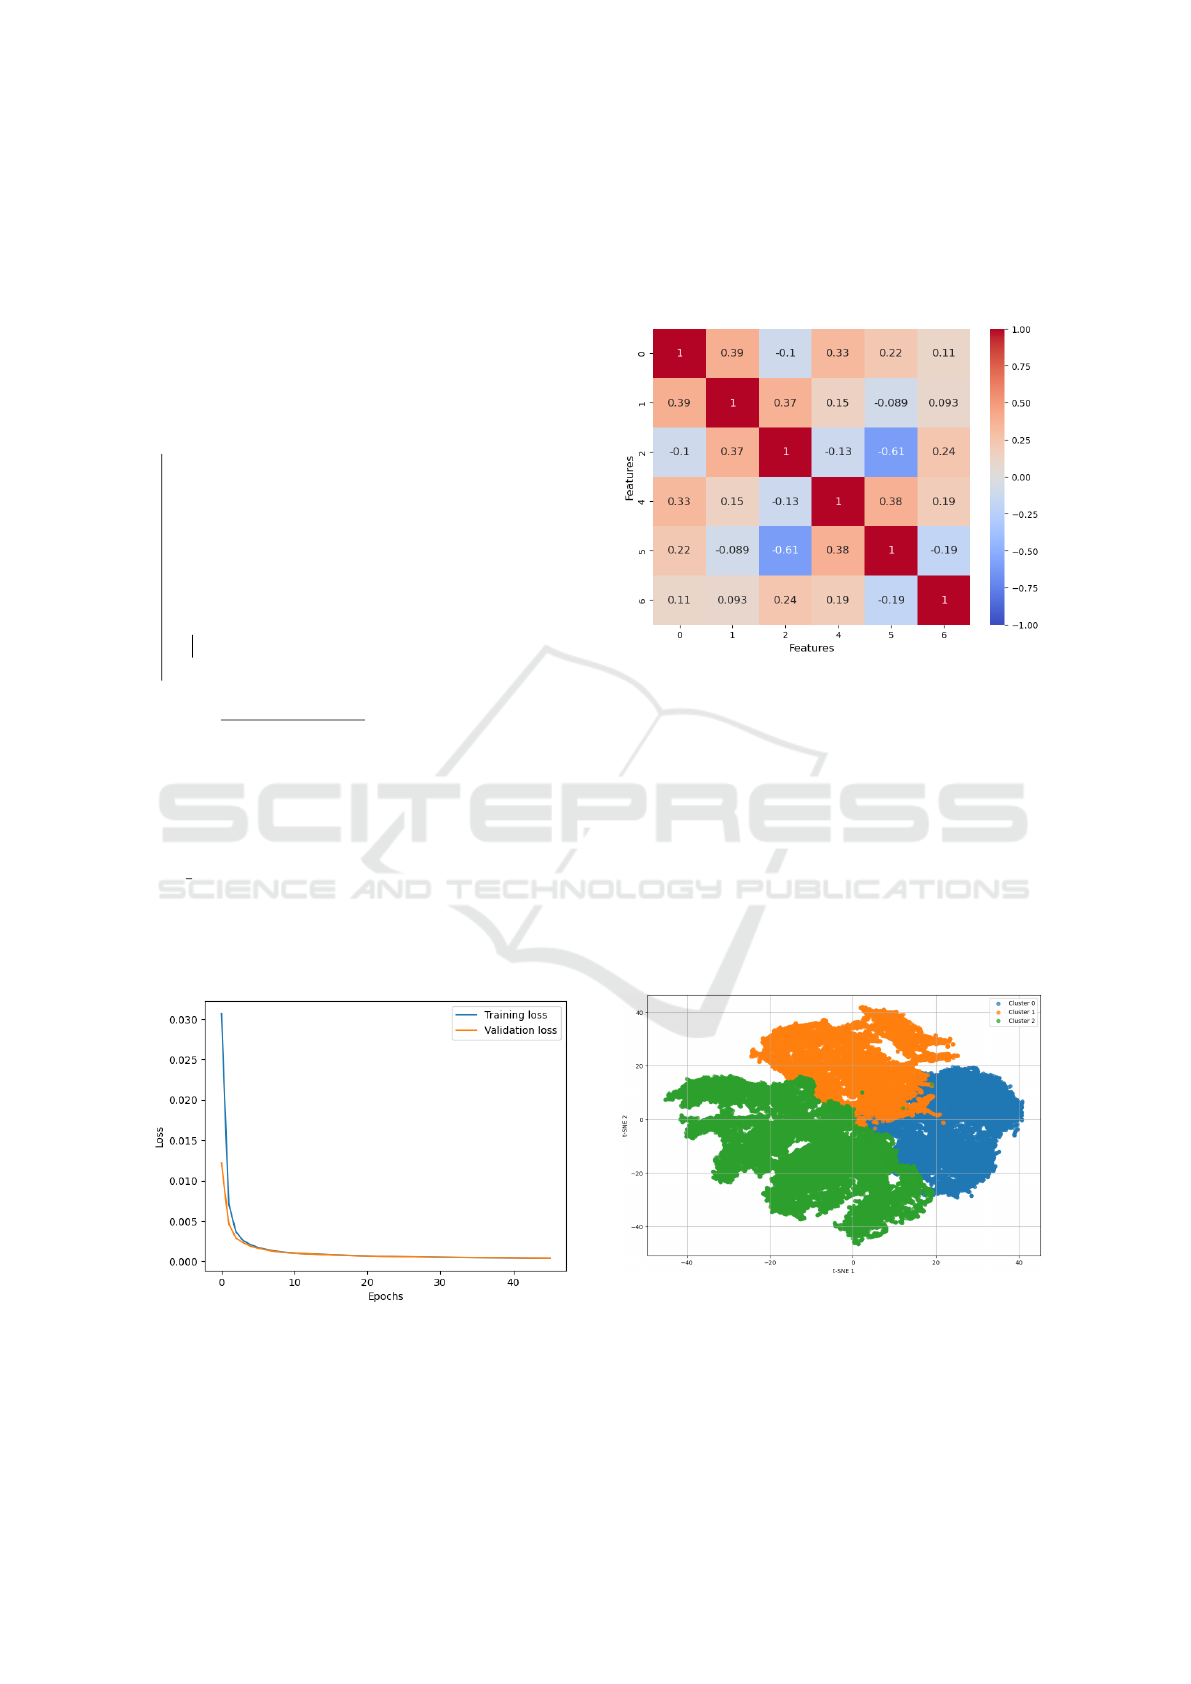
Figure 3 displays the training and validation loss with
epoch.
Figure 3: Traning and validation loss of autoencoder.
Once the training process was completed, the en-
coder part produced seven features. The final dimen-
sion of the extracted dataset is 7 × 85975. The cor-
relation between the extracted features was analysed,
and Figure 4 shows the correlation matrix of the ex-
tracted features. From the figure, it can be observed
that there is no evidence of strong linear dependency
between any pair of features.
Figure 4: Correlation matrix of encoded features.
The extracted dataset cannot be labelled as there
is no ground truth available. So, to extract meaning,
the dataset was clustered using the k-means algorithm
with a value of k equal to 3. The resulting clusters
were visualised using t-SNE, a popular tool for dis-
playing data in a two-dimensional scatter plot. Figure
5 shows the 2D t-SNE visualisation of the clustered
result. From the figure, it is evident that all three clus-
ters are well separated from each other. Cluster 2 has
the highest number of data points, while the maxi-
mum number of data points overlaps between clusters
0 and 1.
Figure 5: Clusters in 2D t-SNE space.
Second-Order Learning with Grounding Alignment: A Multimodal Reasoning Approach to Handle Unlabelled Data
567
4.2 Results from Second-Order
Learning
Although the clusters are separated, the problem of
identifying the meaning of each cluster still persists.
To address this issue, a supervised alignment process
was conducted, and a set of samples were selected
for semi-supervised learning. Detailed information
about the alignment process and sample selection can
be found in subsection 3.3 of section 3.
Afterwards, a self-training approach was em-
ployed for the unlabelled dataset. This was accom-
plished by initially using the random forest and XG-
Boost algorithms to classify the labelled dataset of
5055 samples. The data was split into a train and
test set with an 80% and 20% distribution, respec-
tively. When splitting the dataset into train and test,
a chronological approach was used due to the related
time stamps of each sample, which were dropped dur-
ing analysis. The approach assigned data from ear-
lier time points to the training set, while data from
later time points were reserved for the testing set.
This method was carefully selected to ensure that the
model was trained on historical data and tested on fu-
ture, unseen data. The results of the classification are
presented in Table 3. The test accuracy of the RF
algorithm was found to be 0.98, while the XGBoost
algorithm exhibited a test accuracy of 0.97. Both al-
gorithms had the same train accuracy and F
1
scores
based on test predictions, which were identical to the
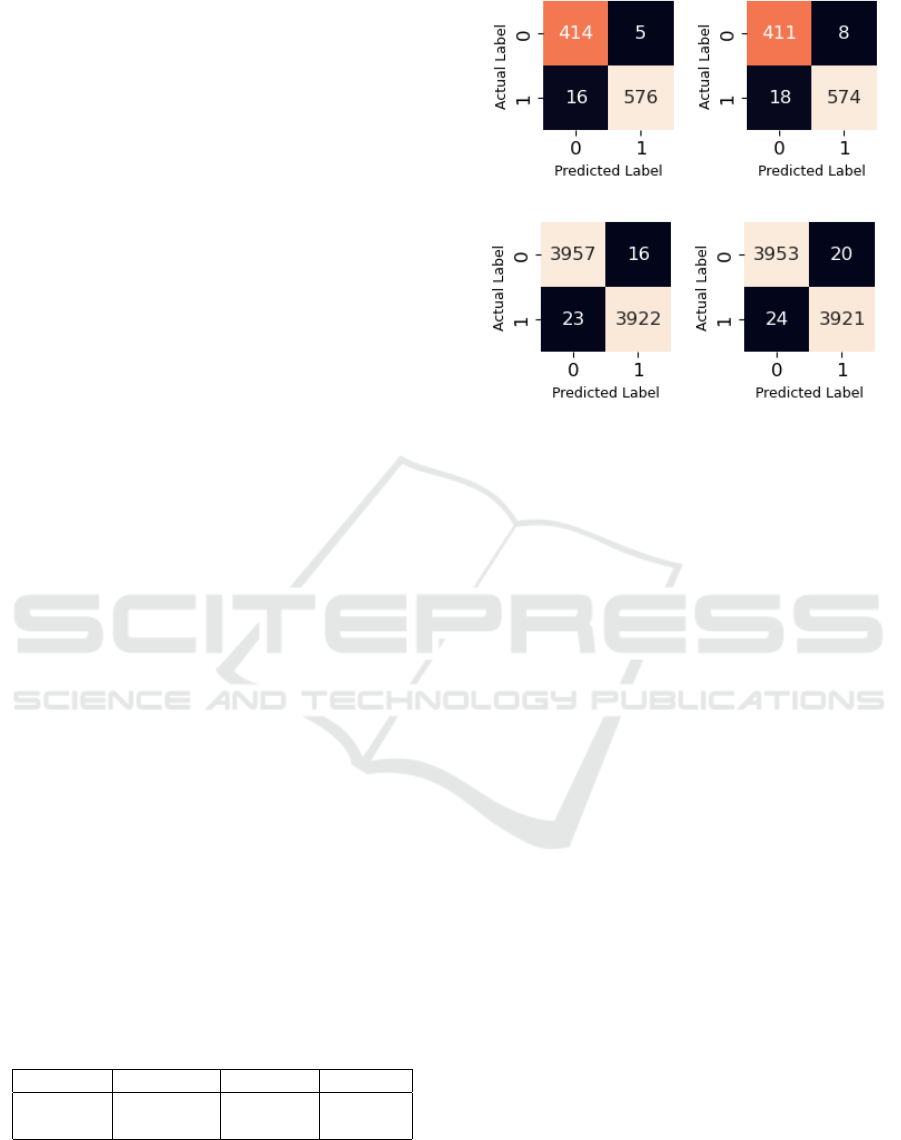
test accuracy. The confusion matrix on test data for
RF and XGBoost is presented in Figure 6 where 6a
for RF and 6b for XGBoost.
Following the successful classification, the unla-
belled dataset of 34531 samples to mind drowsiness
was used in both models to obtain probabilities. The
probability scores were then used to determine which
class the samples belonged to and labelled them ac-
cordingly. After relabeling those 34531 samples, they
were merged with the labelled dataset of 5055 sam-
ples. Both models were rerun, and the resulting test
accuracy using RF and XGBoost was 0.99. The con-
fusion matrix for both models is presented in Figure
6c and 6d.
Table 3: Result of the classification.
Method Train Acc. Test Acc. F
1
Score
RF 0.99 0.98 0.98
XGBoost 0.99 0.97 0.97
(a) RF (b) XGBoost
(c) RF (d) XGBoost
Figure 6: On the test data, confusion matrices of RF and
XGBoost are shown. (a) and (b) use labelled dataset, and
(c) and (d) use merged dataset.
4.3 Results of Validation
The performance of RF and XGBoost models was
validated, and their confidence was also determined.
The probability distribution of 34631 samples was
analysed to determine the confidence level. Since
there were two classes, analysing the probability dis-
tribution of samples of one class was enough. Fig-
ure 7 shows the distribution of predicted probabilities
of all samples for class 1. After analysis, two prob-
ability scores were used to split samples and calcu-
late the confidence. Figure 7a shows the distribution
of predicted probabilities for class 1 using RF, and
two probability scores, 0.45 and 0.75, were used to
split the samples. Samples with a probability score
of 0.75 or higher and a probability score of 0.45 or
lower, were considered together, giving the RF model
a confidence level of 91.26%. The same procedure
was followed for XGBoost. Figure 7b shows that
the two probability scores used for XGBoost were
0.20 and 0.80, and together, gave the XGBoost model
a confidence level of 97.87%. Bayesian probability
was used to evaluate the confidence level of both RF
and XGBoost models. The posterior probability for
both classes was calculated for RF and XGBoost, and
the similarity was performed between probability and
posterior probability. RF model received a score of
98.67%, and the XGBoost model received a score of
99.77%.
ICAART 2024 - 16th International Conference on Agents and Artificial Intelligence
568
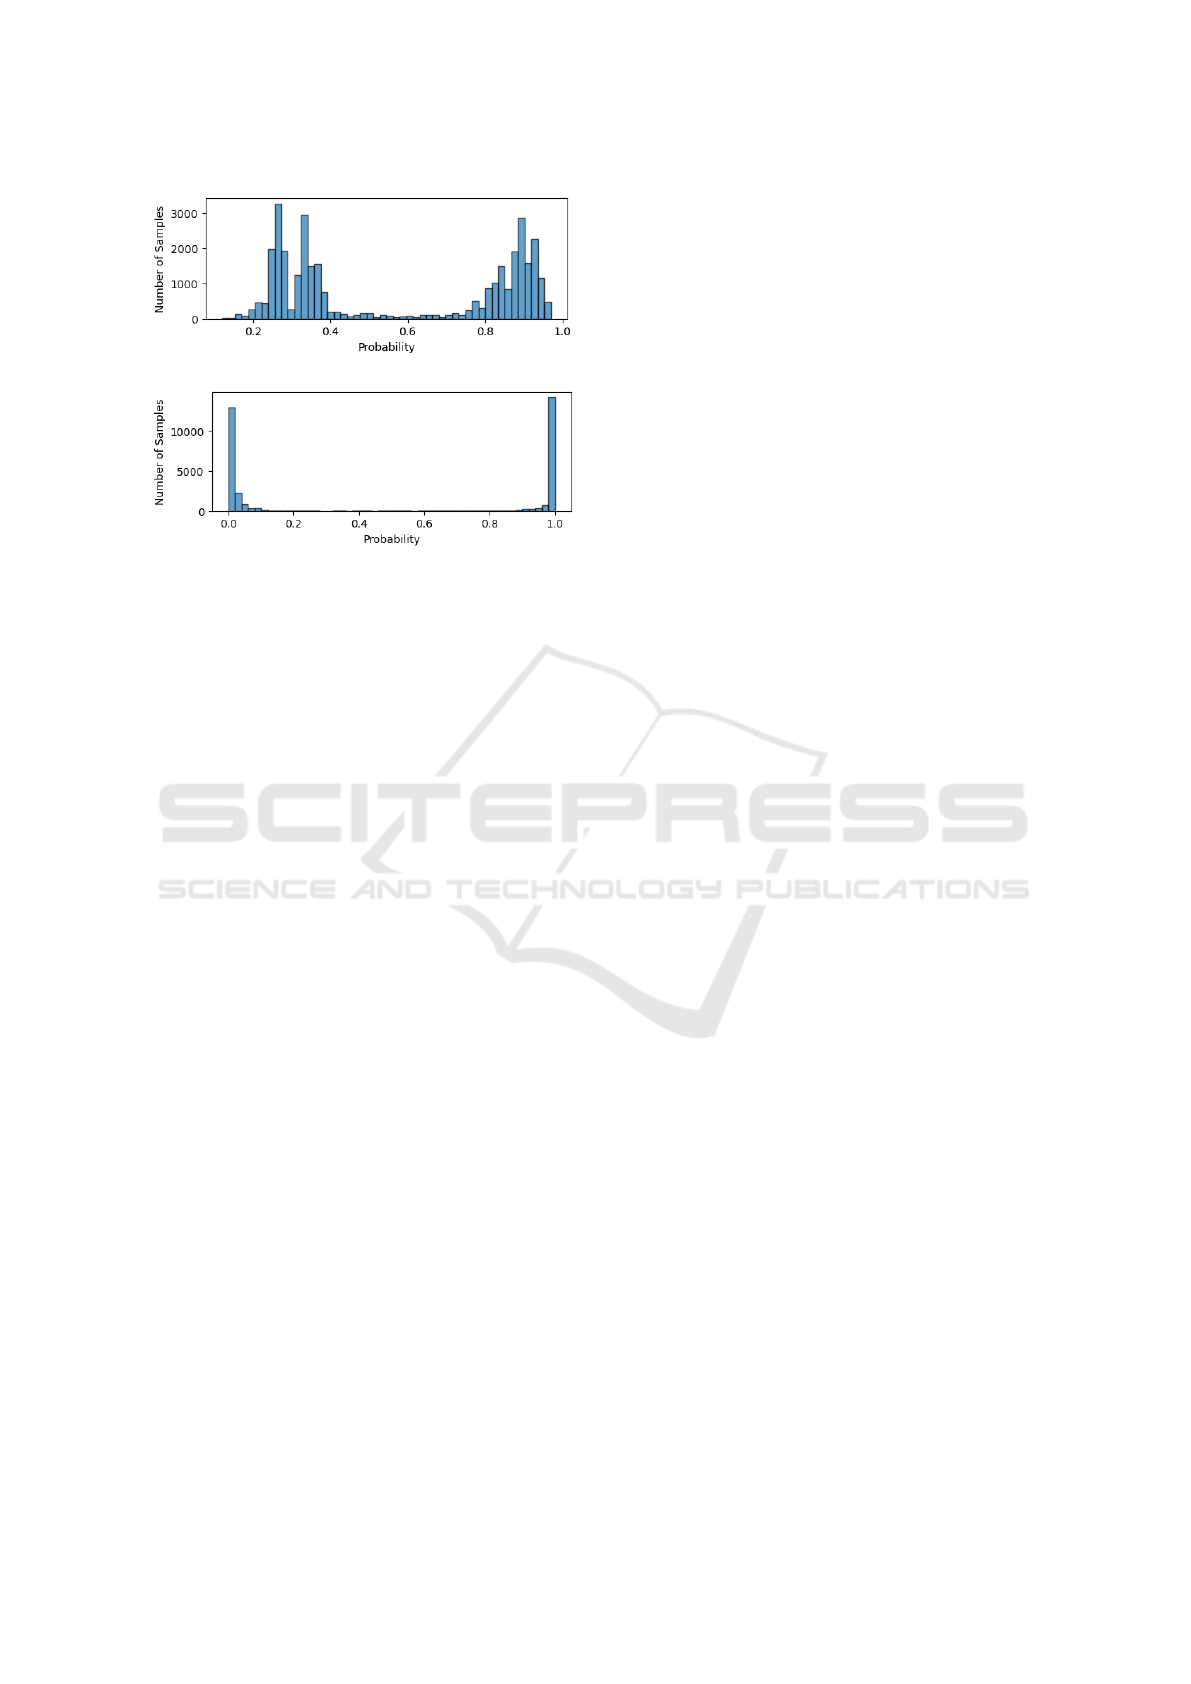
(a)
(b)
Figure 7: Distribution of predicted probabilities of class 1
where (a) represents RF and (b) represents XGBoost.
5 DISCUSSION AND
CONCLUSIONS
In this section, the article discusses its findings and
provides a conclusion along with suggestions for fu-
ture work.
5.1 Discussion
Multimodal machine learning faces significant chal-
lenges when it comes to effectively handling unla-
belled data. These challenges include the absence of
ground truth for validation, difficulties in feature ex-
traction, and the need for advanced modelling tech-
niques. The main objective of this research is to
use a multimodal reasoning approach to overcome
these challenges. The approach has two phases: first-
order and second-order learning. To address the chal-
lenge of analysing complex, unlabeled data with high
dimensionality, an autoencoder was used in the ap-
proach for feature extraction in first-order learning.
In the second-order learning, Supervised alignment
techniques were employed to ensure an accurate rep-
resentation of the relationships between different data
modalities. Finally, the approach incorporates semi-
supervised learning, which leverages the extracted
features from the autoencoder and the insights gained
from alignment to enable effective decision-making
for unlabeled data. The inspiration for this approach
is derived from (Liang et al., 2023). This compre-
hensive multimodal reasoning approach contributes to
mitigating the challenges associated with unlabeled
multimodal data and leverages their intrinsic value,
leading to more accurate and reliable analysis. The
approach was demonstrated using unlabelled vehicu-
lar telemetry data.
At the beginning unlabelled vehicular telemetry
data was fed into an autoencoder to extract features,
making it more manageable and insightful for anal-
ysis. Simplifying complex telemetry data and mak-
ing it easier to analyse is crucial. Different prior
works used different autoencoders for feature extrac-
tion from vehicular telemetry data. A vanilla sparse
autoencoder was employed here, summarised in Ta-
ble 1. This type of autoencoder offers several bene-
fits, including efficient reduction of data dimensional-
ity, feature selection, anomaly detection, noise reduc-
tion, and learning of robust features for better gener-
alisation. However, it has certain drawbacks, such as
a limited capacity to handle highly complex or non-
linear data and the potential for overfitting. Despite
these limitations, the advantages of vanilla sparse au-
toencoder make it an excellent choice for data anal-
ysis. It contributes here as knowledge representa-
tion by capturing non-linear relationships and learn-
ing from lower-dimension representations in vehicu-
lar telemetry data. The main objective of building this
autoencoder was to obtain features with less correla-
tion since the correlation between signals in the raw
data is high. There is no fixed rule to determine how
many features can be obtained. After experimenting
with different kinds of layers, output shapes, and tun-
ing hyperparameters, this model was finalised with
seven encoded features. From Figure 3 and 4, it can
be concluded that the model learns the underlying pat-
terns of the data well and provides features with low
correlation.
The captured telemetry data does not have a true
label, which means that the extracted data cannot be
labelled either. However, in order to process the ex-
tracted data, a clustering algorithm was used to reveal
any hidden patterns and make them more manageable
by grouping them. The k-means clustering algorithm
was chosen over more complex alternatives, such as
DBSCAN or hierarchical clustering, because of its
simplicity, efficiency, and scalability, especially when
dealing with large datasets. Despite its limitations,
including sensitivity to initial centroid placement and
the requirement for predefined cluster numbers, k-
means clustering is often preferred due to its ability
to provide clear insights in various contexts, making
it a reliable tool in data analysis. Figure 5 displays
the clustering result, which shows that all data points
are separated into three distinct groups with few over-
laps. Although these three clusters do not inherently
hold any meaning, their separation suggests some un-
derlying relationships exist between the data points.
Second-Order Learning with Grounding Alignment: A Multimodal Reasoning Approach to Handle Unlabelled Data
569
To solve this problem, a supervised alignment ap-
proach was applied, and it was performed between ve-
hicle telemetry data and the true labels from the neu-
rophysiological data analysis. The main reason be-
hind aligning these two is because both data are col-
lected simultaneously during the experiment of each
participant. The contribution of the supervised align-
ment lies in its ability to transfer knowledge from
neurophysiological data to vehicular telemetry data,
thereby enhancing the learning process. The process
of the alignment is described in subsection 3.3 of sec-
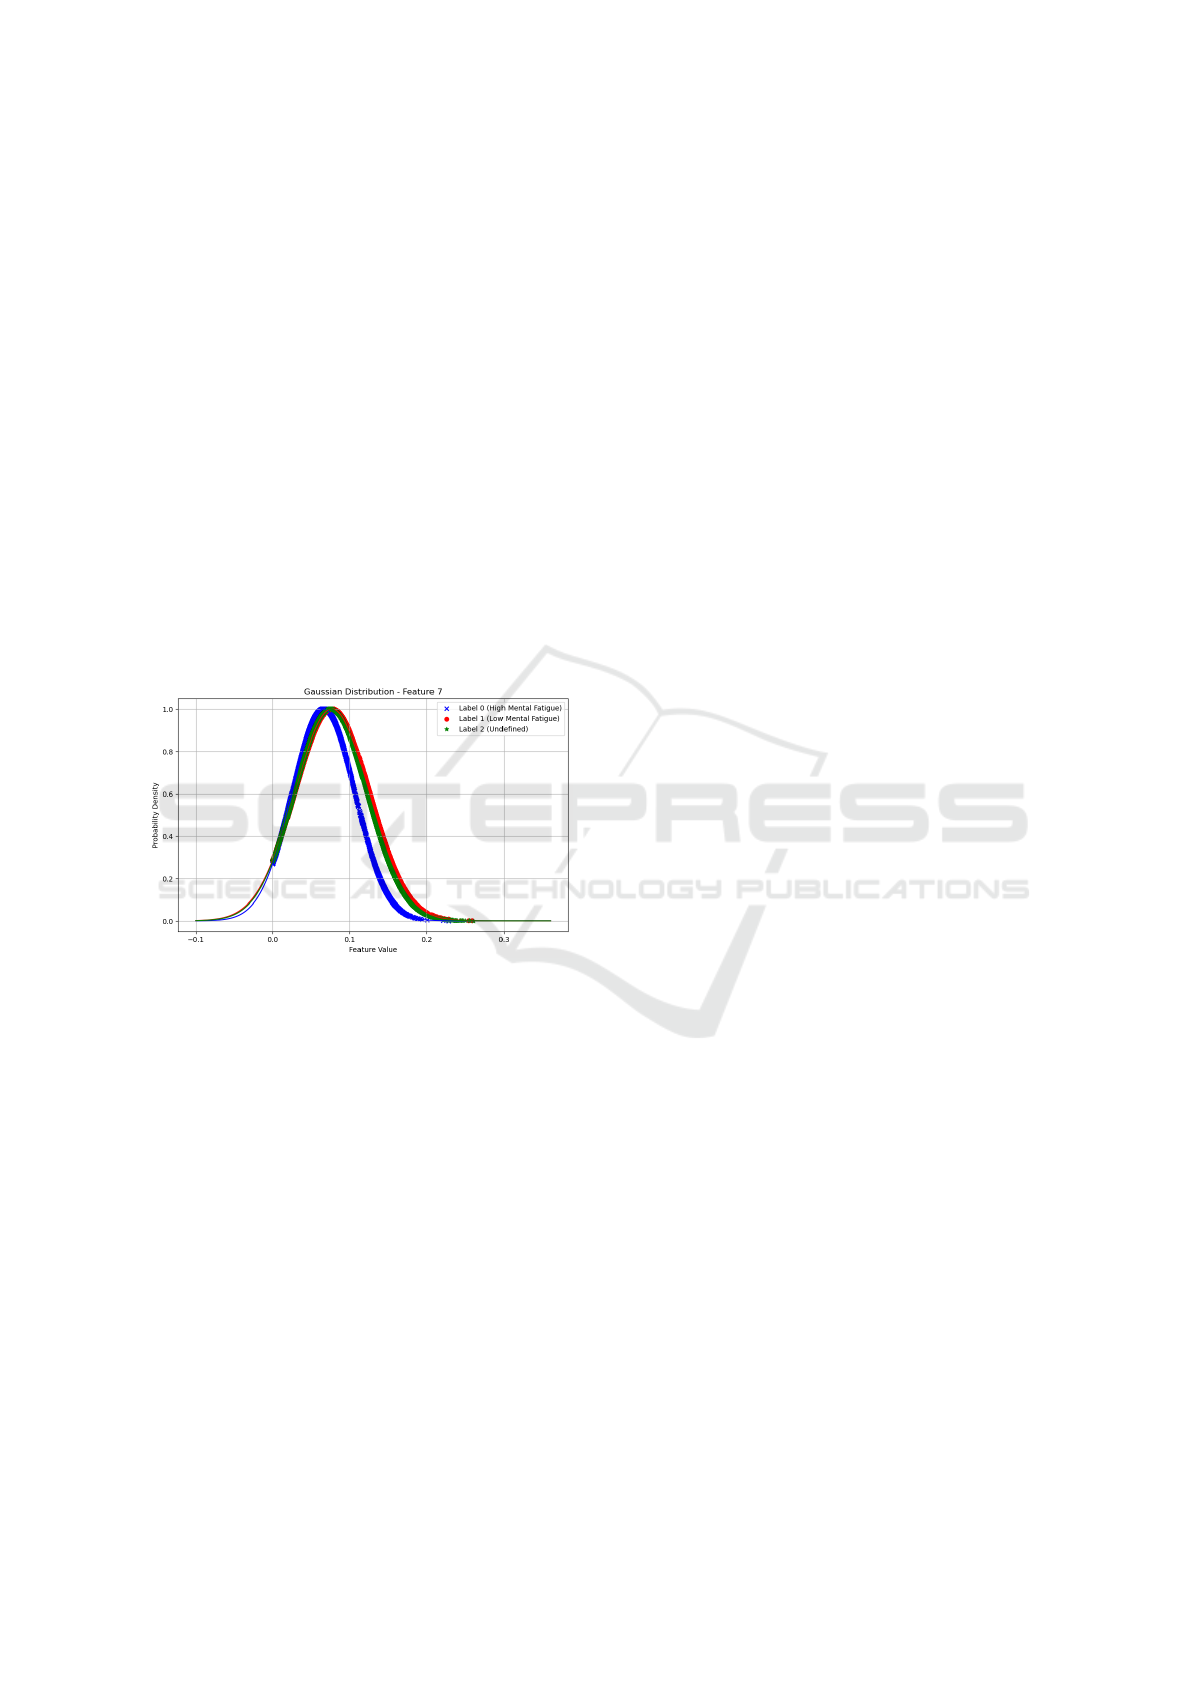
tion 3. After aligning the encoded features and labels,
it becomes apparent that there is an overlap between
each class. Figure 8 displays the Gaussian distribu-
tion of samples of feature six into three classes where
the labels of the mind drowsiness data were aligned
with the encoded features. From the figure, it is clear
that samples labelled as 2, which are undefined, are
situated between the samples labelled as 0 and 1 (0
means high mental fatigue, and 1 means low mental
fatigue).
Figure 8: Example of overlapping of three classes consider-
ing one feature ( Feature no 7).
The observation in Figure 8 suggests that the clas-
sification of the aligned dataset may not effectively
assign meaning to undefined samples labelled as 2.
The semi-supervised approach was chosen to address
the problem because it makes optimal use of the lim-
ited labelled data for initial training, and then further
improves the model’s performance and accuracy by
incorporating a larger pool of unlabelled data. This
offers a more comprehensive learning approach com-
pared to other methods like active learning or trans-
fer learning. Prior to the semi-supervised approach, a
sample selection process was carried out (as described
in subsection 3.3 of section 3), in which 5055 sam-
ples labelled as 0 and 1(high and low mental fatigue)
were chosen. At the beginning of the semi-supervised
approach, RF and XGBoost algorithms were used to
classify labelled samples, achieving over 96% accu-
racy on test data. The unlabelled dataset of 34531
samples was labelled based on the prediction proba-
bility score obtained from testing it on trained RF and
XGBoost. The newly labelled dataset was combined
with the previously labelled one, and binary classifi-
cation was performed where both RF and XGBoost
achieved over 99% accuracy on test data. More infor-
mation about the results can be found in Table 3, and
the confusion matrix for the test data for both models
can be found in Figure 6. The contribution of semi-
supervised learning is based on the satisfactory results
it has achieved, which can be observed in two signif-
icant ways. Firstly, it validates the reliability and ef-
fectiveness of RF and XGBoost models in accurately
classifying data. Secondly, it highlights the potential
of semi-supervised techniques in efficiently utilising
a combination of labelled and unlabelled data.
Validating the model’s confidence in its prediction
is crucial. The validation procedure is explained in
subsection 3.4 of section 3. Two approaches are taken
to validate the confidence. The first approach focuses
on validating how accurately the models can predict
the class of unlabelled samples by using thresholds to
evaluate the decisiveness of the model’s predictions.
It is an effective way to measure the model’s perfor-
mance on unlabelled data, using probability scores as
a metric of confidence. The second approach utilises
Bayesian probability to validate the model’s predic-
tions by comparing the initial prediction probabilities
with posterior probabilities. This technique provides
a more nuanced perspective of the model’s confidence
in its classifications, and it quantifies the level of cer-
tainty across the dataset. Algorithms 1 and 2 present
the pseudo-code for the first and second approaches,
respectively.
The multimodal reasoning approach used in this
research to handle unlabeled data has shown great
promise for cross-domain applications. It is a
highly efficient approach that involves combining and
analysing data from various sources. It is a versa-
tile strategy that can be adapted to different indus-
tries. For example, in healthcare, it can be used to
integrate different patient data, while in environmen-
tal studies, it can help to integrate diverse ecological
data sets. The principles of multimodal reasoning re-
main applicable and effective in various fields. The
capacity to extract valuable insights from heteroge-
neous and unlabeled data sources has immense im-
plications, furnishing a sturdy foundation for multi-
ple industries that confront comparable issues of data
integration and analysis. This method establishes a
standard template for future investigation and appli-
cations, highlighting the possibilities of multimodal
reasoning to promote innovative solutions in diverse
fields where data is abundant but often not unambigu-
ICAART 2024 - 16th International Conference on Agents and Artificial Intelligence
570

ously defined.
6 CONCLUSIONS
A multimodal reasoning approach was used in this
study to address the challenges of processing unla-
beled data in multimodal machine learning. The ap-
proach involved feature extraction using an autoen-
coder in first-order learning, followed by a supervised
alignment application and semi-supervised learning
to manage and analyse complex, unlabeled datasets
in second-order learning. The effectiveness of this ap-
proach was demonstrated by its application on unla-
belled vehicular telemetry data. The accuracy scores
of RF and XGBoost on the labelled dataset were over
97%, and after relabeling the unlabelled data and
merging it with the previously labelled data, the accu-
racy score significantly increased to 99%. To evaluate
the confidence of the model’s predictions, counting
samples of prediction probability were used by setting
a threshold and Bayesian probability. In both cases,
the results were satisfactory. The findings conclude
that the proposed multimodal reasoning approach ex-
tracted meaningful insights and highlighted the poten-
tial for enhancing data analysis in various domains.
This research offers a valuable foundation for fur-
ther study exploring the potential of a multimodal rea-
soning approach in other fields, such as healthcare,
environmental science, and biomedical research. To
improve the handling and analysis of complex, mul-
timodal datasets with a high proportion of unlabelled
data, future research could focus on implementing ad-
vanced techniques for more sophisticated feature ex-
traction and enhancing semi-supervised learning.
ACKNOWLEDGEMENTS
This work was supported in part by the project Fit-
Drive (This project has received funding from the Eu-
ropean Union’s Horizon 2020 research and innovation
programme under grant agreement No 953432).
REFERENCES
Aboah, A., Adu-Gyamfi, Y., Gursoy, S. V., Merickel, J.,
Rizzo, M., and Sharma, A. (2023). Driver maneuver
detection and analysis using time series segmentation
and classification. Journal of transportation engineer-
ing, Part A: Systems, 149(3):04022157.
Alhamdan, H. and Jilani, M. (2019). Machine learning for
automobile driver identification using telematics data.
In Advances in Data Science, Cyber Security and IT
Applications: First International Conference on Com-
puting, ICC 2019, Riyadh, Saudi Arabia, December
10–12, 2019, Proceedings, Part I 1, pages 290–300.
Springer.
Alvarez-Coello, D., Klotz, B., Wilms, D., Fejji, S., G
´
omez,
J. M., and Troncy, R. (2019). Modeling dangerous
driving events based on in-vehicle data using random
forest and recurrent neural network. In 2019 IEEE
Intelligent Vehicles Symposium (IV), pages 165–170.
IEEE.
Baltru
ˇ
saitis, T., Ahuja, C., and Morency, L.-P. (2018). Mul-
timodal machine learning: A survey and taxonomy.
IEEE transactions on pattern analysis and machine
intelligence, 41(2):423–443.
Bank, D., Koenigstein, N., and Giryes, R. (2023). Autoen-
coders. Machine Learning for Data Science Hand-
book: Data Mining and Knowledge Discovery Hand-
book, pages 353–374.
Barua, A., Ahmed, M. U., and Begum, S. (2023). Multi-
scale data fusion and machine learning for vehicle ma-
noeuvre classification. In 2023 IEEE 13th Interna-
tional Conference on System Engineering and Tech-
nology (ICSET), pages 296–301.
Cassias, I. and Kun, A. L. (2007). Vehicle telematics: a
literature review. Univ. New Hampshire, Durham, NH,
USA, ECE. P, 54.
Di Flumeri, G., Aric
`
o, P., Borghini, G., Colosimo, A., and
Babiloni, F. (2016). A new regression-based method
for the eye blinks artifacts correction in the eeg signal,
without using any eog channel. In 2016 38th Annual
International Conference of the IEEE Engineering in
Medicine and Biology Society (EMBC), pages 3187–
3190. IEEE.
Di Flumeri, G., Ronca, V., Giorgi, A., Vozzi, A., Aric
`
o, P.,
Sciaraffa, N., Zeng, H., Dai, G., Kong, W., Babiloni,
F., et al. (2022). Eeg-based index for timely detecting
user’s drowsiness occurrence in automotive applica-
tions. Frontiers in Human Neuroscience, 16:866118.
Garc
´
ıa, I., Bronte, S., Bergasa, L. M., Hern
´
andez, N., Del-
gado, B., and Sevillano, M. (2010). Vision-based
drowsiness detector for a realistic driving simulator.
In 13th International IEEE Conference on Intelligent
Transportation Systems, pages 887–894. IEEE.
Gupta, P., Gupta, H., Ushasukhanya, S., and Vijayaragavan,
E. (2023). Telemetry simulation & analysis. In 2023
International Conference on Networking and Commu-
nications (ICNWC), pages 1–7. IEEE.
Hu, H., Liu, J., Zhang, X., and Fang, M. (2023). An ef-
fective and adaptable k-means algorithm for big data
cluster analysis. Pattern Recognition, 139:109404.
Huang, W., Shi, Y., Xiong, Z., Wang, Q., and Zhu, X. X.
(2023). Semi-supervised bidirectional alignment for
remote sensing cross-domain scene classification. IS-
PRS Journal of Photogrammetry and Remote Sensing,
195:192–203.
Islam, M. R., Ahmed, M. U., and Begum, S. (2023). Inter-
pretable machine learning for modelling and explain-
ing car drivers’ behaviour: An exploratory analysis on
heterogeneous data. In 15th International Conference
on Agents and Artificial Intelligence.
Second-Order Learning with Grounding Alignment: A Multimodal Reasoning Approach to Handle Unlabelled Data
571

Islam, M. R., Barua, S., Ahmed, M. U., Begum, S., Aric
`
o,
P., Borghini, G., and Di Flumeri, G. (2020). A novel
mutual information based feature set for drivers’ men-
tal workload evaluation using machine learning. Brain
Sciences, 10(8):551.
Kirushanth, S. and Kabaso, B. (2018). Telematics and
road safety. In 2018 2nd International Confer-
ence on Telematics and Future Generation Networks
(TAFGEN), pages 103–108. IEEE.
Li, P. and Vu, Q. D. (2015). A simple method for identify-
ing parameter correlations in partially observed linear
dynamic models. BMC Systems Biology, 9(1):1–14.
Li, Z., Chen, L., Peng, J., and Wu, Y. (2017). Automatic de-
tection of driver fatigue using driving operation infor-
mation for transportation safety. Sensors, 17(6):1212.
Liang, P. P., Ling, C. K., Cheng, Y., Obolenskiy, A., Liu, Y.,
Pandey, R., Wilf, A., Morency, L.-P., and Salakhutdi-
nov, R. (2023). Multimodal learning without labeled
multimodal data: Guarantees and applications. arXiv
preprint arXiv:2306.04539.
Lu, P., Mishra, S., Xia, T., Qiu, L., Chang, K.-W., Zhu,
S.-C., Tafjord, O., Clark, P., and Kalyan, A. (2022).
Learn to explain: Multimodal reasoning via thought
chains for science question answering. Advances
in Neural Information Processing Systems, 35:2507–
2521.
Meyniel, F., Sigman, M., and Mainen, Z. F. (2015). Confi-
dence as bayesian probability: From neural origins to
behavior. Neuron, 88(1):78–92.
Na, S., Xumin, L., and Yong, G. (2010). Research on k-
means clustering algorithm: An improved k-means
clustering algorithm. In 2010 Third International
Symposium on intelligent information technology and
security informatics, pages 63–67. Ieee.
Papadelis, C., Chen, Z., Kourtidou-Papadeli, C., Bamidis,
P. D., Chouvarda, I., Bekiaris, E., and Maglaveras,
N. (2007). Monitoring sleepiness with on-board
electrophysiological recordings for preventing sleep-
deprived traffic accidents. Clinical Neurophysiology,
118(9):1906–1922.
Rahman, H., Ahmed, M. U., Barua, S., and Begum, S.
(2020). Non-contact-based driver’s cognitive load
classification using physiological and vehicular pa-
rameters. Biomedical Signal Processing and Control,
55:101634.
Respati, S., Bhaskar, A., and Chung, E. (2018). Traffic data
characterisation: Review and challenges. Transporta-
tion research procedia, 34:131–138.
Rumelhart, D. E., Hinton, G. E., Williams, R. J., et al.
(1985). Learning internal representations by error
propagation.
Siami, M., Naderpour, M., and Lu, J. (2020). A mobile
telematics pattern recognition framework for driving
behavior extraction. IEEE Transactions on Intelligent
Transportation Systems, 22(3):1459–1472.
Singh, H. and Kathuria, A. (2021). Analyzing driver be-
havior under naturalistic driving conditions: A review.
Accident Analysis & Prevention, 150:105908.
Taylor, P., Griffiths, N., Bhalerao, A., Anand, S., Popham,
T., Xu, Z., and Gelencser, A. (2016). Data mining
for vehicle telemetry. Applied Artificial Intelligence,
30(3):233–256.
Thiffault, P. and Bergeron, J. (2003). Monotony of road en-
vironment and driver fatigue: a simulator study. Acci-
dent Analysis & Prevention, 35(3):381–391.
Tselentis, D. I. and Papadimitriou, E. (2023). Driver profile
and driving pattern recognition for road safety assess-
ment: Main challenges and future directions. IEEE
Open Journal of Intelligent Transportation Systems.
Vasudevan, K., Das, A. P., Sandhya, B., and Subith, P.
(2017). Driver drowsiness monitoring by learning ve-
hicle telemetry data. In 2017 10th International Con-
ference on Human System Interactions (HSI), pages
270–276. IEEE.
Wang, K., Yang, J., Li, Z., Liu, Y., Xue, J., and Liu, H.
(2022). Naturalistic driving scenario recognition with
multimodal data. In 2022 23rd IEEE International
Conference on Mobile Data Management (MDM),
pages 476–481. IEEE.
Wang, W., Xi, J., Chong, A., and Li, L. (2017). Driv-
ing style classification using a semisupervised sup-
port vector machine. IEEE Transactions on Human-
Machine Systems, 47(5):650–660.
Winlaw, M., Steiner, S. H., MacKay, R. J., and Hilal, A. R.
(2019). Using telematics data to find risky driver be-
haviour. Accident Analysis & Prevention, 131:131–
136.
Zheng, G., Yang, B., Tang, J., Zhou, H.-Y., and Yang,
S. (2023). Ddcot: Duty-distinct chain-of-thought
prompting for multimodal reasoning in language mod-
els. arXiv preprint arXiv:2310.16436.
Zhu, C., Yang, Z., Xia, X., Li, N., Zhong, F., and Liu, L.
(2022). Multimodal reasoning based on knowledge
graph embedding for specific diseases. Bioinformat-
ics, 38(8):2235–2245.
Zhu, X. J. (2005). Semi-supervised learning literature sur-
vey.
ICAART 2024 - 16th International Conference on Agents and Artificial Intelligence
572
