
Machine Learning-Based Smart-Textile for COVID-19 Monitoring
Nkengue Marc Junior, Xianyi Zeng, Ludovic Koehl, Xuyuan Tao, François Dassonville
and Nicolas Dumont
Laboratoire Génie et Matériaux Textile (GEMTEX), Université de Lille, ENSAIT, F-59000, Lille, France
francois.dassonville@ensait.fr, nicolas.dumont@ensait.fr
Keywords: Signal Processing, Wearable and Mobile Devices, Artificial Intelligence, Health Monitoring Device,
COVID-19.
Abstract: We propose a new low-cost wearable system to guaranty patient mobility and robust monitoring of COVID-
19 using physiological signals. Considering the correlation between two key signals (ECG and PPG), the
proposed wearable system will integrate an Variational AutoEncoder (VAE) with self-attention block to
reconstruct robust ECG, PPG Red and IR signals from a noisy ECG time series. The model performance is
evaluated using the Mean Square Error (MSE), the root-mean-square error (RMSE), Mean Absolute Error
(MAE) and the Signal-to-Noise Ratio (SNRoutput) for the signals. With a low MSE, RMSE and MAE, as
well as good SNR, the model can generate robust and clean data from the noisy ECG waveform measured by
the wearable system. we believe that the proposed wearable system can not only help to provide robust online
COVID-19 symptoms monitoring but also for other applications.
1 INTRODUCTION
Three years after its emergence in late 2019, severe
acute respiratory syndrome coronavirus 2 (Sars-CoV-
2) or COVID-19 infected more than 630 million
people, causing more than 6 million deaths (2023).
However, the symptoms of COVID-19 patients differ
from one variant to another in this long duration. For
all reported variants and all periods, the most serious
symptoms are shortness of breath (blood oxygen
level<92%) and heart failure (heart rate>90 bpm)
(Dhadge and Tilekar 2020, 2021). Although the
intensity of infection and symptoms have attenuated
thanks to the vaccination and follow-up of barrier
gestures, we are still far from the termination of the
pandemic. This is mainly due to the high infection
rate, the proliferation of its variants that can escape
from vaccination coverage, and the inability to detect
the virus in real-time and thus, control its
proliferation. This situation promotes the emergence
of remote monitoring and diagnosis tools using the
IoT (Internet of Things), including wearable systems
(Cacovean, Ioana et al. 2020, Nasajpour, Pouriyeh et
al. 2020, Pozo and Berrezueta Guzman 2020).
Wearable monitoring systems effectively reduced the
pressure of medical resources (e.g., medical doctors,
healthcare staff, devices, materials, etc.). They
perform real-time detection of basic symptoms of
COVID-19 by monitoring skin temperature, blood
oxygen saturation level and heart rate(Cacovean,
Ioana et al. 2020, Nasajpour, Pouriyeh et al. 2020).
The SpO
2
and the heart rate are computed from PPG
signals (red light and infrared light) and ECG signal
respectively. Despite their advantages, several
limitations are observed: 1) Physiological signal
(ECG, PPG
Red
and PPG
IR
) are highly sensitive to
noises (Chen, Li et al. 2017, Chatterjee, Thakur et al.
2020): Noise induced by patient motion (motion
artifacts), respiration (Baseline wander) and by the
sensors itself (Powerline Interference). The lack of
robustness against noises affects SpO
2
and heart rate
computation accuracy. 2) The patient daily activities
are heavily obstructed by the positioning of the pulse
oximeter or PPG sensor (tip of the finger); 3) The
most robust wearable sensors are not easily
affordable. The ECG and PPG signals are
intrinsically correlated since the variation of the
peripheral blood volume is influenced by the left
ventricular myocardial activities. Unlike pulse
oximeter or PPG sensor, the optimal positioning of
heart monitor sensor does not obstruct patient daily
activities and provide useful signals. Our idea is to
design and implement an effective low-cost wearable
system coupling with a supervised learning model, to
172
Marc Junior, N., Zeng, X., Koehl, L., Tao, X., Dassonville, F. and Dumont, N.
Machine Learning-Based Smart-Textile for COVID-19 Monitoring.
DOI: 10.5220/0012466200003657
Paper published under CC license (CC BY-NC-ND 4.0)
In Proceedings of the 17th International Joint Conference on Biomedical Engineering Systems and Technologies (BIOSTEC 2024) - Volume 1, pages 172-180
ISBN: 978-989-758-688-0; ISSN: 2184-4305
Proceedings Copyright © 2024 by SCITEPRESS – Science and Technology Publications, Lda.

monitor the patient’s symptoms and make appropriate
decision support in real-time. The supervised learning
model learns the representation of clean ECG signal
and corresponding PPG signals (Red and IR) from a
single measured noisy ECG signal. The clean signals
can be used for accurate heart rate and SpO
2
estimation.
The rest of this paper is organized as follows.
Section 2 gives an overview of the related works.
Section 3 offers a description of the proposed
wearable system. In Section 4, we analyze the results
obtained and discuss about the implication of our
work. A conclusion and future perspectives are given
in Section 5.
2 RELATED WORKS
Many researchers in IoT and artificial intelligence
have developed various tools for monitoring and
detection of the virus infection. a number of wearable
systems with tiny sensors integrated into garments or
accessories have been used to measure physiological
parameters (e.g., skin temperature, heart rate, and
SpO
2
) of infected patients (Cacovean, Ioana et al.
2020, Nasajpour, Pouriyeh et al. 2020, Pozo and
Berrezueta Guzman 2020). Skin temperature is
estimated thanks to temperature sensor, SpO
2
level is
estimated from PPG signals (Red and IR) measured
by pulse oximeter sensor, and heart rate is estimated
from ECG signal measured by heart monitor sensor.
These wearable systems will enable the detect the
gravity of symptoms by checking measured
parameters values (e.g., the skin temperature>38°C ,
corresponding to high fever, SpO2<92% associate to
shortness of breath, and heart rate>90 bpm associate
to heart failure). The wearable systems allow a quick
monitoring of infected wearer’s health state with real-
time data acquisition.
Despite these advantages, the current wearable
systems have several drawbacks: 1) Raw ECG signals
and PPG signals are highly sensitive to noises (Chen,
Li et al. 2017, Chatterjee, Thakur et al. 2020) (Motion
artifacts, powerline interference, Baseline wander).
Without a pre-processing step, the signals cannot be
exploited for heart rate and SpO
2
estimation; 2) The
patient daily activities are heavily obstructed by the
positioning of the pulse oximeter sensor (the tip of the
finger is the optimal position for SpO
2
monitoring, the
patient need to stay still for an optimal measurement)
; 3) Wrist-based wearable system, while more robust
and less restraining than traditional wearable systems,
appears to be less accurate (They incorporate wrist-
based pulse oximeter sensor, which are less accurate
than finger-based pulse oximeter (Lee, Ko et al.
2016)) . They are also not easy affordable (the
average smart-watch price is higher than 150$). Since
the peripheral blood volume variation is linked to left
ventricular myocardial activities, it is easy to
establish a correlation between The PPG and ECG
signals. By using GAN, (Zhu, Tian et al. 2019, Sarkar
and Etemad 2021, Vo, Naeini et al. 2021) estimate
the waveform of the ECG signal using PPG
measurements by learning a signal model related to
ECG and PPG. Despite the good results obtained, the
models are not trained to handle noisy PPG signals.
Therefore, generated ECG and PPG signals are still
sensitive to noise.
In this context, the proposed system has been
developed to overcome the daily activities
obstruction caused by the pulse oximeter sensor and
the signals (ECG, PPG
Red
and PPG
IR
) vulnerability
against noise. We propose a low-cost smart textile
coupling with a supervised learning model. Instead of
learning ECG waveform representation from PPG
waveform, the model will learn three waveforms
representation (ECG, PPG
Red
and PPG
IR
) from a noisy
ECG waveform. In the next section, we describe the
overall system, the supervised learning method for
PPG signals generation, and the experimental results.
3 MATERIAL AND METHODS
The architecture of our wearable system is heavily
based on (Tao, Huang et al. 2018). The proposed
electronic textile measured ECG signal and skin
temperature and transmit the data to a mobile
application thanks to the Bluetooth Low Energy
(BLE) protocol. BLE allows a lower power
consumption than other wireless transmissions
protocol (Bluetooth, Zigbee) and improves the system
energetic autonomy. The mobile application by using
the proposed supervised model, reconstruct from the
noisy ECG signal measured by the wearable device,
three clean signals:
- ECG signal: The ECG signal will be use to
estimate the heart rate.
- PPG Red and IR signals: The two signals
will be used to estimate the SpO
2.
By checking the heart rate, SpO
2
and skin temperature
values (skin temperature>38°C, SpO2<92% and
heart rate>90 bpm), the system allow a quick
monitoring of the wearer health state in real-time.
The generated waveforms, heart rate, SpO
2
, skin
temperature and COVID-19 patient state are shown
Machine Learning-Based Smart-Textile for COVID-19 Monitoring
173
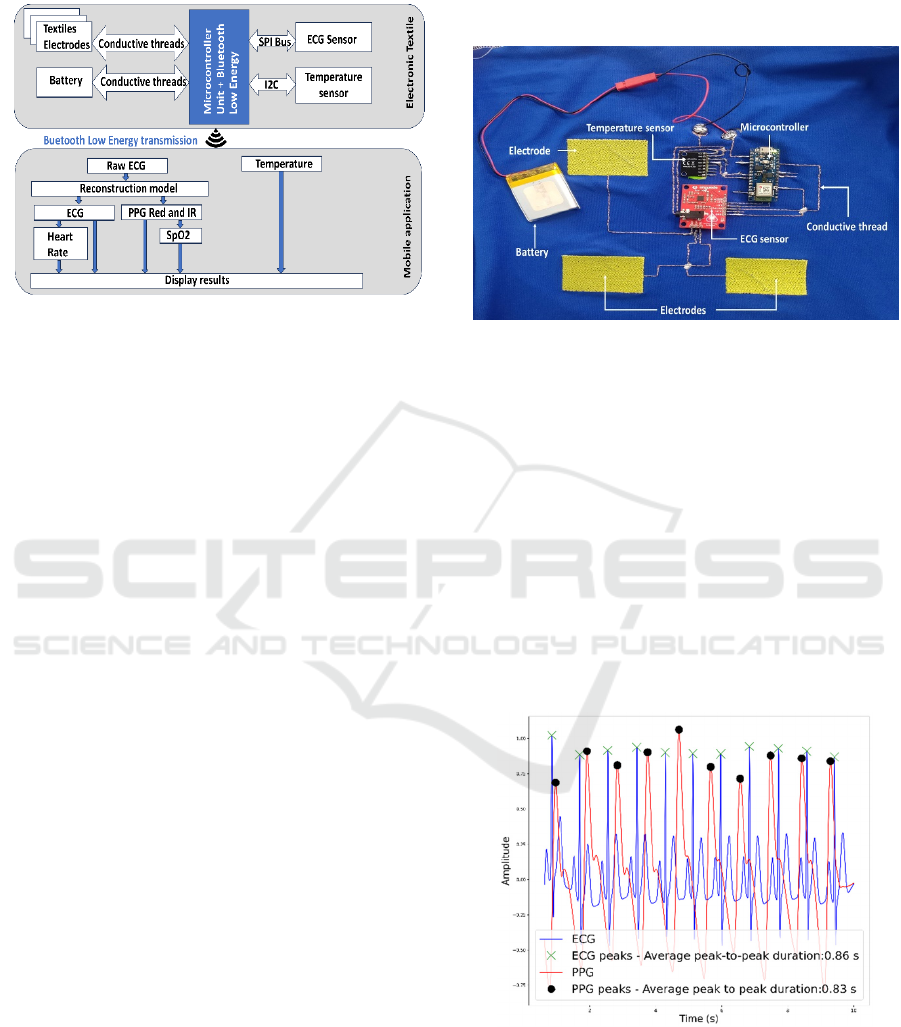
on the mobile application. Figure 1 shows the adopted
architecture.
Figure 1: Wearable system architecture.
3.1 Wearable Device
The microcontroller unit used is an Arduino Nano 33
BLE Sense. It integrates a SoC ARM ® Cortex ® -
M4 32-bit processor with a clock speed of 64 MHz. It
also integrates a high-performance professional grade
Bluetooth smart radio transceiver to ensure the
bidirectional communication between the wearable
system and the mobile device.
The heart monitor sensor used was AD8232
(Texas Instruments), connected to the microcontroller
via analogic pin.
The temperature sensor was integrated into MPU-
6050 chip, connected to the microcontroller via inter-
integrated circuit (I2C) bus.
Five pads were designed to realize the
interconnections using conductive threads to
peripherals. Two of them in form of snap button were
used to connect a battery and three of them were
considered as textile knitted electrodes to connect
with the heart monitor sensor. The conductive surface
dimension of knitted electrode was 3 cm × 5 cm. The
thread used for knitting the textile electrodes was
sliver-plate polyamide thread (Shieldtex 234/34-2 ply
HCB, Statex Produktions + Vertries GmbH), with
a linear resistance of less than 100 Ω.m
-1
. The
conductive thread between the sensors and the
electrodes is made of copper wires (Elektrisola,
Switzerland), and Lendzing Pro_len R PTFE
(Polytetra_uoroethylene) monofilament (Lenzing
Plastics GmbH, Austria) (Ismar, Tao et al. 2020).
The sampling frequency for heart monitor sensor
was set to 128 Hz for two reasons: 1) The developed
supervised learning model input length must be a
power of 2; 2) Sampling frequency above 125 Hz are
suitable for time-domain analysis and heart-rate
computation (Kwon, Jeong et al. 2018). The skin
temperature was set to 1 Hz (Skin temperature
evolution is slower than ECG signal evolution). The
wearable prototype is represented by Figure 2.
Figure 2: Smart textile prototype.
3.2 Signal Reconstruction Model
One of the main highlights of our contribution is the
signal reconstruction model developed. As we
mentioned earlier, a pulse oximeter integration in a
wearable t-shirt is highly difficult, since the sensor
placement is not optimal. It is a known fact that PPG
signals and ECG signals are heavily correlated.
Indeed the peripheral blood volume change
(describes by PPG signals) is influenced by cardial
muscles contraction and relaxation (which are
describes by the ECG signal). In addition, the PPG
signal peak-to-peak and the R-R peak are correlated,
as describes by Figure 3.
Figure 3: R-R peak and PPG peak-to-peak correlation.
Similar to (Zhu, Tian et al. 2019, Sarkar and Etemad
2021, Vo, Naeini et al. 2021), we propose to use the
correlation between ECG and PPG signals for signal
reconstruction.
BIODEVICES 2024 - 17th International Conference on Biomedical Electronics and Devices
174

Unlike the other contributions however, instead of
reconstruct ECG signal from PPG signal, the model
developed reconstruct from a noisy ECG signal, three
clean signals: A clean ECG signal, a clean PPG
Red
signal, and a clean PPG
IR
signal.
3.2.1 Data Description and Pre-Processing
The pre-processing consists of creating a new dataset
from existing datasets. The dataset use must contains
the three signals (ECG, PPG
Red
and PPG
Ir
) Two
publics datasets with ECG signals, PPG
Red
signals
and PPG
IR
signals matched our criteria:
The BIDMC dataset (Pimentel, Johnson et al. 2016)
and Pulse Time Transit (PPT) dataset (Mehrgardt,
Khushi et al. 2022). All the datas were recorded
during human study, using wearable heart monitor
sensor AD8232 (The same sensor we use for our
smart textile) and pulse oximeter MAX30100. Five
steps were followed for data pre-processing.
• PPG Signal Red Retrieval
BIDMC provide ECG signal, PPG
IR
signals and SpO
2
level. PPG
Red
signals of BIDMC were reconstructed
using the correlation between the SpO
2
level and the
ratio of ratios R, defined by the equation 2:
𝑅=
𝐴𝐶
𝐷𝐶
𝐴𝐶
𝐷𝐶
(1)
where AC represents the signal amplitude and DC the
signal baseline.
The correlation between 𝑅 and 𝑆𝑝𝑂
is described
by the equation 3 from (Tang, Li et al. 2022), with a
maximum error below 4%, and a confidence level
above 95%:
𝑆𝑝𝑂2= 11.78 𝑅3+55.92 𝑅2+28.84 𝑅 + 97.12
(2)
By normalizing PPG
Red
and PPG
IR
signals
baseline value ( 𝐷𝐶
=𝐷𝐶
), we can retrieve
𝐴𝐶
from 𝐴𝐶
, and thus the PPG
Red
signal.
The resulting ECG-PPG data from BIDMC and
PPT were combined to form a large multi-corpus.
• Signal Resampling and Filtering
Signals were resampled using an interpolation
technique where the sampling rate for all ECG-PPG
records became 128 Hz. A bandpass FIR-filter, as
well as Butter worth filter (Jagtap and Uplane 2012,
Vidhya and Jerritta 2022), were applied to the ECG
and PPG signals. Each signal is split into intervals of
4 seconds each with 1 second of overlapping to avoid
data loss.
• Minmax Normalization. In order to prevent
outlier, min-max normalization was applied in each
signal to ensure that the network data inputs all lie
within the same range.
To preserve the Ratio of Ratios, each PPG
Red
and
PPG
IR
signal has been normalized as follows:
For each sample x
red
and x
ir
, respectively of a PPG
Red
signal red and the corresponding PPG
Ir
signal ir, the
normalized values are:
𝑥
=
𝑥
−max (𝑟𝑒𝑑)
max
(
𝑖𝑟
)
−min (𝑖𝑟)
(3)
𝑥
=
𝑥
−max (𝑖𝑟)
max
(
𝑖𝑟
)
−min (𝑖𝑟)
(4)
• Data Augmentation
While the obtained signals can be considered as more
than enough (10 000 signals of each category), a data
augmentation has been performed to prevent
overfitting or underfitting. A GAN model was used to
the task (Li, Ngu et al. 2022). The proposed
architecture is divided into two parts: A generator,
which generate synthetized signals by mapping real
signals features, and a discriminator which make sure
the generate signals are close as possible to real
signals. can generate multi-category synthetic time-
series. The model has been trained with our dataset to
generate more ECG and PPG signals. We were able
to generate 120 323 signals of each category (ECG,
PPG
Red
and PPG
Ir
)
• Input Signal Dataset Creation
An input dataset of noisy ECG signals was created by
adding a random combination of the three main ECG
noises (motion artifacts, powerline interference,
baseline wander) to the ECG signals.
Each noise signal can be described by the equation:
𝑁
(
𝑡
)
=
𝐴
.sin
(
2𝜋𝑓𝑡+ 𝜓
)
(5)
With A, the signal amplitude, f the frequency in Hz
and
ψ
the phase between [-π,π].
The noise signal is generated by randomly
variates A, f and
ψ.
Baseline wander is a low
frequency noise of 0.5 Hz. Powerline Interference is
a low frequency noise of 50 Hz and motion artifact is
a low frequency noise between 0.5 and 300 Hz.
Machine Learning-Based Smart-Textile for COVID-19 Monitoring
175
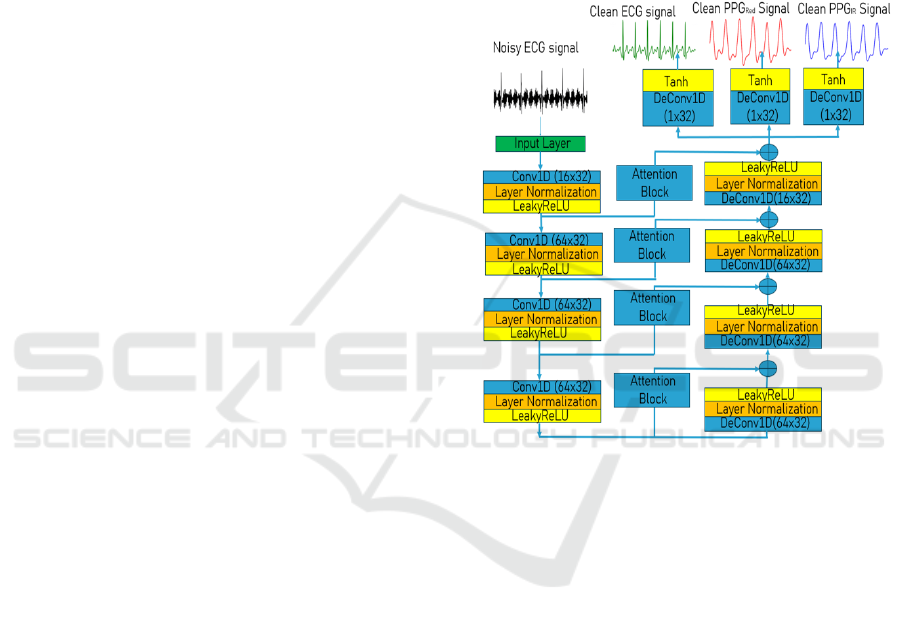
3.2.2 Deep Learning Model
The deep learning model architecture described in
Figure 4. The model architecture present as an
Autoeoncoders and can be divide in two neural
networks: An encoder and a decoder.
The encoder role is to learn efficient data
encoding from the signals and pass it into a bottleneck
architecture. In other words, the encoder estimates a
compressed version of the input signal by learning his
features. For this reason, we choose a CNN as an
encoder since the convolutional Layers can easily
extract the signals features. Each convolutional block
consists of:
• A convolution operation, to allow feature
extraction. The equation (6) describes the convolution
operation.
𝑦
=𝑥
(
𝑖−
𝑗
)
.𝑤
+𝑏
(6)
When
h
corresponds to the filter kernel,
w
j
the
filter weights and
b
j
the biases,
y
i
the feature extracted
and
x
the signal.
• A layer normalisation, to avoid outlier, speed
up the model training, reduce bias and avoid gradient
exploding (Ba, Kiros et al. 2016). By using the layer
normalization, we ensure that all the signal features
lie withing the same range.
The activation function used is LeakyReLU.
LeakyReLU has been chosen for his efficient
computation, a better gradient propagation, and help
to better handle the vanishing gradient problem, since
it allows a small positive gradient when the unit is not
active.
The decoder role is to establish to relationship
between the reduce representation and the desired
output signals, by minimizing the reconstruction error
(the error between the signals obtained and the real
signals). The decoder network architecture is the
same as the encoder network architecture, except for
using deconvolutional layer for the data mapping
between the reduce representation and the signals.
The deconvolution operation is describes by:
𝑦
=𝑦
(
𝑖−
𝑗
)
.𝑤
+𝑏
(7)
When
h
corresponds to the filter kernel,
w’
j
the
filter weights and
b’
j
the biases, 𝑦
the estimated
output and
yi
the reduced representation sample.
Skipped connection with self-attention block
between layers of the encoder and layers of the
decoder are used for two reasons: Avoiding gradients
vanishing are helping to further learn the
correspondence between the signals.
The kernel size and the number of filters has been
chosen empirically to have the smallest and efficient
model possible (The target device is an edge device).
To our best knowledge, this is the first proposition
of ECG, PPG
Red
and PPG
Ir
signals reconstruction
from a noisy ECG signal.
Figure 4: Model Architecture.
3.3 Implementation Details
The TensorFlow library is used for model training
and evaluation. The Adam optimization method is
used for training, with a cyclical a learning rate
between 10
-6
and 10
-4
.
The learning rate decayed exponentially with a
decay factor of 0.95. Other training parameters
include the batch size (128) and the number of epochs
(100). To guarantee the best performances, the model
has been trained using a k-fold cross validation with
5 iterations. For each iteration, 80% of data were
using for training, 10% for validation, and 10% for
the test.
In this study, the Mean Square Error (MSE), the
Root Mean Square Error (RMSE), and Mean
Absolute Error (MAE) are used as qualitative
performances estimators for all signals.
The MSE represented the standard deviation
between the output predicted by the model and the
actual output. The MSE is defined as:
BIODEVICES 2024 - 17th International Conference on Biomedical Electronics and Devices
176

The MSE describes the standard deviation
between the output predicted by the model and the
actual output. The MSE is defined as:
𝑀𝑆𝐸 =
1
𝑁
(
𝑥
−𝑥
)
(8)
The RMSE is the squared value of the MSE. It can
be define as the variance between the predicted output
and the desired output. A smaller value of RMSE
corresponds to a smaller difference and better
performance. The RMSE is formulated as follows:
𝑅𝑀𝑆𝐸 =
1
𝑁
(
𝑥
−𝑥
)
(9)
The MAE is defined as the absolute difference
between the predicted output and the desired
output. A smaller value of MAE corresponds to a
smaller difference and better performance. The
MAE is formulated as follows:
𝑀𝐴𝐸 =
1
𝑁
|
𝑥
−𝑥
|
(10)
Other used qualitative performances are the
Signal to Noise. The SNR is widely defined as the
ratio of signal power to noise power. In other terms,
SNR quantify the robustness of the signal against
noise (A higher SNR means a more robust signal
against noise). The 𝑆𝑁𝑅
in decibels (dB), is
described as the following expression:
𝑆𝑁𝑅
=10log
∑
𝑥
𝑖
2
𝑁
𝑖=1
∑
(
𝑥
𝑖
−𝑥
𝑖
)
2
𝑁
𝑖=1
(11)
N is the signal length, 𝑥
is a sample value of the
original signal at time i/N, 𝑥
is a sample value of
the denoised waveform at time i/N.
4 RESULTS
4.1 Cross Validation Results
Table 1 regroups the best cross-validation model
metrics. The results confirm our model can accurately
reconstruct both PPG waveforms and ECG waveform
form a noisy ECG waveform. Indeed, the MSE,
RMSE and MAE show that our model can reconstruct
the signals with a minimal error. The SNR for each
signal shows that the reconstructed signal is robust
against noise.
Table 1: Model performances.
4.2 Real-Time Demonstration
4.2.1 Offline Demonstration
To confirm the model efficiency and reliability, we
aim to recorded at the same time, noisy signals using
our wearable device and the PPG signals. Five
volunteers (Three male and two female) aged
between 20 and 25 years participated to the
experiment. The PPG
Red
and PPG
IR
signals are
recorded from the pulse oximeter sensor MAX30102.
The PPG recording was done by placing the pulse
oximeter sensor at the tip of the finger. Both ECG and
PPG are recorded at the same time. The experiment
duration was 5 minutes for each volunteer. The model
was applied to the recorded data to reconstruct the
three signals.
Figure 5 shows ECG and PPG signals
reconstruction from the noisy ECG signal. The figure
shows that the model reconstructed ECG and PPG
signals correctly. The reconstructed PPG signals are
also robust against noises as shows in Table 2.
Table 2: SNR improvement in reconstructed signals.
Reconstructed
ECG
Reconstructed
PPG Re
d
Reconstructed
PPG I
r
SNR(dB) 13.27 8.71 5.36
Metrics ECG signal PPG
Red
signal PPG
IR
signal
MSE 1.1.10
-3
2.7.10
-3
6.3.10
-3
RMSE 0.033 0.0519 0.0794
MAE 0.0185 0.0297 0.0466
SNRout(dB) 18.39 11.10 12.97
Machine Learning-Based Smart-Textile for COVID-19 Monitoring
177
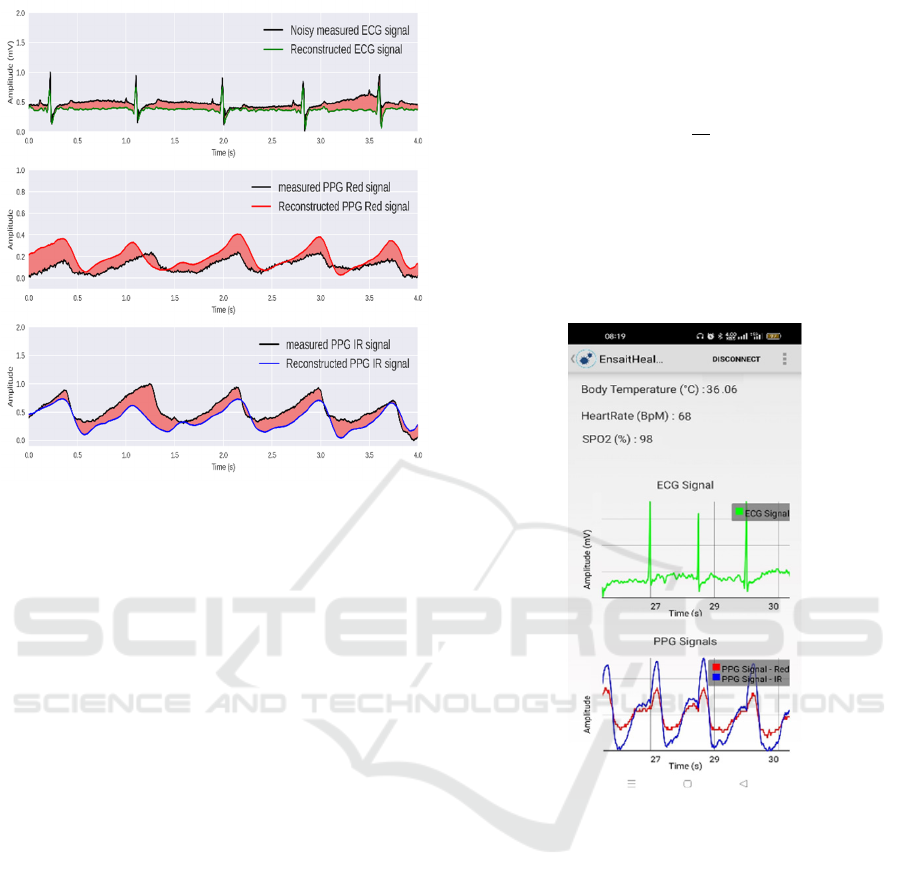
Figure 5: Comparison between reconstructed signals and
real signals.
4.2.2 Online Demonstration
An Android application was developed to receive,
process, and display the data measured by the
wearable system. This decision is motivated by two
points : Using signal processing methods with ECG
and PPG signals, in addition of increasing the
microcontroller power consumption, do not provide
enough satisfying results.; The current
microcontrollers do not have enough memory to use
Deep ML models. By using an Android application as
a gateway since most current smartphones support
Deep ML models (as TensorflowLite file), we
achieve our goal to reconstruct ECG and PPG signals.
The wearable system measure ECG and skin
temperature and send the data to the Android
application using Bluetooth Low Energy. The
sampling frequency used is 128 Hz for the ECG, and
1 Hz for the temperature. The android application
receives the datas and extract the ECG signal and the
skin temperature. The ECG signal and the
temperature are stored , each to an array until the ECG
signal duration is equal to 4 seconds. Then, the
TensorflowLite model reconstruct the signals from
the ECG signal received.
The reconstructed signals are used to estimate the
heart rate (from the ECG signal), the SpO2 (from the
PPG signals). The average skin temperature is
estimated as the mean of the stored temperatures.
Heart rate and SpO
2
level are estimated from the
generated signals. Heart rate is estimated from the
equation (12). SpO
2
level is estimate from equation
(2):
𝐻𝑟=60
𝑁
𝑇
(12)
where N is the signal length in seconds, T
r
is the R-
peak interval length during N seconds.
Figure 6 shows that the Android application can
successfully monitor in real-time skin temperature,
ECG and PPG signals, and estimate heart rate and
SpO
2
.
Figure 6: Real-time monitoring.
4.3 Discussions
We believe our proposed solution has the potential to
make a significant impact in the healthcare and
wearable domains, notably for continuous health
monitoring. In addition to be lowcost, our proposed
wearable system assures patient comfort and
mobility, making it suitable for real-time and long-
term monitoring. The integration of the proposed
model offers many advantages to our system:
• A Real-time denoising of the ECG signal,
ensuring continuous signal quality.
• The ability to generate robust PPG signals,
eliminating the need for an oximeter. Initially design
for COVID-19 monitoring, the current system can be
used for other applications (Early diagnosis of
cardiovascular diseases for example).
BIODEVICES 2024 - 17th International Conference on Biomedical Electronics and Devices
178

Despite its great performances, the current
wearable system has some limitations:
• The current wearable systems mainly realize
real-time detection for the basic symptoms of
COVID-19 from skin temperature, blood oxygen
saturation (SpO2) level, and heart rate. Since these
symptoms are common with other diseases (e.g. Flu),
it is impossible to distinguish COVID-19 from others
without further investigation.
• Human study test must be conducted, to
collect more data and assert the efficiency of the
model and the proposed system. A cross-validation
with practitioners is also collect more data and assert
the efficiency of the model and the proposed system.
The model architecture must be less complex to
be implemented directly to the microcontroller.
5 CONCLUSION AND
PERSPECTIVES
This paper presents a novel textile-based wearable
system for COVID-19 monitoring. By coupling to
wearable system with an AI framework, we can
obtain clean ECG signals and PPG signals for heart
rate and SpO
2
level estimation. The proposed AI
framework, reconstruct robust ECG and PPG signals
from a single noisy ECG signal measured by the
wearable device. The early experimental measures
confirm our wearable system can be used in a real-
time scenario. Considering that heart failure is one of
the most prominent symptoms of COVID-19, we
believe that the virus presence in the patient organism
can affect the ECG waveform. Our next work will
confuse on the implementation of an AI model that
can distinguish ECG waveform from a healthy patient
to a COVID-19. This information can improve
greatly our current wearable system and help to
monitor patient status in real-time.
ACKNOWLEDGEMENTS
This work was supported in part by the National
National Research Agency (ANR) of France, Ecole
Centrale Lille, and GEMTEX Research Laboratory
under AI_Engineering_PhD@Lille grant.
REFERENCES
(2021). "Coronavirus disease (COVID-19) - Symptoms."
from https://www.who.int/health-
topics/coronavirus#tab=tab_3.
(2023). "WHO Coronavirus (COVID-19) Dashboard."
from https://covid19.who.int/.
Ba, J. L., J. R. Kiros and G. E. Hinton (2016). "Layer
normalization." arXiv preprint arXiv:1607.06450.
Cacovean, D., I. Ioana and G. Nitulescu (2020). "IoT
System in Diagnosis of Covid-19 Patients." Informatica
Economica 24: 75-89.
Chatterjee, S., R. S. Thakur, R. N. Yadav, L. Gupta and D.
K. Raghuvanshi (2020). "Review of noise removal
techniques in ECG signals." IET Signal Processing
14(9): 569-590.
Chen, Y., D. Li, Y. Li, X. Ma and J. Wei (2017). Use
moving average filter to reduce noises in wearable PPG
during continuous monitoring. eHealth 360°, Springer:
193-203.
Dhadge, A. and G. Tilekar (2020). Severity Monitoring
Device for COVID-19 Positive Patients. 2020 3rd
International Conference on Control and Robots
(ICCR).
Ismar, E., X. Tao, F. Rault, F. Dassonville and C. Cochrane
(2020). "Towards Embroidered Circuit Board From
Conductive Yarns for E-Textiles." IEEE Access PP: 1-
1.
Jagtap, S. K. and M. Uplane (2012). The impact of digital
filtering to ECG analysis: Butterworth filter
application. 2012 International Conference on
Communication, Information & Computing
Technology (ICCICT), IEEE.
Kwon, O., J. Jeong, H. B. Kim, I. H. Kwon, S. Y. Park, J.
E. Kim and Y. Choi (2018). "Electrocardiogram
sampling frequency range acceptable for heart rate
variability analysis." Healthcare informatics research
24(3): 198-206.
Lee, H., H. Ko and J. Lee (2016). "Reflectance pulse
oximetry: Practical issues and limitations." ICT
Express 2(4): 195-198.
Li, X., A. H. H. Ngu and V. Metsis (2022). "Tts-cgan: A
transformer time-series conditional gan for biosignal
data augmentation." arXiv preprint arXiv:2206.13676.
Mehrgardt, P., M. Khushi, S. Poon and A. Withana (2022).
"Pulse Transit Time PPG Dataset." PhysioNet 10: e215-
e220.
Nasajpour, M., S. Pouriyeh, R. M. Parizi, M. Dorodchi, M.
Valero and H. R. Arabnia (2020). "Internet of Things
for Current COVID-19 and Future Pandemics: an
Exploratory Study." Journal of healthcare informatics
research: 1-40.
Pimentel, M. A., A. E. Johnson, P. H. Charlton, D.
Birrenkott, P. J. Watkinson, L. Tarassenko and D. A.
Clifton (2016). "Toward a robust estimation of
respiratory rate from pulse oximeters." IEEE
Transactions on Biomedical Engineering 64(8): 1914-
1923.
Machine Learning-Based Smart-Textile for COVID-19 Monitoring
179

Pozo, L. and S. Berrezueta Guzman (2020). IoT as an
Alternative Way to Improve the Telemedicine Methods
Against COVID-19 in Vulnerable Zones: 64-76.
Sarkar, P. and A. Etemad (2021). Cardiogan: Attentive
generative adversarial network with dual discriminators
for synthesis of ecg from ppg. Proceedings of the AAAI
Conference on Artificial Intelligence.
Tang, Y., M. Li and Z. Wei (2022). Continuous blood
oxygen estimation using PPG based on VMD. Journal
of Physics: Conference Series, IOP Publishing.
Tao, X., T.-h. Huang, C.-L. Shen, Y.-C. Ko, G.-T. Jou and
V. Koncar (2018). "Bluetooth Low Energy-Based
Washable Wearable Activity Motion and
Electrocardiogram Textronic Monitoring and
Communicating System." Advanced Materials
Technologies 3.
Vidhya, R. B. and S. Jerritta (2022). "Pre-processing ECG
signals for smart home material application." Materials
Today: Proceedings 49: 2955-2961.
Vo, K., E. K. Naeini, A. Naderi, D. Jilani, A. M. Rahmani,
N. Dutt and H. Cao (2021). P2E-WGAN: ECG
waveform synthesis from PPG with conditional
wasserstein generative adversarial networks.
Proceedings of the 36th Annual ACM Symposium on
Applied Computing.
Zhu, Q., X. Tian, C.-W. Wong and M. Wu (2019). ECG
reconstruction via PPG: A pilot study. 2019 IEEE
EMBS international conference on biomedical & health
informatics (BHI), IEEE.
BIODEVICES 2024 - 17th International Conference on Biomedical Electronics and Devices
180
