
A Post-Processing Strategy for Association Rules in Knowledge Discovery
Luiz Fernando da Cunha Cintra
1 a
, Rodigo da Silva Dias
2
and Rogerio Salvini
1 b
1
Instituto de Inform
´
atica, Universidade Federal de Goi
´
as, Goi
ˆ
ania-GO, Brazil
2
Department of Psychiatry, University of Sao Paulo Medical School, S
˜
ao Paulo-SP, Brazil
Keywords:
Association Rule Mining, Post-Processing, Knowledge Discovery.
Abstract:
Association Rule Mining (ARM) is a traditional data mining method that describes associations among el-
ements in transactional databases. A well-known problem of ARM is the large number of rules generated,
requiring approaches to post-process these rules so that a human expert can analyze the associations found. In
certain scenarios, experts focus on exploring a specific element within the data, and a search based on this item
can help reduce the problem. Few methods concentrate on post-processing generated rules targeting a specific
item of interest. This study aims to highlight relevant associations of a particular element in order to gain
knowledge about its role through its interactions and relationships with other factors. The paper introduces a
post-processing strategy for association rules, selecting and grouping rules pertinent to a specific item of in-
terest as provided by a domain expert. Additionally, a graphical representation facilitates the visualization and
interpretation of associations between rules and their groupings. A case study demonstrates the applicability
of the proposed method, effectively reducing the number of relevant rules to a manageable level for expert
analysis.
1 INTRODUCTION
Association Rule Mining (ARM) (Agrawal et al.,
1993) is a well-known method for extracting patterns
from a dataset. Initially proposed to discover as-
sociations in supermarket basket data, over the last
decades, it has been applied to various other domains,
such as construction (Cheng et al., 2016), product de-
velopment (Karimi-Majd and Mahootchi, 2015), edu-
cation (Matetic et al., 2015), sports (Weidner et al.,
2020), building maintenance (Zhang et al., 2021),
medicine (Castro et al., 2018) (Wei and Scott, 2015),
and urban planning (Balasubramani et al., 2016). One
of the main challenges related to using association
rules is the massive number of rules that ARM algo-
rithms can generate. This issue is well-known and has
been studied for over 20 years (Baesens et al., 2000).
ARM aims to identify frequent and meaningful
associations within a transactional database. In the
context of ARM, a transactional database stores data
resulting from interactions between two or more par-
ties, with each interaction referred to as a transaction.
Typically, each transaction includes an identity num-
ber and a list of the items making up the transaction,
a
https://orcid.org/0009-0002-6709-8789
b
https://orcid.org/0000-0001-8889-6654
such as a customer’s purchase, a flight booking, or a
user’s clicks on a web page (Han et al., 2012).
An association rule is an “if-then” type of rule,
formalized by Agrawal et al. (Agrawal et al., 1993)
that reveals patterns or relationships within a set of
transactions. A more general formalization states
that an association rule has the form A → B, where
A and B are itemsets, i.e., A = {a
1
,a
2
,...,a
n
} and
B = {b
1
,b
2
,...,b
m
}, with a
i
and b
j
being items from
a database. A is referred to as the antecedent, and
B as the consequent of the rule. Given that I is the
set of all items in the database, A ⊂ I, B ⊂ I, and
A ∩ B =
/
0, meaning that antecedent and consequent
are items from the database and do not have repeated
items. The size of a rule is the number of items it
contains.
Let D be a set of transactions, where each trans-
action T is an itemset such that T ⊂ I. The support
of a rule A → B is the percentage of transactions in D
containing the items of A ∪ B, i.e., the percentage of
transactions where the items from the antecedent and
consequent of the rule occur together. The confidence
of a rule A → B is the percentage of transactions in
D that, if containing A, also contain B (Agrawal and
Srikant, 1994).
Essentially, the ARM problem involves generat-
ing, from a set of transactions D, all rules with sup-
Cintra, L., Dias, R. and Salvini, R.
A Post-Processing Strategy for Association Rules in Knowledge Discovery.
DOI: 10.5220/0012465800003654
Paper published under CC license (CC BY-NC-ND 4.0)
In Proceedings of the 13th International Conference on Pattern Recognition Applications and Methods (ICPRAM 2024), pages 119-130
ISBN: 978-989-758-684-2; ISSN: 2184-4313
Proceedings Copyright © 2024 by SCITEPRESS – Science and Technology Publications, Lda.
119

port and confidence greater than the minimum val-
ues specified by the user. Consequently, this prob-
lem breaks down into two subproblems: 1) identify-
ing all itemsets with support greater than or equal to
the minimum support (referred to as frequent item-
sets), and 2) generating rules from the frequent item-
sets that have confidence greater than or equal to the
specified minimum confidence. Numerous ARM al-
gorithms adopt the support/confidence model to gen-
erate association rules. Examples of such algorithms
include Apriori (Agrawal and Srikant, 1994), Eclat
(Zaki, 2000), and FP-Growth (Han et al., 2004).
ARM, in general, is an exploratory activity. Un-
like a classification task, where a target variable of
the dataset is used to guide the construction of classi-
fication rules, ARM algorithms seek any statistically
relevant pattern within the data (Freitas, 2000). This
allows the analysis of specific items both in the conse-
quent and the antecedent of a rule. An item of interest
positioned in the antecedent enables the extraction of
the consequences of its presence, not just what leads
to its occurrence, as is the case in classification rules.
For example, in the work of Wei and Scott (Wei and
Scott, 2015), the item of interest is a vaccine, and the
consequent is adverse events. Another aspect that can
be explored in a generated set of association rules is
the choice of rules that do not include an item of in-
terest but share items with other rules that do, thus
highlighting these relationships. Therefore, a method
that considers these characteristics is particularly ben-
eficial for experts looking for specific insights into
their datasets, contributing to discovering knowledge
in particular domains.
The main objective of this work is to propose a
post-processing method for association rules that se-
lect the rules that, directly or indirectly, are related
to a specific object of study for a domain expert
based on an item of interest in the database. This
method was motivated by a clinical study presented
in the work of Castro and colleagues (Castro et al.,
2018), in which ARM was used to uncover correla-
tions between events related to the menstrual cycle.
Their efforts aimed to construct a network of relation-
ships from groupings of rules that could reveal spe-
cific clinical conditions influenced by the menstrual
cycle. Essentially, the study addressed the question of
whether a particular event forms a continuum related
to women’s hormonal fluctuations or whether they are
isolated epiphenomena. Thus, the present work aims
to extract rules that show how the occurrence of an
item of interest influences other items and how differ-
ent items are influenced by the item of interest, high-
lighting only those most relevant to the expert. We
also introduce a graphical representation in the form
of a graph to visualize the multiple relationships be-
tween the associations around the item of interest.
We extensively reviewed recent literature and did
not identify any method specifically designed to han-
dle the specified scenario. While we found four meth-
ods that focus on an item of interest, none involve
the appearance of this item on both sides of the rule.
Moreover, no existing method explicitly seeks to es-
tablish connections between rules, as proposed in this
work.
The remainder of this paper is structured as fol-
lows. Section 2 presents the proposed association rule
post-processing method. In Section 3, we present the
results obtained when applying the proposed method
to real data on deaths due to COVID-19 in Brazil.
Section 4 makes a comparison between our method
and related methods in the literature. The conclusions
of this work are in Section 5.
2 PROPOSED METHOD
The proposed method is tailored to address issues
where a specific feature is a focal point for investi-
gation. It strategically selects rule subsets from an
association rule set generated by an ARM algorithm,
guided by a particular item of the database (referred
to as item of interest) and a measure M reflecting the
importance of the rules. Moreover, the method exclu-
sively considers rules with a maximum size of three,
recognizing that more extensive rules pose challenges
in interpretation and practical application. The mini-
mum rule size is set at two, aligning with the necessity
for a rule antecedent in confidence calculations. Ad-
ditionally, the method excludes rules containing items
with missing values, ensuring a robust and reliable
analysis.
The method organizes the selected rules into eight
distinct types based on their relational structures.
Type 1 addresses bidirectional rules, emphasizing the
mutual influence between the item of interest and an-
other element. Types 2, 3, 4, and 5 involve the in-
clusion of the item of interest in the rule’s antecedent,
spotlighting its role in strengthening the factors lead-
ing to another entity. Conversely, Types 6, 7, and 8
feature the item of interest in the consequent of the
rule, revealing how associations with other factors
may fortify or amplify the likelihood of the item of
interest. Organizing rules into these specific group-
ings facilitates a deeper understanding of associations
related to the research subject. Moreover, the pro-
posed method filters out rules not directly pertinent to
the research interest, reducing the number of rules for
analysis.
ICPRAM 2024 - 13th International Conference on Pattern Recognition Applications and Methods
120

We introduce the following eight types of group-
ings, illustrating them with association rules related
to dengue fever
1
. These rules are not derived from a
database but are based on information provided by a
medical professional, serving as illustrative examples
of the grouping types. In the subsequent section, we
will present results obtained from actual databases.
The focal item of interest is analyzing the presence
of dengue fever (dengue = yes) in the associations.
The symbol M indicates a value of a specific mea-
sure quantifying the degree of dependence between
the antecedent and the consequent of a rule, guiding
the grouping process.
Type 1 Group
Type 1 encompasses sets of bidirectional rules, mean-
ing rules where some item implies the item of interest
and the item of interest implies that item. This type
of information reinforces associations, as it indicates
a close connection between the entities. The example
below shows that fever for more than seven days and
dengue are strongly associated.
f ever = [> 7days] → dengue = yes
dengue = yes
dengue = yes
dengue = yes
dengue = yes
dengue = yes → f ever = [> 7days]
Type 2 Group
This type of grouping describes sets of rules suggest-
ing a strengthened association between the item of in-
terest and another specific item linked with the same
consequent. This strengthening is observed when
comparing the values of the particular metric to the
individual associations of these items with the same
consequent. In the example below, hemophilia and
dengue individually cause bleeding. However, when
both conditions (hemophilia and dengue) coexist in
an individual, the association with bleeding is inten-
sified. This is quantified through the metric M, where
M
3
would surpass both M
1
and M
2
.
hemophilia = yes → bleeding = yes, (M
1
)
dengue = yes
dengue = yes
dengue = yes → bleeding = yes, (M
2
)
hemophilia = yes,dengue = yes
dengue = yes
dengue = yes → bleeding =
yes, (M
3
)
Type 3 Group
Type 3 indicates when the item of interest strength-
ens an existing association. Unlike Type 2, there is no
prior rule where the item of interest is already related
1
Dengue fever (CID A90) is a mosquito-borne tropical
disease caused by the dengue virus.
to the consequent. The example below shows that se-
vere abdominal pain would lead an individual to be
admitted to the Intensive Care Unit (ICU). The occur-
rence of dengue alongside intense abdominal pain re-
inforces the need for treatment in the ICU (M
2
> M
1
).
It is important to note that there is no rule explicitly
stating the association between dengue and ICU ad-
mission.
abdominalPain = intense → ICU = yes, (M
1
)
abdominalPain = intense,dengue = yes
dengue = yes
dengue = yes → ICU =
yes, (M
2
)
Type 4 Group
Type 4 is similar to Type 3, but this time, it empha-
sizes when another item reinforces an existing associ-
ation between the item of interest and the item in the
consequent. In this scenario, there is no rule estab-
lishing a direct connection between the other element
and the consequent. In the example below, we observe
that dengue is associated with hospitalization. How-
ever, the presence of pregnancy along with dengue in-
tensifies the likelihood of hospitalization (M
2
> M
1
),
even without a rule explicitly stating that pregnancy
alone leads to hospitalization.
dengue = yes
dengue = yes
dengue = yes → hospitalization = yes, (M
1
)
pregnant = yes,dengue = yes
dengue = yes
dengue = yes → hospitalization =
yes, (M
2
)
Type 5 Group
Type 5 consists of only one rule of size 3, where the
item of interest is associated with an item in the an-
tecedent and another in the consequent, without indi-
vidual associations between the antecedent items and
the consequent item. In the example below, dengue
and intense abdominal pain are associated with respi-
ratory distress. However, there are no individual asso-
ciations between dengue and respiratory distress nor
between intense abdominal pain and respiratory dis-
tress.
dengue = yes
dengue = yes
dengue = yes,abdominalPain = intense →
respiratoryDistress = yes
Type 6 Group
Type 6 deals with groups of rules where the item of in-
terest appears as the consequent of these rules. In this
grouping, three rules aim to demonstrate that the con-
junction of other items leading to the item of interest
strengthens the association. In the example, we ob-
serve that fever for more than seven days and throm-
bocytopenia can be symptoms of dengue individu-
A Post-Processing Strategy for Association Rules in Knowledge Discovery
121

ally. The co-occurrence of these two symptoms re-
inforces the association with the likelihood of dengue
(M
3
would be greater than M
1
and M
2
).
f ever = [> 7days] → dengue = yes
dengue = yes
dengue = yes, (M
1
)
thrombocytopenia = yes → dengue = yes
dengue = yes
dengue = yes, (M
2
)
f ever = [> 7days],thrombocytopenia = yes →
dengue = yes
dengue = yes
dengue = yes, (M
3
)
Type 7 Group
Similar to Type 6, Type 7 also deals with rules where
the item of interest is in the consequent; however, in
this case, one of the other items is not individually
associated with the item of interest. In the example
below, the first rule presents the association between
fever for more than seven days and dengue, while the
second rule shows that mild bleeding enhances this
association (with M
2
> M
1
). Moreover, there is no
rule associating mild bleeding with dengue.
f ever = [> 7days] → dengue = yes
dengue = yes
dengue = yes, (M
1
)
mildBleeding = yes, f ever = [> 7days] →
dengue = yes
dengue = yes
dengue = yes, (M
2
)
Type 8 Group
Type 8 highlights items that, when examined individ-
ually, are not associated with the item of interest in the
consequent but, when combined, demonstrate a sig-
nificant relationship. In the example, petechiae and
intense abdominal pain are associated with dengue.
However, there are no other rules associating these
symptoms with dengue individually.
petechiae = yes,abdominalPain = intense →
dengue = yes
dengue = yes
dengue = yes
Algorithm
The algorithm for the proposed method selects and
groups rules according to the types described above.
To this end, the algorithm input is a set R of rules
of size 2 or 3 generated by an ARM algorithm based
on support and confidence. The user must specify an
item of interest, ¯a, corresponding to a variable with
a specific value in the data set. The user must also
define an evaluation measure, referred to as M, which
is used to evaluate the correlation between the items
present in a rule. Measures such as Lift, Conviction,
and Odds Ratio are commonly used for this purpose.
The value 1 in these measures indicates that there is
no correlation between the items in the antecedent and
the consequent. This means that the antecedent and
consequent of the rule are independent. In this case,
the rule is ignored. To ensure that only rules with
a strong association between items are selected, the
user can specify a threshold around the no-correlation
value through the parameter δ. If δ = 0, only rules
with the exact no-correlation value will be removed.
A principle of the proposed method is that a larger
rule should only be retained if it has some gain (mea-
sured by M) over its sub-rules. To prevent this gain
from being insignificant, the user can set a parame-
ter α, indicating the minimum relative gain between a
size-3 rule and its size-2 sub-rules. The relative gain
is the difference in M values between the size-3 rule
and a size-2 sub-rule, divided by the M value of the
size-2 rule. In other words, the M value for the size-3
rule should be α% higher than that of the size-2 sub-
rule. Equation 1 shows how the relative gain of rule
r
2
is calculated concerning rule r
1
.
RG(r
1
,r
2
) =
M(r
2
) −M(r
1
)
M(r
1
)
(1)
In our experiments, we observed that using rules with
lower confidence values might be interesting to en-
able the formation of rule groupings that exhibit rele-
vant relationships. On the other hand, this can cause
a side effect, generating many groups around size-
3 rules with low confidence. The parameter c
′
was
added to control this issue and specify minimum con-
fidence for size-3 rules. Therefore, the c
′
parameter of
the proposed method is not directly related to the min-
imum confidence of ARM algorithms. If c
′
= 0, all
rules generated by the ARM algorithm will be consid-
ered. Algorithm 1 performs the procedure described
above.
Visualizing the Interconnections Among
Rule Groups
We observe that specific rules may appear in mul-
tiple groupings generated by the proposed method.
Therefore, we have developed a graphical represen-
tation capable of condensing the information derived
from these groupings. This is accomplished through
a graph encompassing all generated groups connected
by some common rule. Figure 1 provides a general
example of this graph. In the graph, the red nodes
represent rules shared by the groupings, referred to
as pivot rules. The blue nodes depict groupings of
Types 2, 4, 6, and 7, while the yellow nodes represent
groupings of Type 1. The connections between group-
ings are established exclusively through pivot rules,
a strategy employed to reduce the number of edges
and enhance visualization. Establishing connections
between groups of Types 3, 5, and 8 is not feasible.
Types 5 and 8 consist of only one rule and lack a pivot
rule. Similarly, Type 3 also lacks a pivot rule, given
ICPRAM 2024 - 13th International Conference on Pattern Recognition Applications and Methods
122

Data: R: rule set generated by ARM; ¯a: item
of interest; δ: correlation threshold; α:
minimum relative gain; c
′
: minimum
confidence for size three rules
Result: rule groupings categorized into 8
different types
Select from R the rules whose M value is
greater than 1.0 +δ:
R
′
= {r
j
|r
j
∈ R ∧ M(r
j
) > 1.0 + δ};
Select from R
′
only the rules that have the
item of interest ¯a: R
′′
= {r
j
|r
j
∈ R ∧ ¯a ⊂ r
j
};
Remove 3 size rules with confidence less than
c
′
: R
′′′
= {r
j
|r
j
∈ R
′′
∧ (len(r
j
) =
2 ∨Con f (r
j
) ≥ c
′
)};
Organize the rules into the following types:
Type 1: rule pairs of size 2, such as:
{r
1
: a → ¯a; r
2
: ¯a → a}, where r
1
,r
2
∈ R
′′′
.
Type 2: trios of rules, such as:
{r
1
: a
1
→ a
2
;r
2
: ¯a → a
2
;r
3
: a
1
, ¯a → a
2
},
where r
1
∈ R
′
, r
2
,r
3
∈ R
′′′
, RG(r
1
,r
3
) ≥ α
and RG(r
2
,r
3
) ≥ α.
Type 3: pairs of rules, such as:
{r
1
: a
1
→ a
2
;r
2
: a
1
, ¯a → a
2
},
where r
1
∈ R
′
, r
2
∈ R
′′′
, ¯a → a
2
/∈ R
′′′
and
RG(r
1
,r
2
) ≥ α.
Type 4: pairs of rules, such as:
{r
1
: ¯a → a
2
;r
2
: a
1
, ¯a → a
2
},
where r
1
,r
2
∈ R
′′′
, a
1
→ a
2
/∈ R
′
and
RG(r
1
,r
2
) ≥ α.
Type 5: unitary sets of rules, such as:
{r : a
1
, ¯a → a
2
},
where r ∈ R
′′′
, a
1
→ a
2
/∈ R
′
and
¯a → a
2
/∈ R
′′′
.
Type 6: trios of rules, such as:
{r
1
: a
1
→ ¯a;r
2
: a
2
→ ¯a;r
3
: a
1
,a
2
→ ¯a},
where r
1
,r
2
,r
3
∈ R
′′′
, RG(r
1
,r
3
) ≥ α and
RG(r
2
,r
3
) ≥ α.
Type 7: pairs of rules, such as:
{r
1
: a
1
→ ¯a;r
2
: a
1
,a
2
→ ¯a},
where r
1
,r
2
∈ R
′′′
, a
2
→ ¯a /∈ R
′′′
and
RG(r
1
,r
2
) ≥ α.
Type 8: unitary sets of rules, such as:
{r : a
1
,a
2
→ ¯a},
where r ∈ R
′′′
, a
1
→ ¯a /∈ R
′′′
and a
2
→ ¯a /∈ R
′′′
Algorithm 1: Algorithm for rule selection and grouping.
Figure 1: Graph illustrating the connections between rule
groups. Red nodes denote pivot rules, yellow nodes corre-
spond to Type 1 groups (bidirectional rules), and blue nodes
represent other groups connected through pivot rules.
that the size-2 rule can only appear in a single group-
ing as it does not include the item of interest.
Figure 2 illustrates a subgraph example where
the central red node represents a pivot rule estab-
lishing an association where dengue leads to bleed-
ing. This pivot rule is also present in other groups,
thereby connecting various associations with bleed-
ing. For instance, medications such as acetylsali-
cylic acid (ASA), ibuprofen, and escitalopram en-
hance the association between dengue and bleeding
despite lacking direct individual associations with
bleeding (no specific association rules exist between
these medications and bleeding). Additionally, the
pivot rule connects associations related to severe liver
disease, hemophilia, and bleeding. In this scenario,
there are rules indicating that these diseases individu-
ally lead to bleeding, and other rules suggest that the
presence of dengue with these diseases amplifies the
occurrence of the association with bleeding. Lastly,
the yellow node encompasses a bidirectional rule in-
dicating that dengue and bleeding share a mutual re-
lationship and can serve as a linkage point with other
nodes featuring associations leading to dengue in dif-
ferent group rules.
3 CASE STUDIES
We conducted experiments on four real case studies
to evaluate the effectiveness of the proposed method.
A Post-Processing Strategy for Association Rules in Knowledge Discovery
123

Figure 2: Illustration of a subgraph exemplifying multi-
ple associations interconnected through the relationship be-
tween dengue and bleeding.
The initial case study is derived from research by
(Slyepchenko et al., 2017), later utilized by (Castro
et al., 2018) as an Association Rule Mining (ARM)
task. The primary objective is to investigate Premen-
strual Dysphoric Disorder (PMDD) in women with
Bipolar Disorder (BD). The other three studies utilize
information from open sources provided by the
Brazilian government on Severe Acute Respiratory
Syndrome (SARS)
2
. Due to space constraints, we
will focus on one of the SARS case studies related
to COVID-19 and mortality. However, the results
of rule groups from all case studies are available at
https://github.com/Luiz-Cintra-Experiments/masters-
degree-experiments/tree/main/results.
The ARM algorithm used to generate the associa-
tion rules was the Apriori implemented in the R lan-
guage, version 4.3.1, available in the library arules
version 1.7-6 (Hahsler, 2023). The parameters used
were: minimum support of 1% , minimum confidence
of 30%, and maximum rule size equal to 3. This sup-
port value was chosen because some attributes have
a low frequency at specific values. The confidence
value was chosen to demonstrate that rules of size 2
with lower confidence may have their associations en-
hanced if the item in its antecedent occurs concomi-
tantly with another item, forming a rule of size 3 that
is more reliable.
The proposed method was implemented
in Python language version 3.8, available
at https://github.com/Association-Rules-Post-
Processing/ARPPL. The parameters of the proposed
method were: interest measure M = Odds Ratio
(OR), dependence margin δ = 0.1, minimum im-
2
https://opendatasus.saude.gov.br/dataset?tags=SRAG
provement α = 10%, and minimum confidence for
size 3 c
′
= 50%. The graphs were generated using
the library Networkx (Hagberg et al., 2008) in version
2.8.8 (NetworkX Developers, 2022), with the library
ForceAtlas2 version 1.0 (Shinn, 2016) being used to
improve the layout of nodes in the graph.
3.1 Case Study: COVID-19-Related
Mortality
The data used in this case study was compiled from
four distinct SARS databases spanning the years 2019
to 2022. The final dataset comprises 2, 166, 443 en-
tries from patients with a confirmed diagnosis of
COVID-19 and includes 34 variables
3
. In the final
dataset, 95.75% of patients were hospitalized. There-
fore, the results presented concern hospitalized pa-
tients and not a general perspective of the effects of
COVID-19.
The Apriori algorithm generated 187,407 associ-
ation rules. These rules were then processed through
the proposed method, with evolution = covid death as
the item of interest for rule grouping. This resulted in
the formation of 116 groups, encompassing 215 dis-
tinct association rules. Only groupings of types 7 and
8 were not formed. Table 1 presents a subset of rules
from these groups.
The two initial groupings reveal a bidirectional
association (Type 1 group) between medical proce-
dures such as the use of invasive respiratory support
(vent sup = inv) and admission to the Intensive Care
Unit (ICU) (ICU = yes) with death due to COVID-
19 (evolution = covid death). In the first grouping
(G
1
), it is observed that patients using invasive respi-
ratory support (rule 1) had a high occurrence of mor-
tality (Conf. = 74.5%). On the other hand, among
patients who died from COVID-19 (rule 2), there is
an occurrence of invasive respiratory support, but to a
lesser extent (Conf. = 41.3%). In the second group-
ing (G
2
), the occurrence of items in the antecedent
and consequent of the rules appears balanced. Of
the patients admitted to the ICU (rule 3), around half
died from COVID-19 (Conf. = 53.1). Likewise, of
the patients who died from COVID-19 (rule 4), just
over half were admitted to the ICU (Conf. = 55.3%).
The following three groupings show bidirectional as-
sociations of respiratory symptoms such as respira-
tory discomfort (resp discom f ort = yes), low blood
oxygen saturation (blood oxygen = [< 95]), and dys-
pnea (dypnea = yes) with death. We can observe that
given these respiratory symptoms (rules 5, 7, and 9),
3
Available at: https://github.com/Luiz-
Cintra-Databases/SRAG-OpenDataSUS-2019-
2022/tree/main/srag/database
ICPRAM 2024 - 13th International Conference on Pattern Recognition Applications and Methods
124
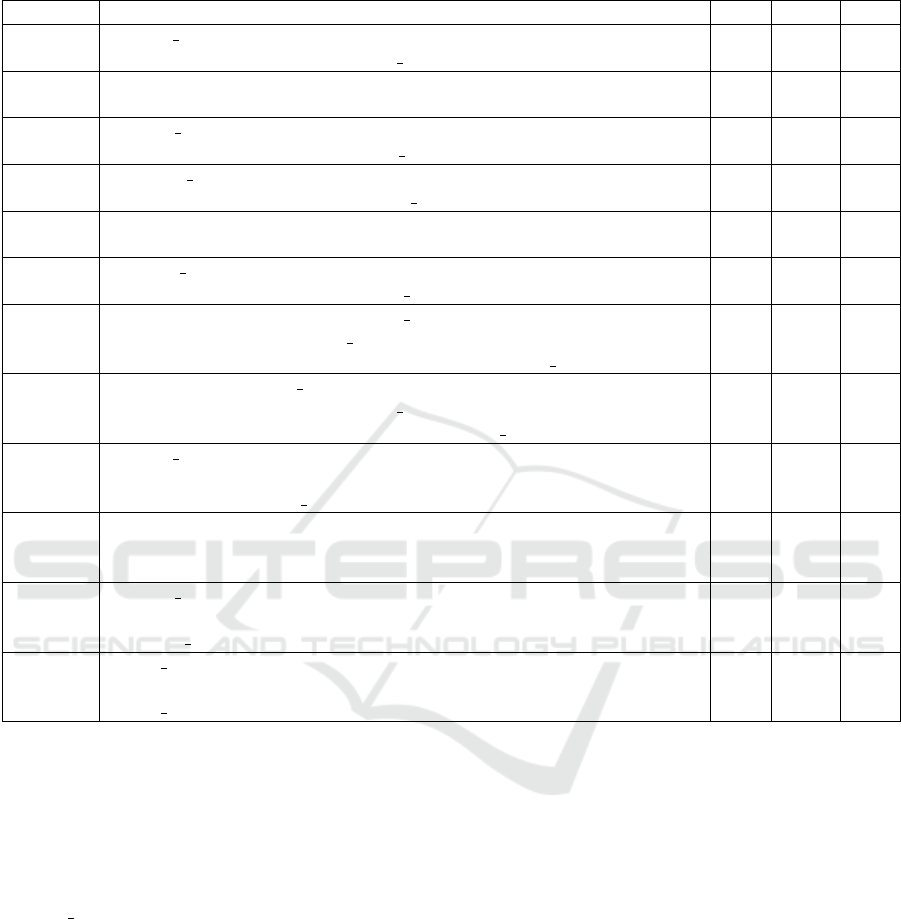
Table 1: Subset of rule groups formed for the analysis of COVID death (item of interest evolution = covid death). Gr.: group
number; Tp.: group type; Id: rule identification; Sup.: rule support (in %); Conf.: rule confidence (in %); OR: rule odds ratio.
Gr. (Tp.) Id: Rule Sup. Conf. OR
G
1
(1)
1: vent sup = inv → evolution = covid death 12.8 74.5 10.4
2: evolution = covid death → vent sup = inv 12.8 41.3 10.4
G
2
(1)
3: ICU = yes → evolution = covid death 17.1 53.1 4.4
4: evolution = covid death → ICU = yes 17.1 55.3 4.4
G
3
(1)
5: resp discom f ort = yes → evolution = covid death 19.3 35.3 1.6
6: evolution = covid death → resp discom f ort = yes 19.3 62.3 1.6
G
4
(1)
7: blood oxygen = [< 95] → evolution = covid death 21.8 35.3 1.7
8: evolution = covid death → blood oxygen = [< 95] 21.8 70.2 1.7
G
5
(1)
9: dyspnea = yes → evolution = covid death 23.4 33.9 1.6
10: evolution = covid death → dyspnea = yes 23.4 75.6 1.6
G
6
(1)
11: risk f ac = yes → evolution = covid death 22.5 37.3 2.2
12: evolution = covid death → risk f ac = yes 22.5 72.7 2.2
G
7
(2)
12: evolution = covid death → risk f ac = yes 22.5 72.7 2.2
14: vaccinated = yes → risk f ac = yes 14.1 70.5 1.7
15: vaccinated = yes, evolution = covid death → risk f ac = yes 4.8 81.1 3.0
G
8
(2)
16: ICU = yes → vent sup = inv 14.4 44.8 19.2
2: evolution = covid death → vent sup = inv 12.8 41.3 10.4
18: ICU = yes,evolution = covid death → vent sup = inv 11.1 64.7 23.1
G
9
(6)
1: vent sup = inv → evolution = covid death 12.8 74.5 10.4
20: age = (75y+) → evolution = covid death 10.0 51.5 3.0
21: age = (75y+),vent sup = inv → evolution = covid death 3.3 86.9 16.4
G
10
(6)
3: ICU = yes → evolution = covid death 17.1 53.1 4.4
20: age = (75y+) → evolution = covid death 10.0 51.5 3.0
24: ICU = yes,age = (75y+) → evolution = covid death 4.8 68.8 5.6
G
11
(6)
5: resp discom f ort = yes → evolution = covid death 19.3 35.3 1.6
20: age = (75y+) → evolution = covid death 10.0 51.5 3.0
27: resp discom f ort = yes,age = (75y+) → evolution = covid death 6.1 56.8 3.4
G
12
(6)
28: sx date = [5/2020-8/2020] → evolution = covid death 5.5 33.0 1.1
20: age = (75y+) → evolution = covid death 10.0 51.5 3.0
30: sx date = [5/2020-8/2020],age = (75y+) → evolution = covid death 2.1 58.7 3.3
the occurrence of death is close to one-third (confi-
dence of the rules is 35.5% and 33.9%). However,
patients who died (rules 6, 8, and 10) had a higher oc-
currence of these symptoms (confidence of the rules
is 62.3%, 70.2%, and 75.6%, respectively). The last
Type 1 grouping (G
6
) presented in the Table 1 shows a
bidirectional association between a patient’s risk fac-
tor (risk f ac = yes) and death from COVID-19. Like
the three previous groupings, the risk factor (rule 11)
implies death from COVID-19 in close to a third of
cases (Conf. = 37.3%). However, given a patient
who died from COVID-19 (rule 12), the occurrence of
them having some risk factor is high (Conf. = 72.7%).
Two Type 2 groupings are illustrated in Table 1.
The grouping G
7
shows the previous association rule
12 in which patients who died from Covid were more
likely to have some risk factor. Additionally, there
is an association between vaccinated COVID patients
(vaccinated = yes) who also had a higher occurrence
of having some risk factor (rule 14). Rule 15 then
establishes that the association of vaccinated patients
who died from COVID increases the possibility of
them having had a risk factor. This is concluded
from the increase in confidence and odds ratio of rule
15 (Conf.=81.1% and OR=3.0) concerning rules 12
(Conf.=72.7% and OR=2.2) and 14 (Conf.= 70.5%
and OR=1.7). The grouping, G
8
shows an associa-
tion in which patients admitted to the ICU lead to the
occurrence of invasive respiratory support (rule 16).
Additionally, the previous association rule 2 indicates
that patients who died from COVID-19 also involved
in the use of invasive respiratory support. Rule 18
reinforces these two previous associations, showing
that patients admitted to the ICU who died increase
the occurrence of using invasive respiratory support.
This is also concluded by the increase in confidence
and odds ratio of rule 18 (Conf.=64.7% and OR=23.1)
concerning rules 16 (Conf.=44.8% and OR=19.2) and
2 (Conf.=41.3% and OR=10.4).
Type 6 groupings deal with the item of interest,
A Post-Processing Strategy for Association Rules in Knowledge Discovery
125

death from COVID-19, in the consequent of the rules.
For these groupings, we highlight associations that re-
flect how the need for specific procedures in individ-
uals over 75 years old (age = 75y+) presents a higher
risk of death. Grouping G
9
shows a previously seen
association where the use of invasive respiratory sup-
port leads to death (rule 1). Besides, it shows that
age over 75 also leads to death (rule 20). However,
age acts as an important reinforcement when it oc-
curs with ventilatory support (rule 21). We can verify
that both confidence and odds ratio have a significant
increase in rule 21 (Conf. = 86.9% and OR = 16.4)
compared to rules 1 (Conf. = 74.5% and OR = 10.4)
and 20 (Conf. = 51.5% and OR = 3.0). Similarly, rule
24 in grouping G
10
indicates that elderly patients ad-
mitted to the ICU have a higher occurrence of death
when looking at their confidence (68.8%) and odds ra-
tio (5.6), which are higher than those of rules 3 and 20
seen earlier. In turn, rule 27 in grouping G
11
indicates
that the symptom of respiratory discomfort in the el-
derly also intensifies the evolution of covid to death,
according to its higher confidence value (56.8%) and
odds ratio (3.4) compared to the previous rules 25 and
20. G
12
is the last grouping presented in Table 1. It
shows that patients with COVID-19 symptoms in the
second third of 2020 (sx date = [5/2020 − 8/2020])
are associated with death from COVID-19 (rule 28).
Although this association is not as strong (Conf. =
33.0% and OR = 1.1), this type of association was not
generated for other dates. However, the association is
enhanced in patients over 75 years old (rule 30) (Conf.
= 58.7% and OR = 3.3).
Visualization of Rule Groupings
Figure 3 shows the graph of generated groups that
present relationship between groups. The image has
three subgraphs corresponding to groups of Type 6
and Type 7 (the subgraphs that look like a fireworks
explosion), they are linked to the center of the graph
through bidirectional rules (yellow nodes). The center
of the graph shows the relationship between groups
of Type 2 and Type 4. A subgraph with only three
groups was generated and is not related to the rest of
the graph. The two subgraphs highlighted in the Fig-
ure 3 were adjusted manually, due to limitation on the
number of the pages, and will be presented below.
Figure 4 highlights all the forms of relationships
between the groups that the method is able to capture.
A bidirectional rule will show that the item of interest
also acts as a factor in the occurrence of the associated
item. Therefore, the yellow nodes provide a bridge to
verify both the factors that lead to the occurrence of
the item of interest, what the item of interest acts as a
factor and whether any item can reinforce such an as-
sociation. For example, age = (75y+) → evolution =
covid death and evolution = covid death → age =
(75y+), furthermore, the latter has a connection with
another group that shows that in patients with neuro-
logical diseases and who have had Covid there is a
greater chance of being over 75 years old.
The graph also shows that resp discom f ort =
yes, ven sup = inv e icu = yes are associated with
death due to COVID-19 through the blue nodes linked
to rule age = (75y+) → evolution = covid death.
The remaining bidirectional rules convey that items
are inherently associated to death due to COVID-
19 (resp discom f ort = yes is linked to a bidirec-
tional, which in turn is linked to center of graph,
see Figure 3). Thereby, we can see that not only
ven sup = inv → evolution = covid death but also
evolution = covid death → ven sup = inv, addition-
ally the association is reinforced when evolution =
covid death and icu = yes occurs together. A sim-
ilar relationship can also be seen in the rule icu =
yes → evolution = covid death, where evolution =
covid death → icu = yes also occurs, in addi-
tion, the association is reinforced when evolution =
covid death occurs concomitantly with tomo
res =
typical covid or obesity = yes.
Relationship between groups of Types 2 and 4
are showed in Figure 5. This type of relation-
ship shows when the item of interest acts as a fac-
tor for another item to occurs, moreover to show-
ing the other items that reinforced this association.
For example, in Figure 5, in addition to showing that
evolution = covid death → risk f ac = yes occurs, the
graph also shows that several items reinforced this as-
sociation, such as, icu = yes, blood oxygen = [< 95],
f ever = not e sore throat = not. The subgraph also
shows a bidirectional that conveys that evolution =
covid death and risk f ac = yes are intrinsically asso-
ciated.
4 DISCUSSION
Few studies have been found on post-processing asso-
ciation rules based on an item of interest in the data.
In a literature review since 2015 on this subject, only
three works were found that focus on an item of in-
terest in the consequent (Berka, 2018) (Cheng et al.,
2016) (Hahsler and Karpienko, 2017), and a single
work that focuses on an item of interest in the an-
tecedent (Wei and Scott, 2015). However, no works
address an item of interest on either side of the rule,
as in our proposed method.
Berka’s work (Berka, 2018) focuses on describ-
ing concepts by fixing the chosen concept in the con-
ICPRAM 2024 - 13th International Conference on Pattern Recognition Applications and Methods
126
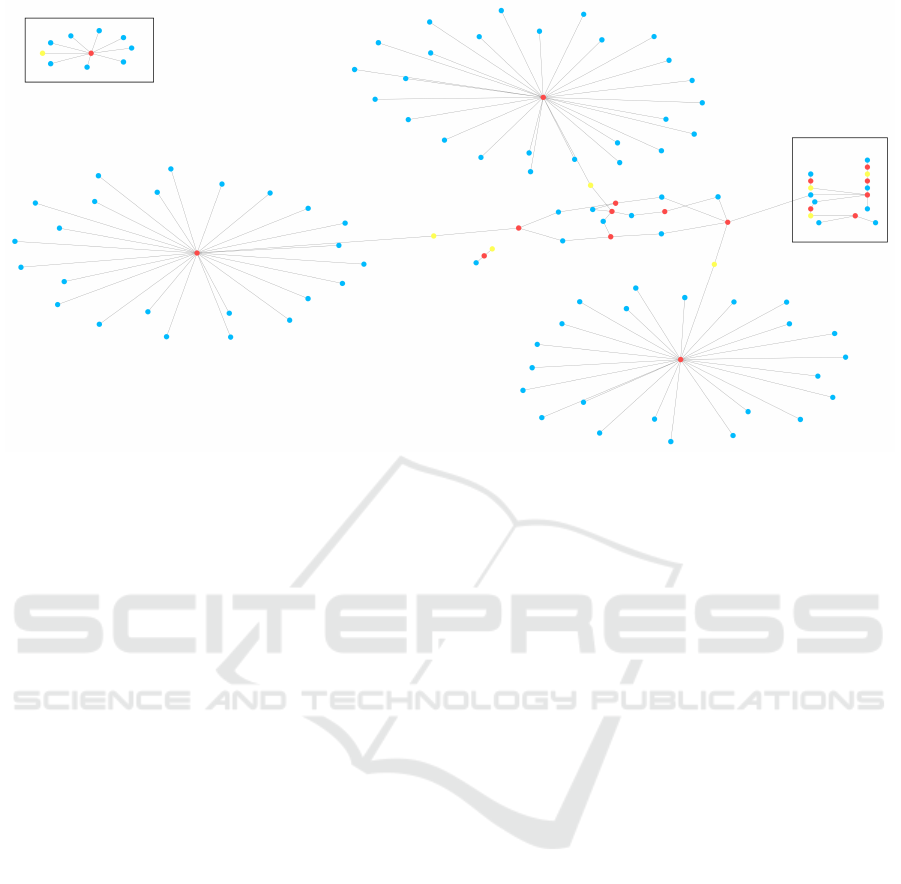
Figure 3: Graph showing the relationships among all rule groupings. The detailed view of the highlighted square on the right
side is presented in Figure 4, and the detailed view of the highlighted square in the upper left corner is provided in Figure 5.
sequent of the rule and generating meta-rules. His
method involves, from rules obtained by the ARM
algorithm, filtering those with a specific consequent
(the concept to be explored) and generating a new
database where each rule is mapped as a row, main-
taining the columns of the original database except
for the column that was fixed in the consequent. The
ARM algorithm is then applied to this new database,
and the result of this application provides information
associated with the sought concept. Thus, a second
level of information is obtained compared to tradi-
tional rules. As a consequence of this approach, he
can get the association between items that lead to the
occurrence of a specific concept. However, associ-
ations in which the concept acts as a factor for the
presence of another item are lost. Our method is more
generic and retains these associations in which the
item of interest acts as a factor for the occurrence of
other items (item of interest in the antecedent of the
rule).
Cheng and colleagues (Cheng et al., 2016) pro-
pose a visualization based on a set of association rules
with the same consequent, where an expert can “as-
semble” a rule by adding items. This strategy allows
the expert to try to build rules they already have a
prior assumption. As this construction progresses,
the expert validates the relevance of the constructed
rules based on the support and confidence provided
by the visualization. Hahsler and Karpienko (Hah-
sler and Karpienko, 2017) also propose a visualiza-
tion method where clusters of antecedents are gen-
erated for rules with the same consequent. First, a
matrix is created where the rows represent the con-
sequent, and the columns represent the antecedents
(both itemsets). Then, the columns are grouped us-
ing the k-means algorithm, checking the lift measure.
The authors argue that the lift measure allows match-
ing conditions of synonyms or similar items, such as
butter and margarine. The visualization consists of a
balloon plot where rows are the consequent, columns
are the clusters of antecedents, and a point on the plot
represents a rule. The points correspond to balloons
with properties such as color, size, and balloon po-
sition being used to highlight the clusters. Although
the method does not focus on a specific item of inter-
est, as all consequents are arranged in the rows of the
visualization, it facilitates an analysis of a particular
item in the consequent. Moreover, as their goal is to
group similar items, the clustering method does not
highlight the individual associations contained in less
general rules. In both mentioned works that use visu-
alization, only associations with an item of interest in
the consequent are highlighted, but not those where an
item of interest appears in the antecedent. In our ap-
proach, we consider that rules with an item of interest
in the antecedent are essential because they allow for
the analysis of the consequences of this occurrence,
and it is possible to visualize these relationships in
the graph in a grouped manner.
Wei and Scott (Wei and Scott, 2015) combine
pruning, summarization, and visualization to find pat-
terns in adverse reactions to vaccines in the United
A Post-Processing Strategy for Association Rules in Knowledge Discovery
127
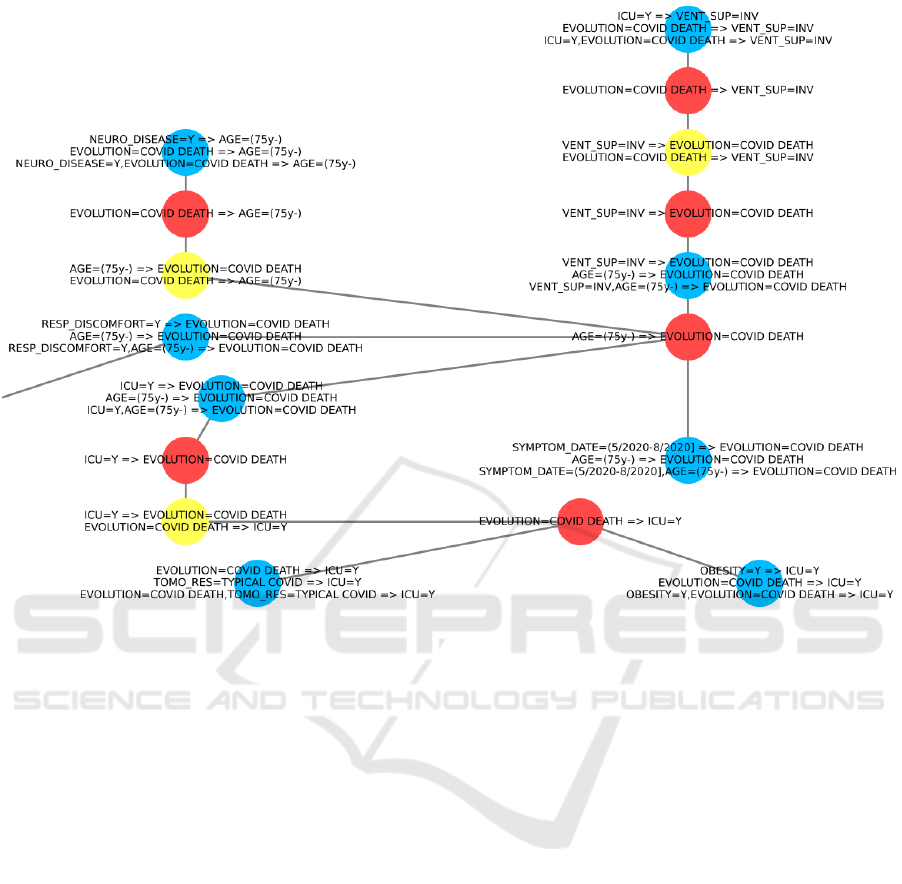
Figure 4: Subgraph displaying interconnections among various types of groups of rules.
States. In this work, the item of interest acts as the
sole antecedent of the rule, and the consequent is a
set of items representing the adverse effects of a vac-
cine. This work aligns with ours in studying the item
of interest in the antecedent, but it does not address
when the item is in the consequent, making our pro-
posal more general as we can analyze the causes and
consequences of an item of interest in other items in
the database.
We can categorize the post-processing of associ-
ation rules into four main types of tasks: pruning,
grouping, summarization, and visualization (Baesens
et al., 2000). Our method performs three of these
tasks: pruning (selecting rules based on an item of in-
terest and an evaluation measure), grouping (grouping
the selected rules into types), and visualization (gen-
erating a graph to visualize the interconnections of the
formed rule groups).
The pruning performed by our method is based,
in parts, on the concept presented by (Bayardo et al.,
2000), but using a minimum percentage improvement
in the pruning process. The grouping carried out by
our method differs significantly from the groupings
found in recent literature, as it employs a predefined
format of the relationship between rules (subsumed
rules). Works such as (de Padua et al., 2018) and
(Karimi-Majd and Mahootchi, 2015) perform group-
ings based on the similarity of items between rules,
enabling the display of other related rules. However,
if a specialist is interested in verifying, from a rule of
size 3, whether the antecedents are individually asso-
ciated, these additional rules will increase the effort
required for analysis. The same issue occurs in the
study by (Zhang et al., 2019), which groups rules us-
ing rule semantics, making it unclear to the specialist
the individual associations in relation to size 3 associ-
ations.
Some works use graphs to visualize rules, but the
approach of fixing a pivot rule was not found. The
idea of using the pivot rule came from adapting the
approaches of (Wei and Scott, 2015) and (Kwon and
Kim, 2019), where the rules are nodes, and the items
are represented with different visual marks. Since the
work of (Wei and Scott, 2015) fixes an antecedent, it
does not need to worry about showing the antecedent,
unlike (Kwon and Kim, 2019), which needs to show
the antecedent by connecting to the node and the node
connecting to the consequent.
Microsoft provides an alternative visualization
method through its proprietary software, MS Analysis
ICPRAM 2024 - 13th International Conference on Pattern Recognition Applications and Methods
128

Figure 5: Subgraph showing multiple associations interconnected through the relationship between COVID-19-related deaths
and a risk factor.
Services
4
. The visualization in the MS software rep-
resents a dependency network, i.e., a directed graph
where items are nodes, linking antecedents to conse-
quents. A key distinction from our approach is that
our graph nodes can represent individual rules (if it is
a pivot rule) or groups of rules rather than individual
items. This distinction simplifies the visualization by
avoiding complex cycles between items and reducing
the number of edges. Additionally, each group con-
nects to only one pivot rule and vice versa, further
minimizing edges. Our method is tailored to extract
and emphasize more intricate relationships within as-
sociations for the usefulness of specialists.
Thus, although the proposed method incorporates
adaptations of existing methods and concepts, our
work presents some notable differences compared to
the most similar approaches found in the literature on
association rule post-processing. Primarily, it is fo-
cused on the user’s interest in a specific item. Due to
this emphasis, we address the item of interest more
comprehensively, acknowledging its relevance both
in the antecedent and consequent of the rule. There-
fore, pruning, grouping, and visualization operations
are optimized to meet the user’s needs.
5 CONCLUSIONS
Developing an effective method in Association Rule
Mining (ARM) is crucial to harness the exploratory
nature inherent in this process, as it can result in many
rules, making it challenging for a domain-specific ex-
pert to manipulate and analyze them later. Unlike the
4
https://learn.microsoft.com/en-us/analysis-
services/data-mining/browse-a-model-using-the-
microsoft-association-rules-viewer?view=asallproducts-
allversions#BKMK Dependency
inductive bias of supervised approaches, ARM seeks
statistically relevant patterns without relying on a spe-
cific target variable. Instead of simply filtering by
the item of interest and potentially concealing rele-
vant relationships, the proposed method allows the se-
lection of rules that, even without directly containing
the item of interest, share other items with those that
do. This approach promotes knowledge discovery by
highlighting complex and valuable connections in the
dataset and is beneficial for domain experts seeking
specific insights into their datasets, contributing sig-
nificantly to understanding and interpreting the rela-
tionships in the data.
A limitation of the work is that the proposed
method only considers rules with a maximum size
of three, which may lead to the exclusion of poten-
tially relevant rules and limit the scope of the anal-
ysis. Furthermore, the method depends on the rules
generated by the ARM algorithm and the parameters
defined to create them. For example, rare items may
only appear if the minimum support used to generate
the rules is lower than the frequency of the item in
the database. For future work, we plan to assess dif-
ferences in the formed rule groupings by considering
various evaluation measures. In the graphical repre-
sentation, there is room for improvement in visualiza-
tion, particularly in areas with significant edge over-
lap. Additionally, we aim to enhance the level of de-
tail in the graphs by incorporating additional informa-
tion about the rules, such as support, confidence, and
the evaluation measure used for forming the group-
ings. These enhancements are expected to contribute
to a more comprehensive and complete analysis of the
associations within rule groupings.
A Post-Processing Strategy for Association Rules in Knowledge Discovery
129

REFERENCES
Agrawal, R., Imieli
´
nski, T., and Swami, A. (1993). Min-
ing association rules between sets of items in large
databases. ACM SIGMOD Record, 22:207–216.
Agrawal, R. and Srikant, R. (1994). Fast algorithms
for mining association rules in large databases. In
Proceedings of the 20th International Conference on
Very Large Data Bases, page 487–499. Morgan Kauf-
mann Publishers Inc.
Baesens, B., Viaene, S., and Vanthienen, J. (2000). Post-
processing of association rules. In KDD ’00: Proceed-
ings of the Sixth ACM SIGKDD International Confer-
ence on Knowledge Discovery and Data Mining. Spe-
cial workshop on post-processing in machine learning
and data mining: interpretation, visualization, integra-
tion, and related topics. Association for Computing
Machinery.
Balasubramani, B. S., Shivaprabhu, V. R., Krishnamurthy,
S., Cruz, I. F., and Malik, T. (2016). Ontology-based
urban data exploration. In Proceedings of the 2nd
ACM SIGSPATIAL Workshop on Smart Cities and
Urban Analytics - UrbanGIS ’16, pages 1–8. ACM
Press.
Bayardo, R. J., Agrawal, R., and Gunopulos, D.
(2000). Constraint-based rule mining in large, dense
databases. Data Mining and Knowledge Discovery,
4:217–240.
Berka, P. (2018). Comprehensive concept description
based on association rules: A meta-learning approach.
Intelligent Data Analysis, 22:325–344.
Castro, G., Salvini, R., Soares, F. A., Nierenberg, A. A.,
Sachs, G. S., Lafer, B., and Dias, R. S. (2018). Ap-
plying Association Rules to Study Bipolar Disorder
and Premenstrual Dysphoric Disorder Comorbidity.
In 2018 IEEE Canadian Conference on Electrical &
Computer Engineering (CCECE), pages 1–4. IEEE.
Cheng, C.-W., Sha, Y., and Wang, M. D. (2016). Inter-
visar: An interactive visualization for association rule
search. In Proceedings of the 7th ACM International
Conference on Bioinformatics, Computational Biol-
ogy, and Health Informatics, pages 175–184. ACM.
de Padua, R., do Carmo, L. P., Rezende, S. O., and de Car-
valho, V. O. (2018). An analysis on community detec-
tion and clustering algorithms on the post-processing
of association rules. In 2018 International Joint Con-
ference on Neural Networks (IJCNN), volume 2018-
July, pages 1–7. IEEE.
Freitas, A. A. (2000). Understanding the crucial differ-
ences between classification and discovery of associ-
ation rules. ACM SIGKDD Explorations Newsletter,
2:65–69.
Hagberg, A. A., Schult, D. A., and Swart, P. J. (2008). Ex-
ploring network structure, dynamics, and function us-
ing networkx. In Varoquaux, G., Vaught, T., and Mill-
man, J., editors, Proceedings of the 7th Python in Sci-
ence Conference, pages 11 – 15, Pasadena, CA USA.
Hahsler, M. (2023). R package arules - min-
ing association rules and frequent itemsets.
https://www.rdocumentation.org/packages/arules/ver
sions/1.7-6. Accessed: 2023-08-05.
Hahsler, M. and Karpienko, R. (2017). Visualizing associa-
tion rules in hierarchical groups. Journal of Business
Economics, 87:317–335.
Han, J., Kamber, M., and Pei, J. (2012). Data Mining: Con-
cepts and Techniques. Elsevier Inc.
Han, J., Pei, J., Yin, Y., and Mao, R. (2004). Min-
ing frequent patterns without candidate generation:
A frequent-pattern tree approach. Data Mining and
Knowledge Discovery, 8:53–87.
Karimi-Majd, A.-M. and Mahootchi, M. (2015). A new
data mining methodology for generating new service
ideas. Information Systems and e-Business Manage-
ment, 13:421–443.
Kwon, J.-H. and Kim, E.-J. (2019). Accident prediction
model using environmental sensors for industrial in-
ternet of things. Sensors and Materials, 31:579.
Matetic, M., Bakaric, M. B., and Sisovic, S. (2015). Asso-
ciation rule mining and visualization of introductory
programming course activities. In Proceedings of the
16th International Conference on Computer Systems
and Technologies - CompSysTech ’15, volume 1008,
pages 374–381. ACM Press.
NetworkX Developers (2022). Net-
workx - network analysis in python.
https://networkx.org/documentation/networkx-2.8.8/.
Accessed: 2023-08-05.
Shinn, M. (2016). Forceatlas2 for python.
https://github.com/mwshinn/forceatlas2-python/.
Accessed: 2023-08-05.
Slyepchenko, A., Frey, B. N., Lafer, B., Nierenberg, A. A.,
Sachs, G. S., and Dias, R. S. (2017). Increased ill-
ness burden in women with comorbid bipolar and pre-
menstrual dysphoric disorder: data from 1 099 women
from STEP-BD study. Acta Psychiatrica Scandinav-
ica, 136(5):473–482.
Wei, L. and Scott, J. (2015). Association rule mining in
the us vaccine adverse event reporting system (vaers).
Pharmacoepidemiology and Drug Safety, 24:922–
933.
Weidner, D., Atzmueller, M., and Seipel, D. (2020).
Finding Maximal Non-redundant Association Rules
in Tennis Data, volume 12057 LNAI, pages 59–78.
Springer.
Zaki, M. (2000). Scalable algorithms for association min-
ing. IEEE Transactions on Knowledge and Data En-
gineering, 12:372–390.
Zhang, C., Xue, X., Zhao, Y., Zhang, X., and Li, T. (2019).
An improved association rule mining-based method
for revealing operational problems of building heat-
ing, ventilation and air conditioning (hvac) systems.
Applied Energy, 253:113492.
Zhang, C., Zhao, Y., Lu, J., Li, T., and Zhang, X. (2021).
Analytic hierarchy process-based fuzzy post mining
method for operation anomaly detection of building
energy systems. Energy and Buildings, 252:111426.
ICPRAM 2024 - 13th International Conference on Pattern Recognition Applications and Methods
130
