
RecViT: Enhancing Vision Transformer with Top-Down Information
Flow
ˇ
Stefan P
´
oco
ˇ
s
a
, Iveta Be
ˇ
ckov
´
a
b
and Igor Farka
ˇ
s
c
Faculty of Mathematics, Physics and Informatics, Comenius University Bratislava,
Mlynsk
´
a dolina F1, 842 48 Bratislava, Slovakia
Keywords:
Attention, Transformer, Recurrence, Adversarial Examples, Robustness, Heatmap.
Abstract:
We propose and analyse a novel neural network architecture — recurrent vision transformer (RecViT). Build-
ing upon the popular vision transformer (ViT), we add a biologically inspired top-down connection, letting the
network ‘reconsider’ its initial prediction. Moreover, using a recurrent connection creates space for feeding
multiple similar, yet slightly modified or augmented inputs into the network, in a single forward pass. As it has
been shown that a top-down connection can increase accuracy in case of convolutional networks, we analyse
our architecture, combined with multiple training strategies, in the adversarial examples (AEs) scenario. Our
results show that some versions of RecViT indeed exhibit more robust behaviour than the baseline ViT, on the
tested datasets yielding ≈18 % and ≈22 % absolute improvement in robustness while the accuracy drop was
only ≈1 %. We also leverage the fact that transformer networks have certain level of inherent explainability.
By visualising attention maps of various input images, we gain some insight into the inner workings of our
network. Finally, using annotated segmentation masks, we numerically compare the quality of attention maps
on original and adversarial images.
1 INTRODUCTION
Recent advances in deep learning provide remark-
able accuracy in many fields. Unfortunately, these
advances do not often include the robustness of the
systems, i.e. the ability to correctly process out-of-
distribution data, such as adversarial examples (AEs)
i.e., inputs created by addition of a subtle, yet care-
fully crafted noise which corrupts the correct clas-
sification (Szegedy et al., 2014). This often leaves
the networks unprotected and unsuitable for security-
critical applications, unless we can ensure a fully con-
trolled environment. Therefore, a need for transpar-
ent, explainable, and interpretable models is rising
(Vilone and Longo, 2020). Moreover, most of the cur-
rent neural network models are purely feed forward,
thus they only provide a bottom-up approach. On the
other hand, a biologically more plausible way, which
occurs also in the human visual cortex, is to combine
bottom-up approach with top-down connections (Ki-
etzmann et al., 2019).
In our work, we build upon the vision transformer
a
https://orcid.org/0000-0003-3799-7038
b
https://orcid.org/0000-0002-6396-9770
c
https://orcid.org/0000-0003-3503-2080
model (Dosovitskiy et al., 2021), which we augment
with a top-down connection. The extra information
flow is modelled by recurrently passing the activa-
tions of the class token from the output layer into the
input layer. This allows for a repetition of the clas-
sification process, where in subsequent iterations the
network can take into account its previous output as
well.
In addition, we also suggest several ways of mod-
ifying the network inputs, to fully utilise its capa-
bilities. These are later evaluated on adversarially-
generated data. We discover that one variant of
RecViT seems to be more robust, with only a slight
drop in accuracy on clean data. This supports the the-
ory of robustness–accuracy trade-off (Tsipras et al.,
2019). On the other hand, we also discover positive
correlation between clean and adversarial accuracy in
multiple runs of that specific variant, meaning that
those networks that perform well on original data, are
also more accurate on AEs, which seems to contradict
the aforementioned trade-off.
Moreover, we provide comparison of the acti-
vations of AEs with the activations of test-set ex-
amples by visualising the models’ attention maps.
The difference is also evaluated numerically, by
Pócoš, Š., Be
ˇ
cková, I. and Farkaš, I.
RecViT: Enhancing Vision Transformer with Top-Down Information Flow.
DOI: 10.5220/0012464700003660
Paper published under CC license (CC BY-NC-ND 4.0)
In Proceedings of the 19th International Joint Conference on Computer Vision, Imaging and Computer Graphics Theory and Applications (VISIGRAPP 2024) - Volume 3: VISAPP, pages
749-756
ISBN: 978-989-758-679-8; ISSN: 2184-4321
Proceedings Copyright © 2024 by SCITEPRESS – Science and Technology Publications, Lda.
749

computing the similarity between annotated seg-
mentation masks and the attention maps. Our re-
sults confirm that even a slight adversarial modifi-
cation of the input results in great changes of the
network attention. For reproducibility and trans-
parency, our source codes can be found on the address
https://github.com/Stefan78/RecViT.
This paper is structured as follows: First, we dis-
cuss the related work and similar architectures in sec-
tion 2. Then, in section 3, we describe the data (both
clean and adversarial) that we use for our experi-
ments. Section 4 follows with detailed description
of the proposed model and used training procedure.
Results of experiments regarding network robustness
are summarised in section 5. Further analysis of AEs
through attention maps is provided in section 6. We
conclude the paper and list the ideas for future work
in section 7.
2 RELATED WORK
The idea of incorporating a top-down mechanism in
convolutional neural networks for image classifica-
tion led to improvement upon previous state-of-the-
art models (Stollenga et al., 2014). The authors de-
signed an adaptive weighting of convolutional ker-
nels, which in subsequent iterations helped the net-
work to focus on more specific parts of the image,
instead of all image parts at once. In other lines of
work, vision transformers (ViTs) (Dosovitskiy et al.,
2021) have been proposed as the natural adaptation
of the transformer architecture (Vaswani et al., 2017)
for visual input. Currently, ViTs dominate the field of
computer vision, thus their robustness against AEs is
a hot topic. Recent research shows that they exhibit
similar robustness as convolutional networks, albeit
more specialised attacks still need to be considered
(Bai et al., 2021).
Since the ViTs play such an important role in
modern vision tasks, countless variations have been
proposed, a few of them already including some form
of recurrent connections. Perceiver (Jaegle et al.,
2021) was designed to be able to scale to high dimen-
sional inputs, by progressively reducing the dimen-
sionality using attention modules with (potentially)
shared weights. Another work (Gehrig and Scara-
muzza, 2023) uses recurrent blocks composed of mul-
tiple various parts including convolutions, attention
modules, LSTM modules, and more. Possibly the
most similar to our architecture is the RViT (Messina
et al., 2022). The key difference is that our model has
a recurrent connection only in the class token, patch
tokens are computed from the input in each iteration
Figure 1: Two pairs of input images (top) with their corre-
sponding adversarial examples (bottom) on CIFAR-10 (left
half) and PET (right half) datasets.
anew (thus allowing for an input sequence of slightly
varied images), while RViT uses recurrence also in
the patch tokens.
To the best of our knowledge, ours is the first
model to directly bind only the class token in ViTs,
and send the information for further processing, with-
out the need of having additional parameters.
3 DATA
3.1 Datasets
In this study, we analyse networks on two bench-
mark datasets for image classification: CIFAR-
10 (Krizhevsky, 2009) and Oxford-IIIT Pet (PET)
(Parkhi et al., 2012). CIFAR-10 consists of 32×32
pixel images, each belonging to one of ten classes
of animals or vehicles. On the other hand, the PET
dataset is much more diverse and complex, as there
are 37 classes altogether with variable image resolu-
tions, much higher than that of CIFAR-10. To achieve
consistent representations and evaluation, we trans-
form all the PET inputs to 224×224 pixel images. A
major advantage of the PET dataset is the availabil-
ity of pixel level trimap segmentations, distinguishing
the object of interest, the background, and the area in
between.
3.2 Generating Corrupted Input
To produce out-of-distribution images which are later
used for exploring the network robustness (and pro-
viding explanations), we follow the well researched
area of adversarial examples (AEs). AEs are such
inputs to machine learning models, which cause in-
tentional misclassification, even though they only
slightly differ from the original, correctly classified
VISAPP 2024 - 19th International Conference on Computer Vision Theory and Applications
750
+ + + ++
Class
Boxer
Bengal
Pug
E. Mau
Transformer encoder
MLP
0.9
0.1
0.0
0.0
Nx
Patch +
position embedding
[class]
token
Class
Boxer
Bengal
Pug
E. Mau
+ + + ++
Transformer encoder
MLP
0.2
0.7
0.1
0.0
Nx
[class]
token
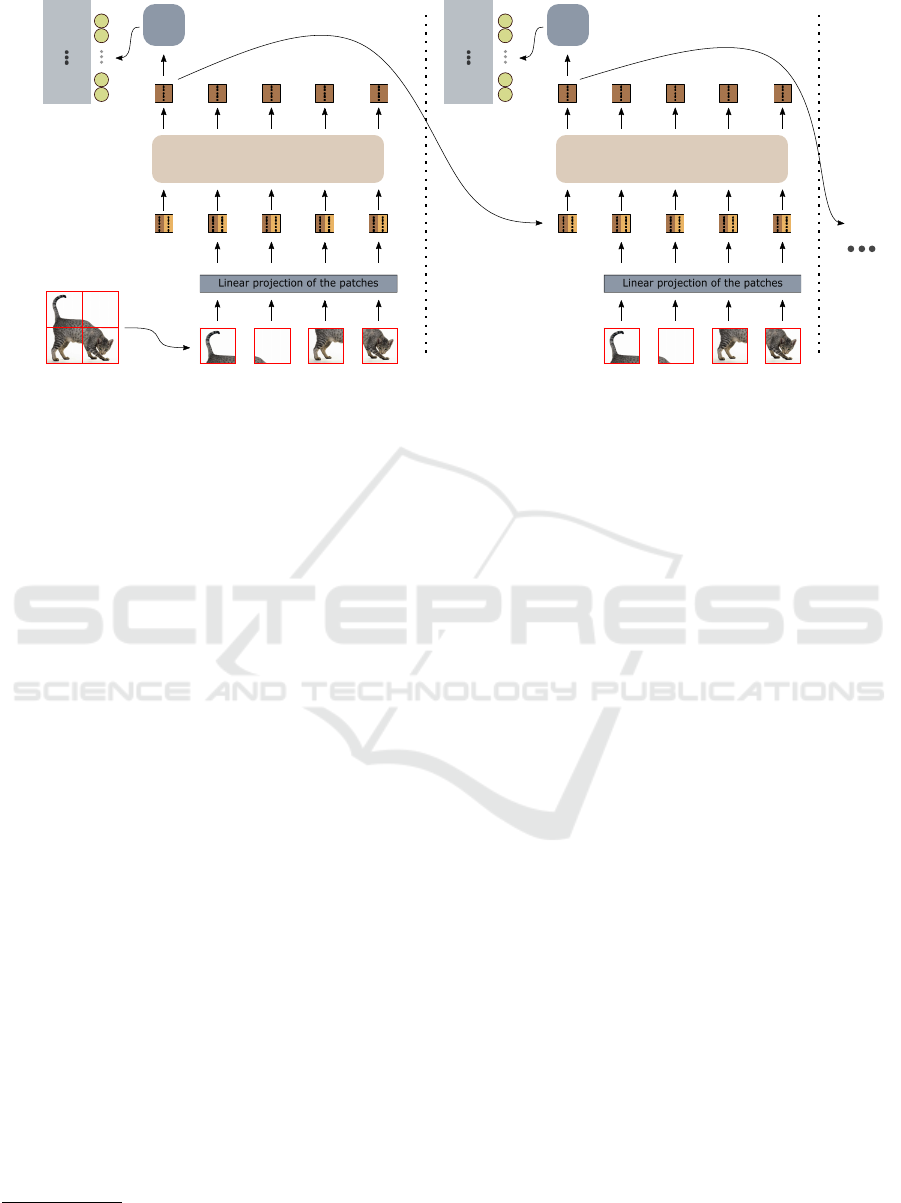
Figure 2: Two iterations of the RecViT architecture. After the first pass is computed, the resulting class token activation is
used in the second pass, simulating the top-down information flow.
inputs (Szegedy et al., 2014). AEs can be crafted
in numerous ways, however, when comparing the de-
fences it is often tricky to generate AEs in an unbiased
manner towards a certain model (Carlini et al., 2019).
To avoid bias, we opt to leverage the transferability
property of AEs (Liu et al., 2016), which basically
means that an AE fooling a specific network might
also fool other networks trained to perform the same
task.
For a fair comparison of ViT vs RecViT, we do not
generate the adversarial data on any transformer-type
network. Therefore, we begin by training 3 convolu-
tional networks with differing architectures on each of
the two datasets. To ensure high classification quality,
we fine-tune AlexNet, ResNet, and VGG, after which
we achieve 85.03 % (AlexNet), 91.52 % (ResNet) and
90.75 % (VGG) accuracy on CIFAR-10 and 74.27
%(AlexNet), 87.22 %(ResNet) and 89.15 %(VGG) on
PET dataset. The next step is to run the projected
gradient descent attack (PGD) (Madry et al., 2018)
individually on each network, resulting in AEs corre-
sponding to the networks.
1
Since the PGD attack be-
longs to a class of white-box adversarial attacks with
high transferability properties (Tram
`
er et al., 2018),
we can use it to test the robustness of other networks.
PGD attack utilises the gradient of the network w.r.t.
the input image x, slightly modifying it over multiple
iterations, according to the formula:
x(t + 1) = x(t) + αsign(∇
x
L(θ, x, y)), (1)
where α is the step size and L is the loss computed
from θ, representing the network parameters, and y
1
To generate AEs, we use the adversarial-robustness-
toolbox (Nicolae et al., 2018).
denotes the correct class. After each iteration, the in-
put is projected onto an L
∞
ball of radius ε centred in
the original input x. For the initial point x(0) a random
point within this ball is chosen.
In order to produce as diverse AEs as possible
(using the PGD attack), we gradually increase the
ε value, resulting in AEs with perturbation magni-
tude of ε ∈ {0.01, 0.02, ..., 0.2} for CIFAR-10 and
ε ∈ {0.07, 0.22, ..., 0.202} for PET. To also evaluate
the robustness on a set of particularly strong AEs, we
specifically distinguish a set of ‘cross-validated’ (C-
V) AEs i.e. those, which fool all of the three networks
used for their generation. It can be assumed that these
AEs are the most transferable, so they will have the
highest success for a random, unprotected network.
Altogether for each dataset we construct 4 groups of
AEs: the first three are disjoint, they are AEs that
were generated on AlexNet, ResNet, and VGG re-
spectively. The fourth group are the cross-validated
AEs. A sample of AEs for both of the datasets is
shown in Fig. 1.
4 RECURRENT ViT
Building upon the Vision Transformer model (Doso-
vitskiy et al., 2021), we design a network enhanced
with a recurrent connection. During image classifi-
cation using ViT, one has the option of using the so-
called class token, which serves as an extra represen-
tation (the rest are created by processing the image
patches). The class token at the top of the network
represents accumulated data about the image class,
which is further inserted to a relatively simple MLP
to produce the final classification. In our case, af-
RecViT: Enhancing Vision Transformer with Top-Down Information Flow
751

ter the network forward pass, the class token is sent
to a second iteration, in which the image patches are
computed in the same manner, but the class token al-
ready contains relevant information about the image
content.
2
Thus, we expect the network to focus on
particular image regions, which coincide with the rep-
resentations of the class token. A detailed scheme of
the architecture can be found in Fig. 2.
4.1 Training
For weight initialisation we use the ViT-Ti pre-
trained model, which is a relatively small setup of
a vision transformer, having ≈ 5.8M parameters
(Gani et al., 2022). Next, we set a fixed number
of iterations k after which we expect to have the
final prediction. During the training, we use back-
propagation through time (BPTT) to fully adjust the
shared weights through the whole computational
graph. Furthermore, we suggest two training modes,
differing in the way the loss function is defined.
The method 1 (M1) minimises the prediction er-
ror only between the last prediction and the desired
output. This emphasises the fact that only the last
prediction matters, allowing the network to actually
‘reconsider’ and change its prediction from iteration
to iteration:
Loss = L
CE
(θ
1
;d, f
θ
2
(c
k−1
)), (2)
where L
CE
is the cross-entropy loss, θ
1
denotes the
model parameters, d is the target class and f
θ
2
is the
MLP directing the classification of the class token
c
k−1
in the final iteration.
The method 2 (M2) optimises predictions in each
time step. This promotes the idea that even the first
‘guess’ of the network should be valid (the subse-
quent iterations could then be interpreted as asking
the network ‘Are you sure that this image belongs to
this class?’), and in case of different inputs across re-
currence (which we elaborate on further in the text),
that all predictions matter equally. The loss is con-
structed as follows (using the same nomenclature as
in M1):
Loss =
k−1
∑
t=0
L
CE
(θ
1
;d, f
θ
2
(c
t
)). (3)
4.2 Input Modification Strategies
Besides providing options for the network to recon-
sider its initial prediction, recurrent connection also
2
For the implementation we extend the timm library
(Wightman, 2019).
Figure 3: Visualisation of three different methods of input
augmentation for RecViT within 4 iterations.
creates space to compute a single prediction from
multiple different inputs. We take advantage of this
property and provide a form of additional data into
the network, making sure the original image is always
included. Below, we describe the tested options, also
shown in Fig. 3.
Vanilla. This version provides no augmentation. All
inputs are the same picture.
Random Transform (RandT). Here we try to
simulate the way people perceive an object. The
object might be moving, or the person might be
tilting their head, so that the object is relatively
not at the same place for the duration of the object
recognition. Therefore, we augment the original
image by transforming it randomly, given translation,
rotation, and scaling values. The transform parame-
ters are computed beforehand and the transformation
is repeated in each iteration (applied to the previous
input), progressively altering the original input.
Blur. This strategy implements Gaussian blur of the
input. By using blur of various strengths, we prompt
the network to focus on different levels of detail.
First, the input is unchanged, but as we proceed
to further iterations the image gets more and more
blurred.
Inverse Blur (InvBlur). The idea is based on blurring
the images as well, however with inverted order of
inputs. The first input is blurred the most and by the
time we reach the final iteration, the image is perfectly
clear. This aligns better with human perception, as
people also see the ‘big picture’ first, and only notice
the tiny details later.
VISAPP 2024 - 19th International Conference on Computer Vision Theory and Applications
752
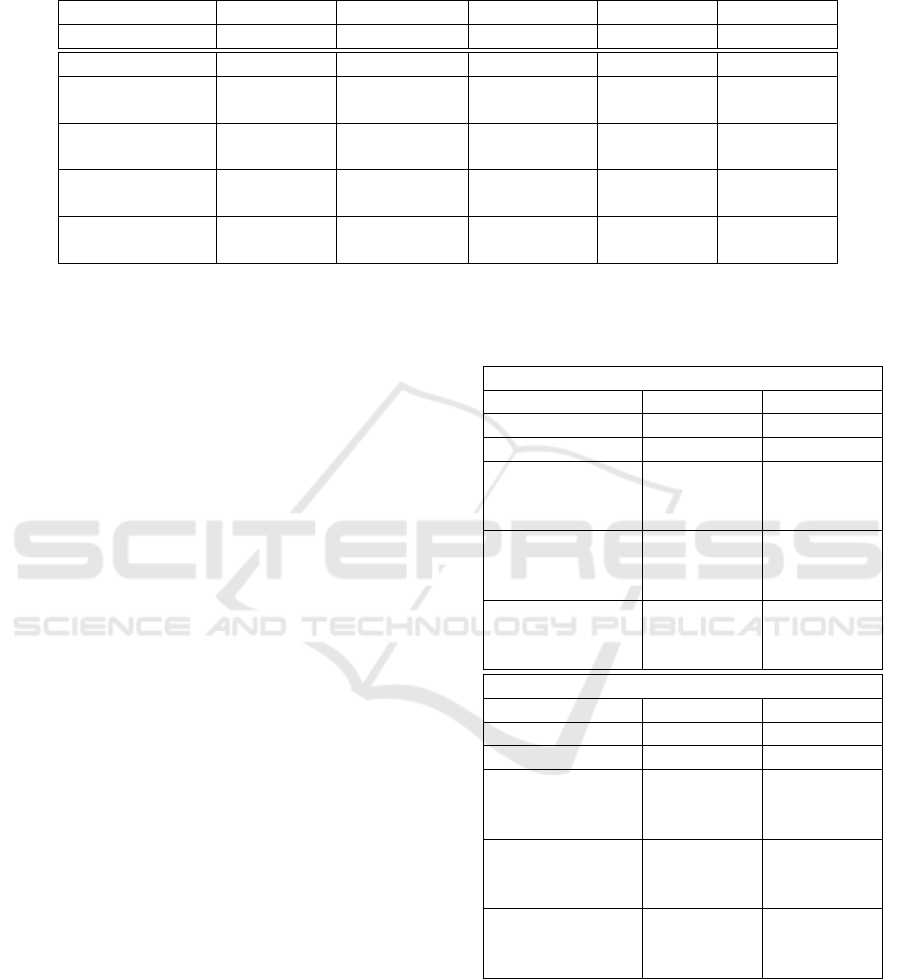
Table 1: Average accuracy (in %) and standard deviation on PET dataset and generated AEs. For Baseline ViT we trained 10
runs, all other variants were 5 runs. Experiments were run for k ∈ {2, 3, 4}. For brevity, we only include results of the best
performing k for each RecViT variant and training method.
Test-set AlexNet AEs ResNet AEs VGG AEs C-V AEs
RecViT variant Mean±Std Mean±Std Mean±Std Mean±Std Mean±Std
Baseline ViT 88.80±0.57 9.26±1.37 14.67±1.90 8.96±1.87 10.66±1.42
Vanilla M1, k=3 89.60±0.54 9.52±1.14 17.19±1.66 10.10±0.97 11.83±1.02
Vanilla M2, k=2 88.67±0.31 9.68±0.90 19.62±1.21 11.49±0.97 13.06±0.81
RandT M1, k=2 89.02±0.24 11.24±0.89 17.58±2.35 12.65±1.56 13.58±1.22
RandT M2, k=2 88.05±0.99 11.17±0.98 18.18±3.94 12.22±0.57 13.28±1.49
Blur M1, k=3 85.23±5.66 12.75±3.34 16.89±3.79 11.36±3.75 13.43±3.56
Blur M2, k=4 87.42±1.56 13.43±2.81 18.83±3.58 12.54±3.14 14.62±3.09
InvBlur M1, k=2 86.99±0.98 15.57±3.60 24.91±10.70 17.83±6.95 18.93±6.63
InvBlur M2, k=2 85.27±1.28 17.04±1.21 28.65±3.79 17.87±2.03 20.54±2.15
5 RESULTS
In this section we analyse in detail the classification
capabilities of RecViT models on original data and
AEs (further referred to as the robustness of the net-
works).
5.1 Robustness Evaluation
We start with training RecViT networks for each com-
bination of the two methods of loss computation,
and four strategies of data manipulation, with varying
number of maximum iterations: k ∈ {2, 3, 4}. This
results in 24 models and for each of those we have 5
runs, to ensure statistically sound evaluation. These
networks are then tested for robustness, as well as for
the accuracy on clean data. In Table 1 we display a
subset of the results, where for each RViT variant we
choose the best k. For baseline we trained 10 runs of
unmodified ViT (Baseline ViT).
As we can see in comparison with the Baseline
ViT, there is a slight increase in robustness for RandT
and Vanilla networks, without significant decrease
in accuracy. On the other hand, the networks with
blurred input yield higher robustness, though with a
slight (≈ 3%) drop in accuracy. This trade-off is fur-
ther elaborated on in subsection 5.3.
5.2 Comparison with ViT
Since our best performing model (regarding the ro-
bustness and clean accuracy) used blurred data, we
further analyse the contribution of recurrent connec-
tion. In order to do a fair comparison, the ViT should
use the same data as the RecViT. For that means we
simulated the input conditions for a Baseline ViT.
When comparing with RecViT with a given k (Blur or
Table 2: Comparison of accuracy and robustness of RecViT
models with ViT Blur models.
PET
Test-set C-V AEs
RecViT variant Mean±Std Mean±Std
Baseline ViT 88.80±0.57 10.66±1.42
InvBlur M1, k=2 86.99±0.98 18.93±6.63
InvBlur M1, k=3 86.32±1.25 14.83±5.48
InvBlur M1, k=4 85.33±2.74 10.58±2.16
InvBlur M2, k=2 85.27±1.28 20.54±2.15
InvBlur M2, k=3 78.09±7.14 21.83±4.91
InvBlur M2, k=4 74.31±5.54 22.36±2.26
ViT Blur k=2 86.21±0.83 18.20±1.25
ViT Blur k=3 79.19±1.50 15.33±2.03
ViT Blur k=4 68.45±3.37 12.71±2.21
CIFAR-10
Test-set C-V AEs
RecViT variant Mean±Std Mean±Std
Baseline ViT 97.64±0.11 45.78±1.92
InvBlur M1, k=2 97.44±0.09 43.89±2.98
InvBlur M1, k=3 97.43±0.12 44.85±2.12
InvBlur M1, k=4 97.44±0.04 45.09±2.04
InvBlur M2, k=2 96.46±0.14 67.67±1.67
InvBlur M2, k=3 95.12±0.25 69.88±1.95
InvBlur M2, k=4 94.97±0.15 68.32±1.01
ViT Blur k=2 97.53±0.05 50.96±3.13
ViT Blur k=3 96.04±1.25 54.61±2.04
ViT Blur k=4 93.51±1.47 53.11±2.91
InvBlur), we train the ViT using data with the same
amount of blur, as are in the inputs to RecViT (in
each iteration, the exact amount was chosen randomly
amongst the possible values). In the testing phase, in-
stead of computing a single forward pass (for the orig-
inal image), we compute k passes, one for each of the
possible inputs with varying amount of blur. The fi-
nal classification is computed by averaging the logits
RecViT: Enhancing Vision Transformer with Top-Down Information Flow
753
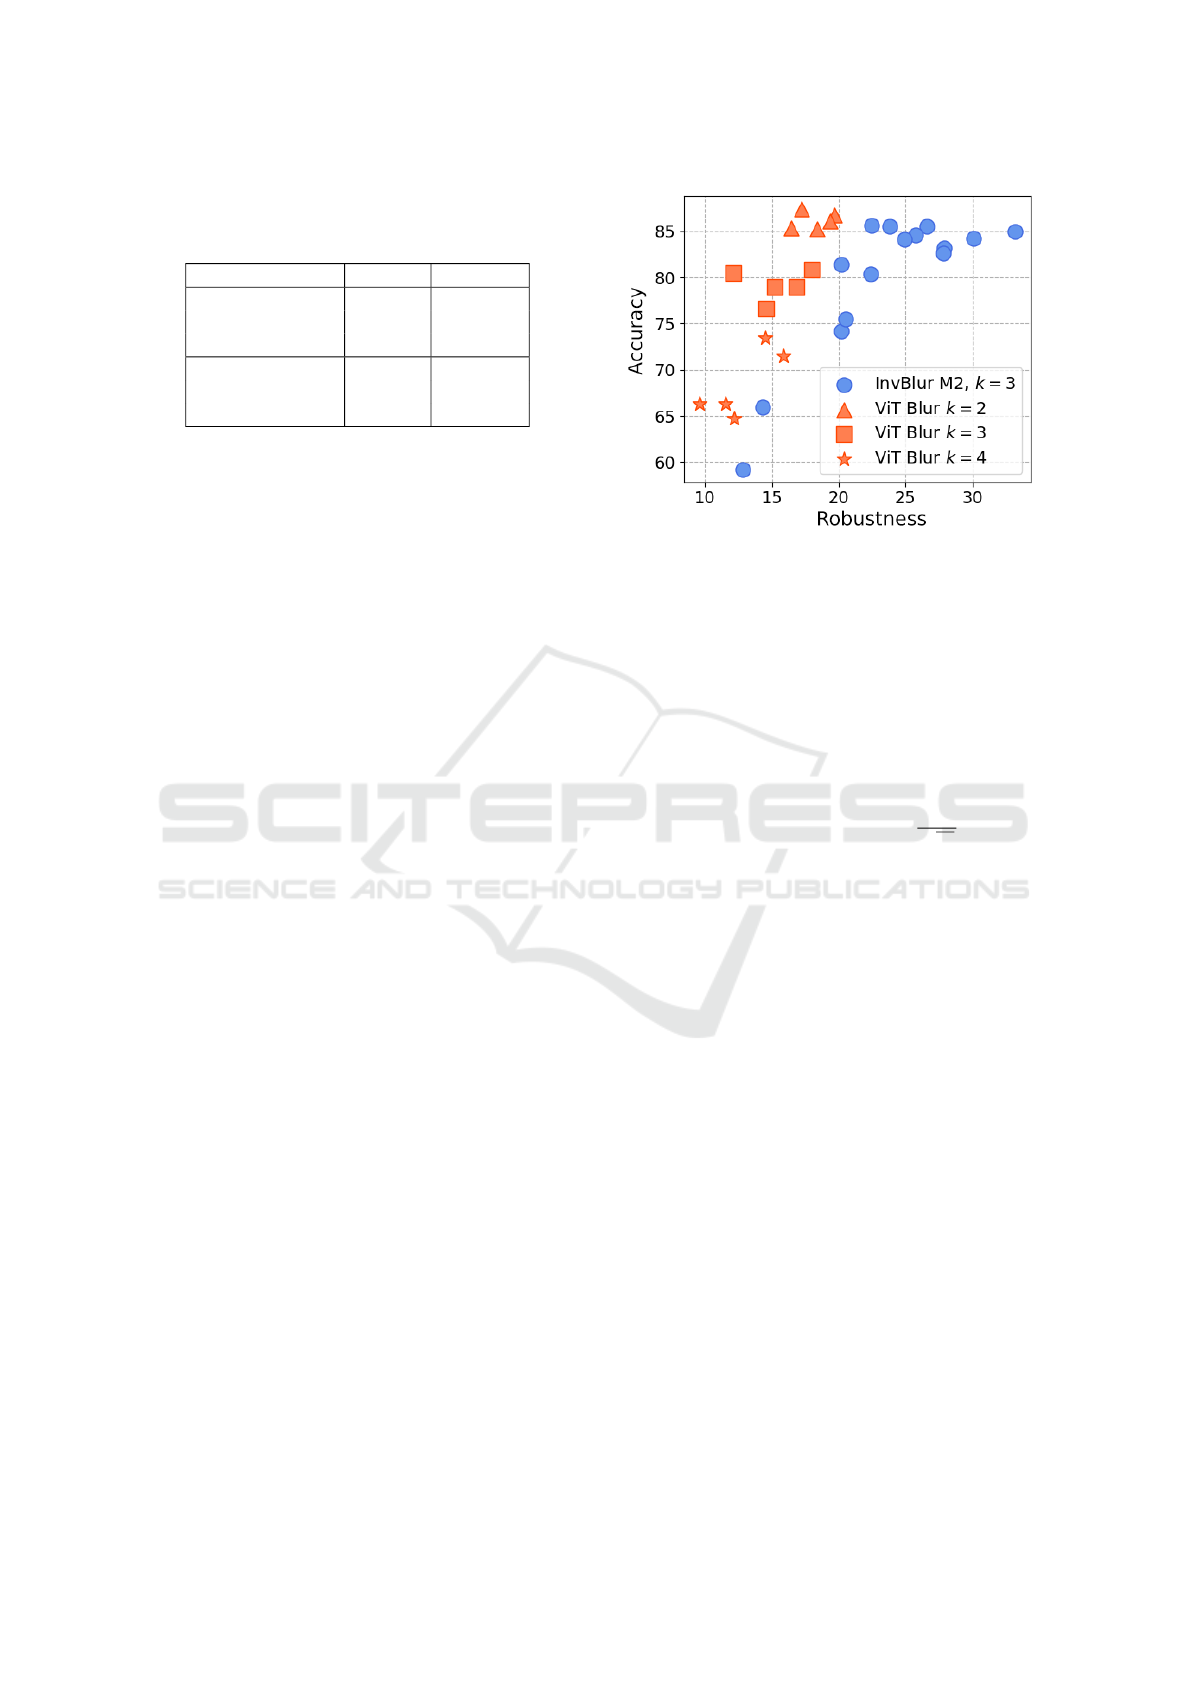
Table 3: Average accuracy and robustness (in %) of the top
3 runs (according to the test-set performance) from InvBlur
RecViT models trained on PET dataset.
Test-set C-V AEs
InvBlur M1, k=2 88.13 28.44
InvBlur M1, k=3 87.68 21.11
InvBlur M1, k=4 88.15 12.47
InvBlur M2, k=2 87.14 24.02
InvBlur M2, k=3 85.59 24.28
InvBlur M2, k=4 84.01 26.53
from individual forward passes. This way we gen-
erate networks similar to our RecViTs with blurred
inputs, referred to as ViT Blur.
The resulting Table 2 including PET and CIFAR-
10 results show consistent trend. Our RecViT outper-
forms the ViT Blur mainly regarding the robustness–
accuracy trade-off, suggesting that the recurrent con-
nection in RecViT indeed utilises the better computa-
tional capabilities of the networks.
5.3 Robustness–Accuracy Trade-Off
In previous two sections we determined the most ro-
bust models to be the RecViT InvBlur trained with the
method 2. However, those have in some cases (mostly
for the PET dataset) somewhat unstable performance,
the accuracy and robustness seems to vary a lot. From
this we deduce that since the images are blurred and
the PET is more challenging task than CIFAR-10,
the instability may result from sub-optimal hyperpa-
rametes. The solution would be to perform a more
thorough hyperparameter search, or to train multi-
ple runs and choose the best performing model on
the validation set. We chose the second option and
trained a larger sample of InvBlur RecViT models
(15 runs for each combination of training method and
k ∈ {2, 3, 4}). Given the results in Table 3 where
we take the top 3 best performing models from each
RecViT group, we end up with substantially better
robustness-accuracy trade-off.
In Fig. 4 we visualise the robustness–accuracy
trade-off for one of the best performing RecVit mod-
els with the ViT Blur counterpart. Due to having dif-
ferent number of runs, we include ViT Blur models
with varying k. Moreover, we computed the correla-
tion coefficient between accuracy and robustness for
all InvBlur RecViT models. To our surprise, we de-
tected average (across k) correlation coefficients of
0.57 and 0.81 for InvBlur RecViT networks trained
with M1 and M2 respectively. This also means that
further enhancing the accuracy via deeper optimisa-
tion might heighten the robustness levels as well.
Figure 4: Visualisation of the robustness vs accuracy of
individual InvBlur RecViT networks trained with M2 and
k=3, compared to ViT Blur models with various k.
6 HEATMAP COMPARISON
Unlike traditional convolutional networks, ViTs come
with an inherent way to depict their inner behaviour.
The same holds for the RecViT. By having self-
attention module partly defined by the equation
attention(Q, K, V ) = softmax(
QK
T
√
d
k
)V , (4)
we are able to directly extract the information flow for
the class token in the form of importances per each
image patch (Vaswani et al., 2017). To our advantage,
we can compare the heatmaps extracted from RecViT
with the trimap segmentation masks for PET dataset.
Our goal is to compare the heatmaps in RecViT over
input from various sources.
The key comparison is to visualise the activations
of AEs vs original images. There are studies, which
compare heatmaps of AEs vs originals (Dong et al.,
2017; Xu et al., 2019; Kotyan and Vargas, 2021).
However, those were based either on other visuali-
sation methods (not inherent) or different aspects of
AEs.
Inspired by recent work (Rieger and Hansen,
2020), we compute the cosine similarity between pro-
duced attention maps and the trimap segmentation
masks. To normalise both to the same range, we first
scale the attention maps linearly to the range [−1, 1].
Then we also modify the segmentation maps, so that
the value of −1 corresponds to the background (and
the black padded area), 1 to the object of interest, and
0 to the border area. The similarity between the seg-
mentation mask S and the attention scores A is com-
puted according to equation:
VISAPP 2024 - 19th International Conference on Computer Vision Theory and Applications
754
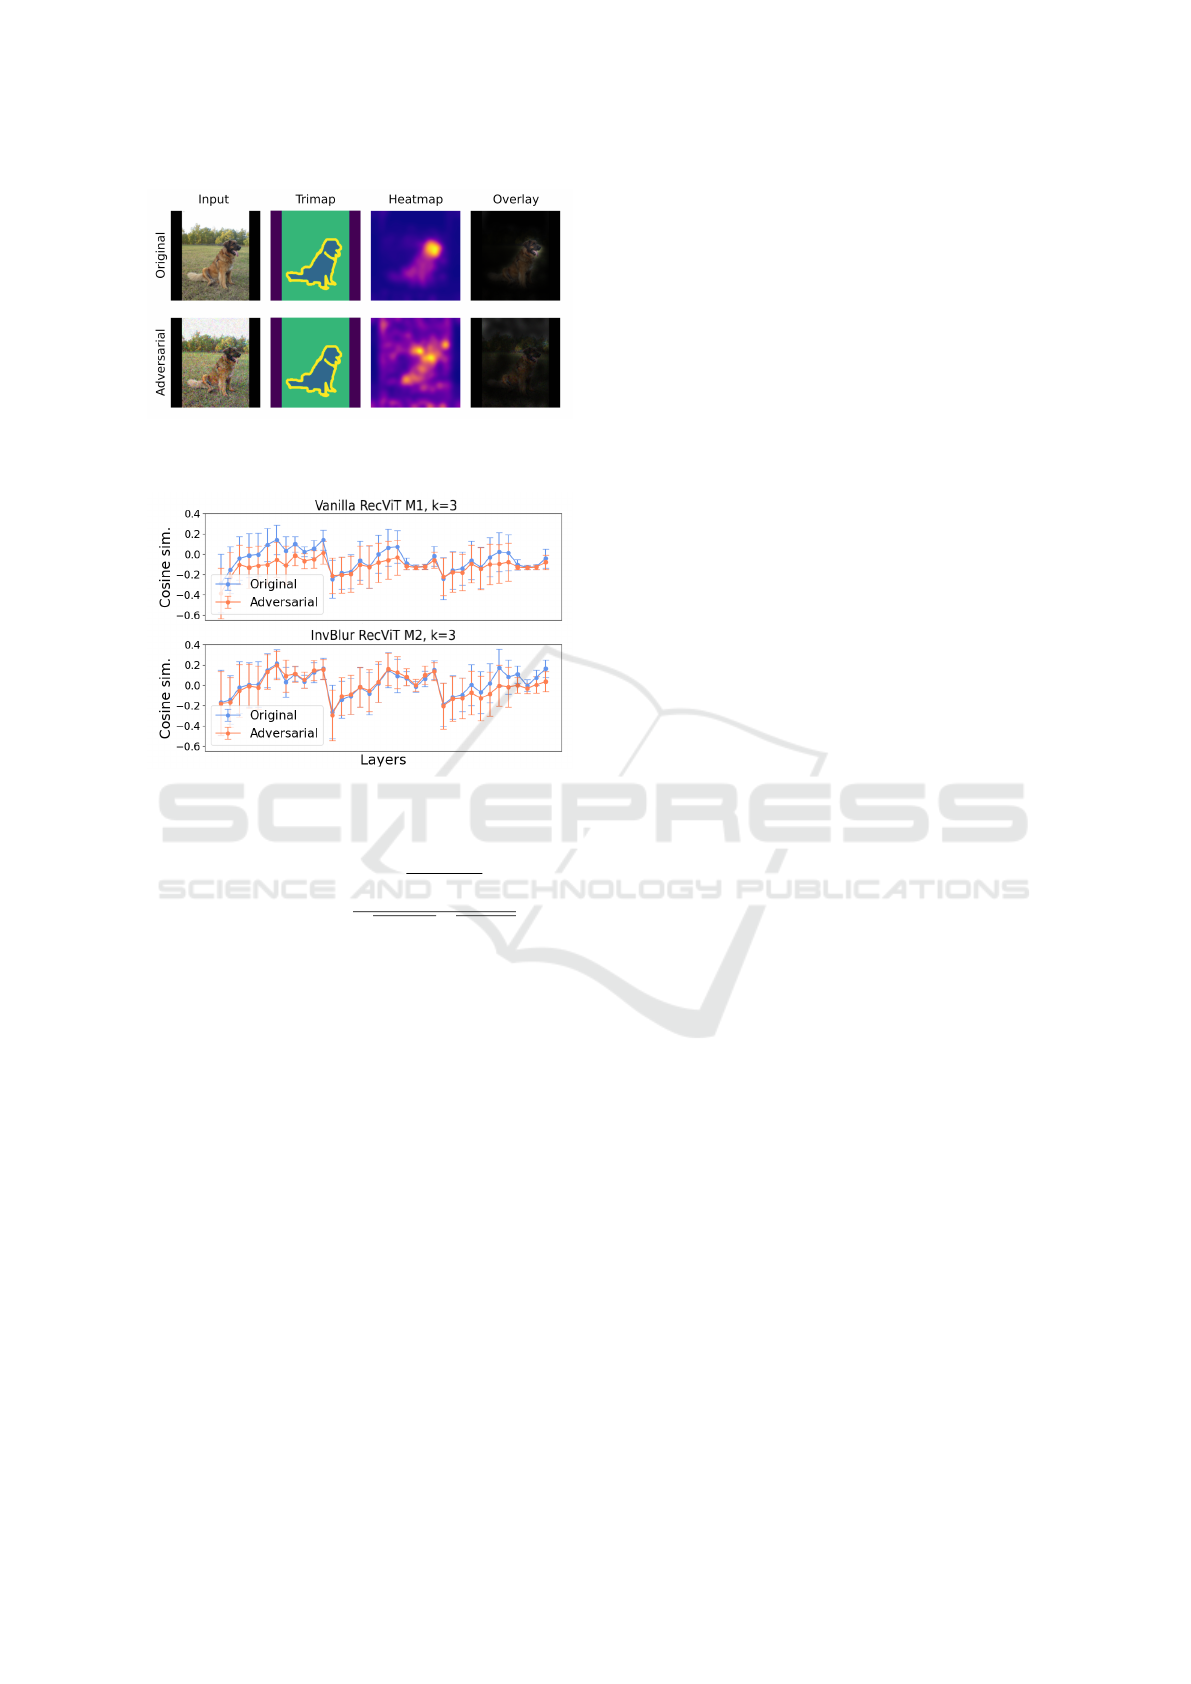
Figure 5: Comparison of attention activation for an AE and
the original image in a vanilla RecViT network on layer 8,
trained with method 1, k=3.
Figure 6: Development of similarity scores of AEs vs orig-
inal images on two selected networks, computed using 150
AE/original pairs. The x-axis (layers) represents individual
attention modules.
cosine sim(S, A) =
q
∑
N
i=1
A
i
S
i
q
∑
N
i=1
A
2
i
q
∑
N
i=1
S
2
i
. (5)
After visually examining the attention maps, we
clearly see that the AEs have worse overlay with the
true object — we can see an example of that in Fig. 5.
To support our claim that this phenomenon occurs
consistently we plot the average cosine similarity be-
tween segmentation masks and attention scores of
AEs and the original images on a selected RecViT
network (Fig. 6). High deviation in the similarity
scores, present in the graph, is mostly caused by the
varying area of the objects of interest in the images.
As the matter of fact, the AEs only rarely produce
a better match with the segmentation masks than the
original examples, and this holds for all of our tested
networks. Interestingly, in some RecViT networks
(particularly more robust ones) we notice that the
overlap of AEs is on par with that of the original ex-
amples. This observation could be investigated in a
future, more detailed analysis.
7 CONCLUSION
We proposed a novel transformer-like architecture
with recurrence in class token (RecViT), to simulate
a top-down connection, providing the network an op-
tion to reconsider its initial prediction. Since it can
also process a sequence of inputs instead of a sin-
gle image, the computational capacity of the RecViT
seems to be better utilised. We hypothesise that the
capacity increase could be the reason why some vari-
ants of RecViT demonstrate higher robustness against
the tested adversarial examples. This behaviour could
be further investigated more in depth using more di-
verse attack methods.
One of the most prominent results is the fact that
BlurInv RecViT networks, which showed the high-
est accuracy on AEs, exhibit high positive correlation
between clean and adversarial accuracy. This seems
to contradict the robustness–accuracy trade-off. This
positive correlation also suggests that clean accuracy
(which is often known) could be used as a guide to
pick the best performing networks, without risking
a drop in robustness. Choosing the best performing
models we achieved ≈ 18% increase in robustness
with only 1 % drop in clean accuracy on PET dataset.
On CIFAR-10 the drop in clean accuracy was similar,
while robustness increase reached up to 22 %.
Since the idea of having a top-down connection in
ViTs has proven useful, it would be beneficial to fur-
ther investigate this model. Some ideas for a follow-
up, which we hope will bring improvements, are to
use adversarial training and to have more robust data
augmentation while categorising a single input.
Yet another usage of RecViT is to exploit the dif-
ferences in heatmaps of the self-attention modules,
when passing through a normal example vs an adver-
sarial example. This discrepancy could be used as a
partial defence against adversarial attacks.
ACKNOWLEDGEMENTS
This research was carried out in the framework
of the Horizon Europe project TERAIS, GA No.
101079338. It was funded in part by Horizon 2020
project TAILOR, GA No. 952215 and by national
project KEGA 022UK-4/2023.
REFERENCES
Bai, Y., Mei, J., Yuille, A. L., and Xie, C. (2021). Are
transformers more robust than CNNs? In Advances in
RecViT: Enhancing Vision Transformer with Top-Down Information Flow
755

Neural Information Processing Systems, volume 34,
pages 26831–26843. Curran Associates, Inc.
Carlini, N., Athalye, A., Papernot, N., Brendel, W., Rauber,
J., Tsipras, D., Goodfellow, I., Madry, A., and Ku-
rakin, A. (2019). On evaluating adversarial robust-
ness. arXiv preprint arXiv:1902.06705.
Dong, Y., Su, H., Zhu, J., and Bao, F. (2017). Towards
interpretable deep neural networks by leveraging ad-
versarial examples. arXiv preprint arXiv:1708.05493.
Dosovitskiy, A., Beyer, L., Kolesnikov, A., Weissenborn,
D., Zhai, X., Unterthiner, T., Dehghani, M., Minderer,
M., Heigold, G., Gelly, S., Uszkoreit, J., and Houlsby,
N. (2021). An image is worth 16x16 words: Trans-
formers for image recognition at scale. In Interna-
tional Conference on Learning Representations.
Gani, H., Naseer, M., and Yaqub, M. (2022). How to train
vision transformer on small-scale datasets? arXiv
preprint arXiv:2210.07240.
Gehrig, M. and Scaramuzza, D. (2023). Recurrent vision
transformers for object detection with event cameras.
In Proceedings of the IEEE/CVF Conference on Com-
puter Vision and Pattern Recognition, pages 13884–
13893.
Jaegle, A., Gimeno, F., Brock, A., Vinyals, O., Zisserman,
A., and Carreira, J. (2021). Perceiver: General percep-
tion with iterative attention. In International Confer-
ence on Machine Learning, pages 4651–4664. PMLR.
Kietzmann, T., Spoerer, C., S
¨
orensen, K., Cichy, R., Hauk,
O., and Kriegeskorte, N. (2019). Recurrence is re-
quired to capture the representational dynamics of the
human visual system. Proceedings of the National
Academy of Sciences, 116:201905544.
Kotyan, S. and Vargas, D. V. (2021). Deep neural network
loses attention to adversarial images. arXiv preprint
arXiv:2106.05657.
Krizhevsky, A. (2009). Learning multiple layers of fea-
tures from tiny images. Technical report, University
of Toronto.
Liu, Y., Chen, X., Liu, C., and Song, D. (2016). Delving
into transferable adversarial examples and black-box
attacks. arXiv preprint arXiv:1611.02770.
Madry, A., Makelov, A., Schmidt, L., Tsipras, D., and
Vladu, A. (2018). Towards deep learning models re-
sistant to adversarial attacks. In International Confer-
ence on Learning Representations.
Messina, N., Amato, G., Carrara, F., Gennaro, C., and
Falchi, F. (2022). Recurrent vision transformer for
solving visual reasoning problems. In International
Conference on Image Analysis and Processing, pages
50–61. Springer.
Nicolae, M.-I., Sinn, M., Tran, M. N., Buesser, B., Rawat,
A., Wistuba, M., Zantedeschi, V., Baracaldo, N.,
Chen, B., Ludwig, H., Molloy, I., and Edwards,
B. (2018). Adversarial robustness toolbox v1.2.0.
https://arxiv.org/pdf/1807.01069.
Parkhi, O. M., Vedaldi, A., Zisserman, A., and Jawahar,
C. V. (2012). Cats and dogs. In IEEE Conference
on Computer Vision and Pattern Recognition.
Rieger, L. and Hansen, L. K. (2020). A simple defense
against adversarial attacks on heatmap explanations.
arXiv preprint arXiv:2007.06381.
Stollenga, M. F., Masci, J., Gomez, F., and Schmidhuber,
J. (2014). Deep networks with internal selective at-
tention through feedback connections. Advances in
Neural Information Processing Systems, 27.
Szegedy, C., Zaremba, W., Sutskever, I., Bruna, J., Erhan,
D., Goodfellow, I., and Fergus, R. (2014). Intriguing
properties of neural networks. In International Con-
ference on Learning Representations.
Tram
`
er, F., Kurakin, A., Papernot, N., Goodfellow, I.,
Boneh, D., and McDaniel, P. (2018). Ensemble adver-
sarial training: Attacks and defenses. In International
Conference on Learning Representations.
Tsipras, D., Santurkar, S., Engstrom, L., Turner, A., and
Madry, A. (2019). Robustness may be at odds with
accuracy. In International Conference on Learning
Representations.
Vaswani, A., Shazeer, N., Parmar, N., Uszkoreit, J., Jones,
L., Gomez, A. N., Kaiser, Ł., and Polosukhin, I.
(2017). Attention is all you need. Advances in Neural
Information Processing Systems, 30.
Vilone, G. and Longo, L. (2020). Explainable artificial
intelligence: a systematic review. arXiv preprint
arXiv:2006.00093.
Wightman, R. (2019). Pytorch image models. GitHub
repository.
Xu, K., Liu, S., Zhang, G., Sun, M., Zhao, P., Fan, Q., Gan,
C., and Lin, X. (2019). Interpreting adversarial exam-
ples by activation promotion and suppression. arXiv
preprint arXiv:1904.02057.
VISAPP 2024 - 19th International Conference on Computer Vision Theory and Applications
756
