
Neuromotor Pattern of the Upper Limb in Hygiene Activities Using
Electromyography and Accelerometery Technology
Patrícia Santos
1,2,3 a
, Inês Garcia
1b
, Carla Quintão
1,2 c
and Claúdia Quaresma
1,2 d
1
LIBPhys, NOVA School of Science and Technology, NOVA University of Lisbon,
2829-516 Caparica, Portugal
2
Physics Department, NOVA School of Science and Technology, NOVA University of Lisbon,
2829-516 Caparica, Portugal
3
Health Department, Superior School of Health, Polytechnic Institute of Beja, 7800-111 Beja, Portugal
Keywords: Upper Limb, Activities of Daily Living, Electromyography, Accelerometery, Technology, Biomechanics.
Abstract: The technology is a valuable resource for movement analysis, especially for complex movement patterns such
as those of the upper limb during activities of daily living (ADLs). Characterizing these patterns in healthy
individuals is crucial to detect abnormal and compensatory movements resulting from neurological
dysfunctions. This study aimed to characterize the neuromuscular activation pattern of the upper limb during
the washing of the contralateral limb in 36 healthy individuals. The Biosignalsplux® equipment was used to
monitor the activity of the main shoulder muscles, that is, Pectoralis Major (PM), Anterior Deltoid (AD),
Middle Deltoid (MD), Posterior Deltoid (PD), Upper Trapezius (UT) and Lower Trapezius (LT), through
electromyography (EMG) and accelerometry (ACC). The results show variations in the contraction pattern in
the different phases of the activity. With this study it was possible to establish the normalized pattern of the
activity of EMG and ACC of the shoulder complex and respective movement phases.
1 INTRODUCTION
Technology is crucial in the analysis of movement
patterns, especially when compared to more common
assessment tools based on scales that do not provide
a detailed and accurate analysis of motion (Alt
Murphy, 2006; Gil-Agudo et al., 2013; de los Reyes-
Guzmán et al., 2010). The use of sensors in
movement analysis has increased (Bleser et al., 2015;
Özdemir & Barshan, 2014), allowing the acquisition
of high-precision data (Jalloul et al., 2018),
particularly in the analysis of complex movement
patterns, such as those performed during Activities of
Daily Living (ADLs). Using biosensors, it is possible
to identify normal movement patterns in ADLs.
The relationship between the variables obtained
with the biosensors helps to understand in which
phases of activity a movement pattern appears to be
normal or not, helping to identify abnormal patterns
a
https://orcid.org/0000-0002-3569-2495
b
https://orcid.org/0009-0002-5357-5919
c
https://orcid.org/0000-0003-1015-4655
d
https://orcid.org/0000-0001-9978-261X
and, thus, detecting the presence of associated
dysfunctions early (Jalloul et al., 2018).
Impairment of the normal pattern of upper limb
movement is one of the most common neurological
sequelae (Nakayama et al., 1994), which leads to loss
of autonomy due to functional changes in the elbow
and shoulder, and consequently they also affect
normal reaching and grasping (Klein et al., 2011).
These motor compensations can result in
musculoskeletal pain or overuse injuries (Levin et al,
2009), accentuating existing disability.
Given that the involvement of the upper limbs is a
prerequisite for performing ADLs, it is essential to
objectively analyse the neuromotor pattern of the
upper limb in them (Gulde & Hermsdorfer, 2017),
however, there is a gap in studies at this level.
ADLs such as hygiene involve multiple tasks and
phases and need to be analysed from the perspective
of movement variability and contraction patterns of
Santos, P., Garcia, I., Quintão, C. and Quaresma, C.
Neuromotor Pattern of the Upper Limb in Hygiene Activities Using Electromyography and Accelerometery Technology.
DOI: 10.5220/0012463900003657
In Proceedings of the 17th International Joint Conference on Biomedical Engineering Systems and Technologies (BIOSTEC 2024) - Volume 1, pages 799-806
ISBN: 978-989-758-688-0; ISSN: 2184-4305
Copyright © 2024 by Paper published under CC license (CC BY-NC-ND 4.0)
799

muscle groups most likely to develop compensatory
patterns (Gulde & Hermsdorfer, 2017; Santos, P. et
al., 2022a). Prevention of compensatory movement is
one of the best practices, which includes early
detection and retraining of appropriate movements.
For prescribe restorative interventions, it is essential
to understand movement patterns and underlying
motor strategies (Valevicius et al., 2019).
1.1 Analysis of the Upper Limb
Movement Pattern Based on the
Phases of ADLs
Dividing complex motor tasks in different phases to
better analyse and characterize the movements, began
to be utilized in gait analysis studies. These studies
aimed to characterize the gait cycle pattern in
diversified groups through the analysis of kinematic
and biosignal parameters (Buddhadev et al., 2020).
In this analysis, a full gait cycle is normalized to
100%, with each phase of the cycle given a
corresponding percentage. The variables of each
phase are then analysed (Ewins & Collins, 2014).
Subsequently, the movement pattern of the upper
limb was also subjected to this type of analysis.
In studies of upper limb movement patterns,
various phases of ADLs were analysed. However, the
majority analysed, for example, the activity of
drinking from a cup, by variables such as the range of
motion in upper limb joints (Molina Rueda, 2012;
Santos, G. et al., 2018; Stanfield et al., 2018), the
duration of each phase (Stanfield et al., 2018), and the
execution speed (Alt Murphy et al., 2018).
Although less common, some studies have
examined the amplitude of muscle activation through
electromyography (EMG) in various phases of the
drinking activity (Molina Rueda et al., 2012, Santos,
P. et al., 2022a, 2022b), filling a glass (Ricci et al.,
2015), washing the contralateral limb, brushing hair,
eating soup, and brushing teeth (Santos, P. et al.,
2022a, 2022b). While some studies analyse phases of
ADLs, few characterize the pattern of muscle
activation through EMG and ACC, with
normalization of the movement cycle.
1.2 Characterization of the Movement
Pattern in ADLs Using EMG and
ACC
There is a gap in the characterization of the muscle
activation pattern in healthy subjects. Without this
information, it is not possible to identify
compensatory movements in individuals with
neurological pathology. Few studies have focused on
healthy subjects and the activation pattern of shoulder
muscles: Pectoralis Major (PM), Anterior Deltoid
(AD), Middle Deltoid (MD), Posterior Deltoid (PD),
Upper Trapezius (UT), and Lower Trapezius (LT).
These muscles are responsible for flexion (F),
extension (E), abduction (ABD), adduction (AD),
scapular elevation (SE), and scapular depression
(SD), respectively (Esperança Pina, 2017).
Firstly, Molina Rueda et al. (2012), found that in
the five phases of the activity of drinking from a cup,
the UT was activated in phases 3 (raising the cup to
the lips) and 4 (returning the cup to the table); the AD
in phase 1 (start the capture by moving the hand to the
cup) and phase 2 (grab the cup); the MD in phase 3
(raising the glass to the lips) and 4 (returning the glass
to the table); and the PD in phase 5 (release the cup
and the hand returns to the original position). Thus,
the UT, AD, and MD are activated in the first three
phases, corresponding to the range of movement from
the initial position until the cup reaches the mouth. In
the opposite movement, i.e., phases 4 and 5, there is
activation of the UT and DP.
Ricci et al. (2015) observed that during the
performance of ADL, specifically pouring water from
a jug into a glass, there is distinct activation of the
MD in the reaching phase, UT and MD in the
transport phase, and AD and MD in the release phase.
It is noteworthy that this activity deviates from others
due to the absence of a movement directed to the face.
In our team's recent investigations (Santos, P. et
al., 2022b), we identified that the muscles exhibiting
the highest activation during the contraction phase
(muscle activation increase) in the context of washing
the contralateral arm are the AD, UT, and PM.
Furthermore, Santos, P. et al. (2022a) conducted a
comprehensive analysis of the expected movements
and corresponding amplitude of activation during the
activity of washing the contralateral arm. The phases
include grasping (involving ADD), transporting to
the contralateral side (involving ADD, F, and SE),
and reaching the contralateral side (involving ADD,
F, and SE) as outlined in Table 1. These findings were
validated through EMG, where ADD was executed in
accordance with the anticipated patterns.
Regarding studies that analyse the linear
acceleration of the shoulder (in the x, y, z axes) and
relate these data to the phases of the activity, no study
has been found. Most studies use Inertia Movement
Units (IMU) or optoelectronic motion capture
systems to analyse the joint range of motion.
The aim of this study is to analyse and explore the
characteristics of the movement pattern during the
washing of the contralateral arm, specifically the
electrical activation amplitude the main shoulder
BIOSIGNALS 2024 - 17th International Conference on Bio-inspired Systems and Signal Processing
800

muscles, as well as the linear acceleration of the arm
in healthy individuals.
This activity is among the most disabling ADLs,
a consequence of the neurological pathology
sequelae, specifically hemiparesis. In these instances,
individuals face challenges in adequately performing
hygiene on the unaffected limb. Therefore, delving
into the study of this ADL holds particular
significance within a clinical context.
2 MATERIAL AND METHODS
This study was approved by the Ethics Council of
NOVA School of Science and Technology, located in
Almada, Portugal, and it was executed in the Physics
Department. Volunteers signed an informed consent.
2.1 Study Participants
The protocol was applied to 39 individuals, but 3
were excluded due to Bluetooth connection issues
between the Biosignalsplux® and the computer,
leading to failures in signal acquisition. The sample
was composed by 36 individuals (19 females and 16
males; 33 right-handed and 3 left-handed; age 28.8 ±
12.5 years; height 168.8 ± 7.1 cm). Exclusion criteria
included diagnosis of neuromotor, musculoskeletal,
cognitive or language injuries and changes in visual
acuity not compensated by glasses or contact lenses.
To each subject was attributed a code number, to
guarantee anonymity (Alt Murphy et al., 2006).
2.2 Experimental Setup and Protocol
The movement phases were stablished through two
cameras, placed at one meter away from the subject,
one in the coronal and other in the sagittal anatomical
plan, with a resolution of 30 frames per second.
EMG and ACC data was acquired through the
Biosignalsplux®. This equipment was wirelessly
connected to OpenSignals (r)evolution Software®
version 2.2.1, software used to obtain and display the
respective signals, and is specific to PLUX’s
®
biological signal collection hardware platforms (PluX
Wireless Biosignals, 2017). The acquisition
frequency is 1000 Hz. This set includes 8 sensor
inputs, 6 EMG electrode cables, an ACC with sensor
in the 3 coordinate axes and its tape. Due to
equipment limitations, it was decided to use only 2
axes, as the equipment has 8 cable connections, and 6
of them were being used in EMG.
The EMG sensors were placed using the bipolar
method, defined by SENIAM, from the center of each
electrode, in the belly of the same muscle and parallel
to the fibers. The reference electrode was placed on
the olecranon bone (zone of low electrical activity)
(Freivalds, 2011; Stegeman & Hermens, 2007).
In summary, the procedures for carrying out this
study were described in Santos, P. (2022b). The
subjects began the activity with the feet on the floor,
knees and hips flexed at 90º, upper limbs are
supported on the thighs, shoulders in a neutral
position, elbows flexed at 45º, forearms and hands
rest on the thighs. Before data collection was given
the opportunity to perform the movement, so that
subjects feel comfortable with the execution of it.
Participants were instructed to perform 5 trials. The
activity phases of the ADL are resumed in Table 1.
Table 1: Activity phases of washing the contralateral limb.
Activity phases of washing the contralateral limb
1. Grasping
2. Transporting to
the contralateral side
3. Reaching the
contralateral side
4. Return to the thigh 5. Return to initial position
2.3 Data Analysis
2.3.1 Movement Phases
Matlab® was used to analyse .avi videos files frame
by frame, with a function to register the frame where
each phase initialized and ended in an Excel file
(Table 1). The time (s) was retrieved from the frames
and camera frequency and calculated the mean and
standard deviation (SDT) of the time of each phase.
2.3.2 Electromyography
To obtain the EMG data in milli-Volt (mV), the
transfer function was retrieved from the BioPluX
website (PluX Wireless Biosignals, 2017). To reach
the zero offset, the mean was subtracted from the
signal and the absolute value was taken. The moving
average was applied to smooth out the signal waves,
considering that there should be a commitment to
softening the signal and removing important
information (Stegeman & Hermens, 2007).
Neuromotor Pattern of the Upper Limb in Hygiene Activities Using Electromyography and Accelerometery Technology
801

2.3.3 Accelerometer
The same procedures were applied to ACC signals:
subtraction of mean and move average filter. The
ACC needed to be calibrated. That procedure was
effectuated in the beginning of the study, and the
transfer function was applied to the raw data (PluX
Wireless Biosignals, 2019). The ACC was placed in
the lateral region of the arm, vertically aligned with
the lateral epicondyle (Curti et al., 2008). The x-
vector corresponds to the coronal anatomical plane
and y-vector to the sagittal.
2.3.4 Normative Pattern of Movement
The normative pattern for EMG and ACC describes
the mean behavior of the all sample used in this study,
and respective correlation with the ADL phases.
The ADL phases were determined by analyzing
video frames from the frontal plane. For each subject's
5 activity cycles, frame numbers marking the start and
end of each phase were recorded. Mean and SDT
values for these frame numbers were calculated and
converted to seconds based on the camera's acquisition
frequency (30 frames/s). This frame analysis informed
the definition of phase beginnings, ends, and durations,
as well as the segmentation of the signal into 5 cycles
and corresponding intervals. Since the goal was to
obtain the normative pattern of EMG contraction in the
present sample, the average of the signals was retrieved
after resampling time and amplitude, so the dimensions
of time and amplitude were equated.
Given that the duration of execution varies among
subjects, and that would be not possible to do the
mean, it was necessary to apply the MATLAB signal
processing function resample to the signal. This was
done to adjust the time axis in all signals to 8000 ms,
as this represented the maximum duration of the ADL
to avoid undersampling.
For graphical visualization, it was established that
8 seconds represent 100% of the activity duration. In
the signal, it was observed that after the subject
placed their hand on their thigh, marking the end of
the activity in the video, the muscle did not
immediately relax. It maintained some level of
contraction beyond 100% until fully relaxing. Hence,
the decision to include the interval between cycles,
which was resampled to 2000 ms, corresponding to
25% of the total time. For Figures from 1 to 9, the
following Matlab code was used:
figure;
function[lineOut,fillOut]=
stdshade(amatrix,0.1,[0,0,0],1:size(amatrix,
2),5);
%
stdshade(amatrix,alpha,acolor,F,smth);
The function draws the mean EMG signal with the
respective STD (Mussal, S., 2023). Variables of code:
amatrix (matrix with all values); alpha (transparency
of the line from 0 to 1); acolor (color of the SDT
shade; F (x axis steps); smth (smoothing factor).
3 RESULTS
3.1 Phases
As observed in Table 2, on average, during the ADL,
phase 4 is the task that takes the longest to be
performed (56.2
±
9.1), followed by phase 2 (18.4
±
4.6), phase 5 (10.7
±
8.0), phase 3 (10.4
±
3.8) and
phase 1 (4.4
±
2.3). The estimate mean time, in
absolute value, can be consulted in Table 2.
Table 2: Mean time interval of each movement phase (%)
and phase duration (%) and respective SDT.
Phases
Interval of
mean time (%)
Mean duration
± SDT (%)
Mean duration
± SDT (s)
1
[0, 4.4]
4.4 ± 2.3
0.2 ±0.1
2
]4.4, 22.7]
18.4 ± 4.6
0.7 ±0.2
3
]22.7, 33.1]
10.4 ± 3.8
0.4 ±0.2
4
]33.1, 89.3]
56.2 ± 9.1
2.1 ±0.5
5
]89.3, 100.0]
10.7 ± 8.0
0.4 ±0.3
3.2 Electromyography
The figures from 1 to 6 represent the mean EMG and
SDT, for all six muscles, during the 5 phases of the
ADL. It is observed in the figures that the amplitude
is increasing during phases 1 to 3, and the maximum
amplitude is reached close to the beginning of the
movement of phase 4 (33.1 time (%)), returning to the
thigh, where we detect the first inflexion point.
Muscles reach their maximum peak at different times,
but with a difference not greater than 7.0%. In
ascending order, the MD reaches the maximum value
at 34.6%; AD 34.8%; PD 38.1%; PM takes 41.5%;
UT and LT 41.5% (Table 3).
During phase 4, represented in yellow, for all
muscles except the PM and AD, a second inflection
point is observed, which counteracts the trend of
decreasing amplitude. In the MD and PD muscles this
inflexion point occurs in the middle of phase 4; in the
UT and LT at the end of phase 4, being most
noticeable in the UT. The third inflection point, which
determines the decrease in amplitude until the end of
activity, occurs for the MD, PD and LT muscles in the
at
the end of phase 4 and on the UT at the beginning
BIOSIGNALS 2024 - 17th International Conference on Bio-inspired Systems and Signal Processing
802
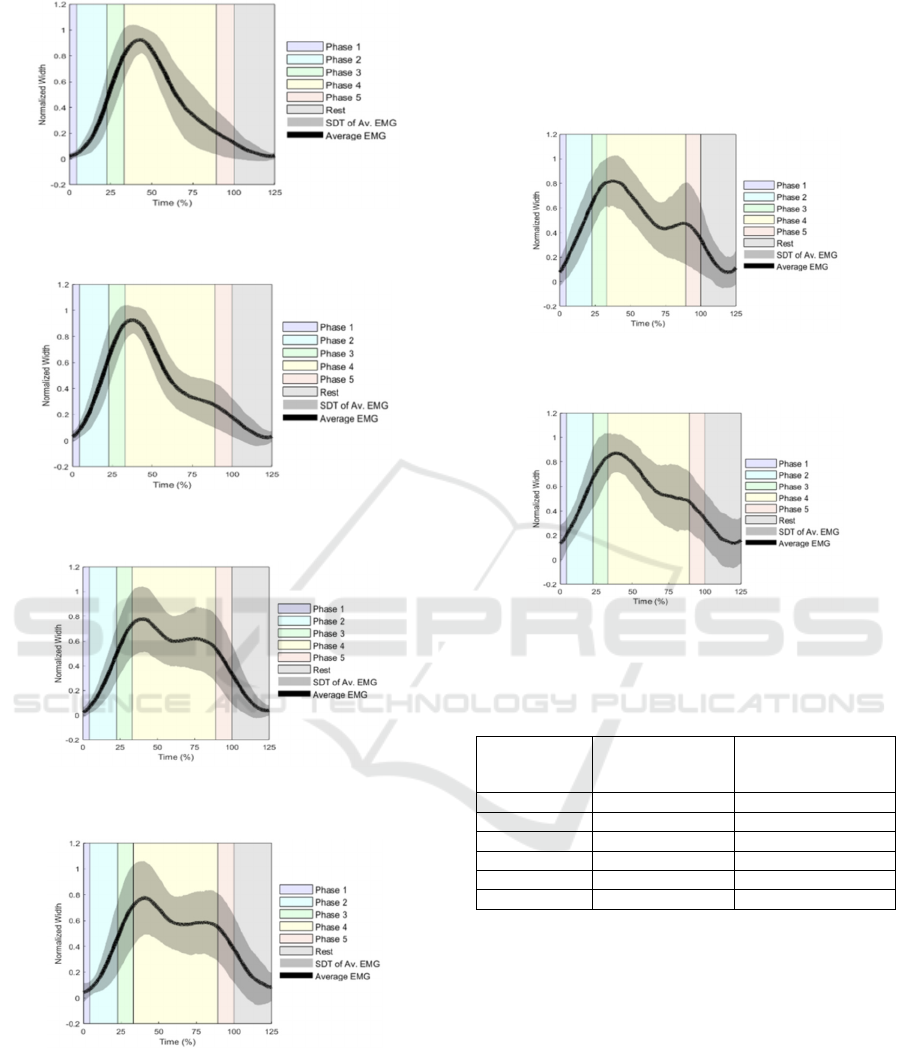
Figure 1: Mean EMG and SDT of the muscle PM and
respective movement phases.
Figure 2: Mean EMG and SDT of the muscle AD and
respective movement phases.
Figure 3: Mean EMG and SDT of the muscle MD and
respective movement phases.
Figure 4: Mean EMG and SDT of the muscle PD and
respective movement phases.
of phase 5. The mean amplitude of maximum peaks,
in absolute values (mV), report the three muscles with
higher amplitude contractions are AD, PM and UT.
These values can be consulted in Table 3. In
summary, the PM and AD muscles have, on average,
one inflection point during activity, and the remaining
four muscles three inflection points. The rest phase,
represented in gray, gives information of the
relaxation of the muscle, proving that minimum
amplitude occurs after the end of phase 5, when
subjects return to the initial position.
Figure 5: Mean EMG and SDT of the muscle UT and
respective movement phases.
Figure 6: Mean EMG and SDT of the muscle LT and
respective movement phases.
Table 3: Mean time (%) of maximum normalized peaks by
muscle.
Muscle Mean time of
amplitude peak
(%)
Mean amplitude
contraction peak
±
SDT (mV)
PM 41.5 0.07
±
0.06
AD 34.8 0.09
±
0.06
MD 34.6 0.04
±
0.02
PD 38.1 0.02
±
0.02
UT 41.5 0.06
±
0.04
LT 41.5 0.02
±
0.02
3.3 Accelerometer
The figures 7 to 9 represent the mean ACC and SDT,
for x, y and sum of x and y vectors, during the 5
phases of the ADL. It is possible to observe that the
behavior of the ACC, with the normalized g-unit
amplitude from 0 to 1, is identical for the two
anatomical planes represented in the linear
acceleration. The sum of the two linear acceleration
vectors is given by figure 9. The minimum
acceleration occurs at the beginning of phase 1 and at
rest. The maximum acceleration occurs in phase 4 at
53.0% for vectors x and y, and at 46.7% for the sum
vector (Table 4).
Neuromotor Pattern of the Upper Limb in Hygiene Activities Using Electromyography and Accelerometery Technology
803
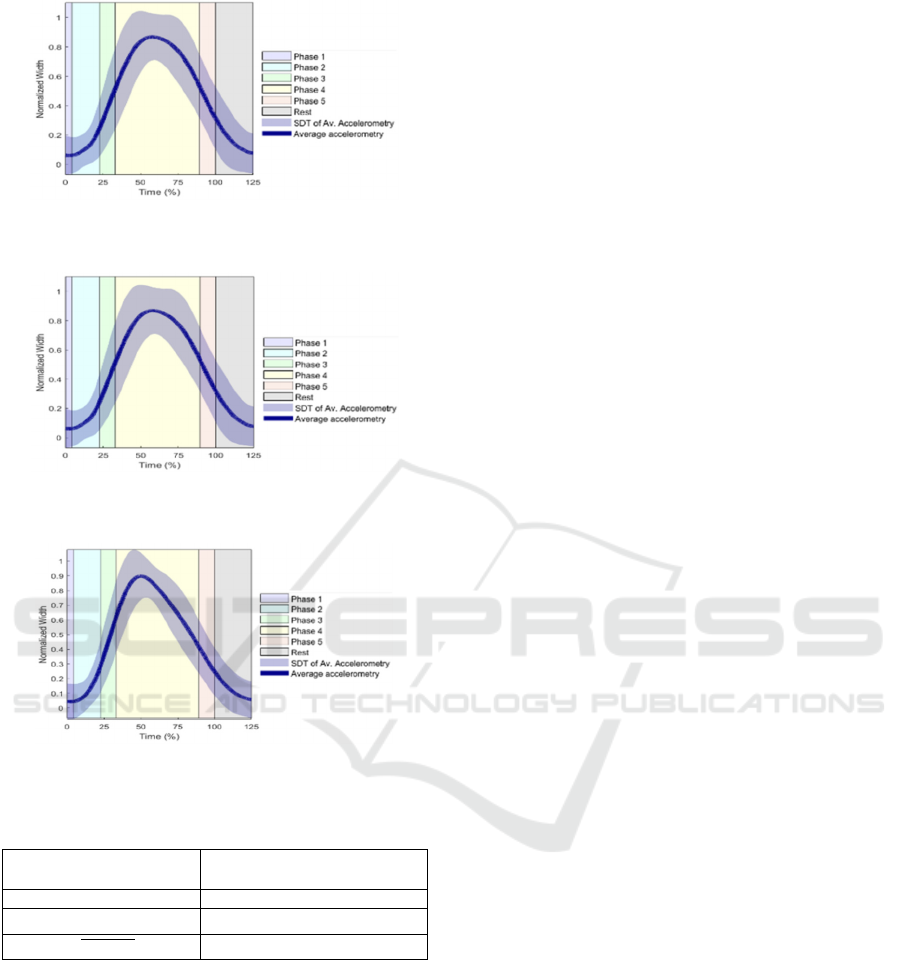
Figure 7: Coronal anatomical plan (vector x) linear
acceleration.
Figure 8: Sagittal anatomical plan (vector y) linear
acceleration.
Figure 9: Sum of the vectors x and y linear acceleration.
Table 4: Mean time (%) of maximum normalized peaks by
linear acceleration vector.
Vector
Mean time of
amplitude peak (%)
X 53.0
Y 53.0
𝑋
𝑌
46.7
4 DISCUSSION OF RESULTS
In EMG data results, two distinct phases (phase of
increased activation amplitude and a phase of
decreased amplitude) were observed in all muscle
groups. This pattern aligns with Molina Rueda et al.
(2012), Ricci et al. (2015), and Santos, P. et al.
(2022a, 2022b). While the studies by Molina Rueda
et al. (2012) and Ricci et al. (2015) focused on other
ADLs, these phases were a transversal characteristic.
The initial phase (increased amplitude)
corresponds to an isotonic concentric contraction.
There is a shortening of sarcomeres in the muscle
belly, leading to greater activation of muscle fibres
and includes the three initial phases (grasp, carry to the
contralateral side, and reach the contralateral side) and
the initiation of the phase 4 (return to the thigh) in all
muscles. This is supported by Table 2 and 3, where the
average peak amplitudes are in the percentage of mean
time amplitude peak corresponding to the beginning
of phase 4. These results align with Santos, P. et al.
(2022a), where, during washing the contralateral arm,
the three primary phases (grasp, transport to the
contralateral side, reaching the contralateral side)
corresponded to the phase of increased muscle
activation amplitude.
However, in the present study, by establishing the
beginning and end of each phase, demarcated in
Figures 1 to 6, we can analyse and confirm with more
precision that the phase of muscle activation of
increasing amplitude is associated at the beginning of
phase 4, which was not possible in previous studies.
Based on the results of the peak amplitude of
contraction in each muscle, we can see that the
muscles AD, PM, UT (Table 3) exhibits the highest
activation in motion from the thigh to the shoulder.
This is evident as these peaks occur until the beginning
of phase 4, which supports the motion
Figure 9: Sum of
the vectors x and y linear acceleration
analysis in Santos,
P. et al. (2022a), where the first movements are F,
ADD and SE, in which the AD, PM and UT muscles
are agonists (Esperança Pina, 2017).
Subsequently, the decrease in the amplitude, in
which there is an eccentric isotonic contraction, that
is, despite muscle activation, the amplitude decreases
as there is a progressive stretching of the sarcomeres.
According to Tables 2 and 3, this phase begins in
phase 4 (immediately after the maximum peaks of
activation of each muscle), continues until the final
phase (return to the initial position) and the rest phase.
However, in this decreasing phase, it is observed
(Figures 1 to 6) there are inflection points (MD, PD,
UT, and LT), with the most pronounced ones in MD,
PD and UT muscles between the second half of the
phase 4 and the beginning of phase 5. These results
supported by Santos, P. et al. (2022a), the inflection
peaks are aligned with those observed in the previous
study. According to the results, we can also infer that
this inflection peak in MD and PD occurs between the
last third of phase 4, that is, the phase in which contact
with the distal part of the contralateral limb is lost and
returns to the thigh requiring the activation of PD (E)
and MD (ABD) as seeing in Santos, P. et al. (2022a).
The inflection peak in UT can be justified by
motion analysis in the beginning of phase 5. To bring
BIOSIGNALS 2024 - 17th International Conference on Bio-inspired Systems and Signal Processing
804

the limb back to a position over the thigh, there must
be scapular elevation. The present study adds to the
comprehensive motion analysis of this activity in
phase 5 from our previous study P. et al. (2022a) by
incorporating the movement of SE.
Regarding the results with ACC, there is a peak, a
turning point, around the first half of phase 4. The
acceleration values increase in phases 1 and 2, with
increase observed in phase 3, reaching its maximum
peak at the beginning of phase 4. After this, a regular
decrease is noted until the end. This pattern is
observed both in the displacement of the arm along
the medio-lateral axis (x), the displacement of the arm
segment along the longitudinal axis (y), and in the
resultant vector of the sum of both.
Although in previous studies with EMG and ACC
in ADLs, age and sex were not considered into result
analysis, we believe these variables could impact the
outcomes. Nakatake, et al. (2023) noted that, in
drinking ADL, older individuals exhibited reduced
shoulder ABD amplitude, and females completed the
task more quickly. This prompts consideration for
exploring the influence of age and sex on muscle
activation amplitude patterns in future studies.
This study thus establishes a greater level of
precision in the analysis of the movement pattern in
the different phases of washing the contralateral limb.
5 CONCLUSIONS
This study unveils the normative movement pattern
of an ADL renowned for its challenge among
individuals with neuromotor diseases. The delineated
pattern, consisting of two distinct phases, culminates
in valuable insights into muscle activation dynamics.
Notably, the PM, AD, and UT emerge as key players
in the intricate sequence from thigh to shoulder, with
inflection points observed in the diminishing
amplitude phase, involving the MD, PD, and UT.
Conclusions drawn highlight the necessity for
future studies to validate and extend these results
across a wider age spectrum, particularly in contexts
where neurological conditions, like stroke, prevail.
Recommending the integration of EMG with gold
standard technologies, such as optoelectronic motion
capture systems, further emphasizes the commitment
to methodological precision. Despite equipment
constraints, these findings offer nuanced insights with
profound implications for clinical practice.
The comprehensive understanding of muscle
activation sequences, inflection points, and phase-
related nuances presented in this study has the
potential to revolutionize clinical interventions.
Tailoring rehabilitation programs to target specific
muscle groups can optimize motor function recovery,
profoundly impacting the quality of life and
independence of individuals. The acknowledgment of
limitations informs future research methodologies,
emphasizing a dedication to advancing clinical
assessment and treatment strategies.
ACKNOWLEDGEMENTS
This work was supported by national funds from FCT
– Foundation for Science and Technology, I.P.
through the UIDB/FIS/04559/2020 (LIBPhys-UNL).
REFERENCES
Alt Murphy, M., Sunnerhagen, K. S., Johnels, B., & Willén,
C. (2006). Three-dimensional kinematic motion analysis
of a daily activity drinking from a glass: a pilot study.
Journal of neuroengineering and rehabilitation, 3, 18.
https://doi.org/10.1186/1743-0003-3-18
Alt Murphy, M., Murphy, S., Persson, H. C., Bergström, U.
B., & Sunnerhagen, K. S. (2018). Kinematic Analysis
Using 3D Motion Capture of Drinking Task in People
With and Without Upper-extremity Impairments.
Journal of visualized experiments: JoVE, (133), 57228.
https://doi.org/10.3791/57228
Bleser, G., Steffen, D., Reiss, A., Weber, M., Hendeby, G.,
Fradet, L. (2015). Personalized Physical Activity
Monitoring Using Wearable Sensors. In: Holzinger, A.,
Röcker, C., Ziefle, M. (eds) Smart Health. Lecture Notes
in Computer Science(), vol 8700. Springer, Cham.
https://doi.org/10.1007/978-3-319-16226-3_5
Buddhadev, H. H., Smiley, A. L., & Martin, P. E. (2020).
Effects of age, speed, and step length on lower extremity
net joint moments and powers during walking. Human
movement science, 71, 102611.
https://doi.org/10.1016/j.humov.2020.102611
Cutti, A. G., Giovanardi, A., Rocchi, L., Davalli, A., &
Sacchetti, R. (2008). Ambulatory measurement of
shoulder and elbow kinematics through inertial and
magnetic sensors. Medical & biological engineering &
computing, 46(2), 169–178. https://doi.org/10.1007/
s11517-007-0296-5
de los Reyes-Guzmán, A., Gil-Agudo, A., Peñasco-Martín,
B., Solís-Mozos, M., del Ama-Espinosa, A., & Pérez-
Rizo, E. (2010). Kinematic analysis of the daily activity
of drinking from a glass in a population with cervical
spinal cord injury. Journal of neuroengineering and
rehabilitation, 7, 41. https://doi.org/10.1186/1743-0003-
7-41
Engdahl, S. M., & Gates, D. H. (2018). Reliability of upper
limb and trunk joint angles in healthy adults during
activities of daily living. Gait & posture, 60, 41–47.
https://doi.org/10.1016/j.gaitpost.2017.11.001
Neuromotor Pattern of the Upper Limb in Hygiene Activities Using Electromyography and Accelerometery Technology
805

Esperança Pina, J. E. (2017). Locomotion Anatomy (4th
ed.). Lisbon: Lidel.
Ewins, D., & Collins, T. (2014). Clinical Gait Analysis. In
A. Taktak, P. Ganney, D. Long, & P. White (Eds.), A
Handbook for Clinical and Biomedical Engineers (pp.
389-401). Academic Press.
Freivalds, A. (2011). Biomechanics of the upper limbs: me-
chanics, modeling and musculoskeletal injuries. CRC
press.
Gil-Agudo, A., de Los Reyes-Guzmán, A., Dimbwadyo-
Terrer, I., Peñasco-Martín, B., Bernal-Sahún, A., López-
Monteagudo, P., Del Ama-Espinosa, A., & Pons, J. L.
(2013). A novel motion tracking system for evaluation
of functional rehabilitation of the upper limbs. Neural
regeneration research, 8(19), 1773–1782.
https://doi.org/10.3969/j.issn.1673-5374.2013.19.005
Gulde, P., & Hermsdörfer, J. (2017). Both hands at work:
the effect of aging on upper-limb kinematics in a multi-
step activity of daily living. Experimental brain research,
235(5), 1337–1348. https://doi.org/10.1007 /s00221-
017-4897-4
Horak, F., King, L., & Mancini, M. (2015). Role of body-
worn movement monitor technology for balance and
gait rehabilitation. Physical therapy, 95(3), 461–470.
https://doi.org/10.2522/ptj.20140253
Jalloul, N., Poree, F., Viardot, G., L Hostis, P., Carrault, G.,
Jalloul, N., Poree, F., Viardot, G., L' Hostis, P., &
Carrault, G. (2018). Activity Recognition Using
Complex Network Analysis. IEEE journal of biomedical
and health informatics, 22(4), 989–1000.
https://doi.org/10.1109/JBHI.2017.2762404
Klein, A., Sacrey, L. A., Dunnett, S. B., Whishaw, I. Q., &
Nikkhah, G. (2011). Proximal movements compensate
for distal forelimb movement impairments in a reach-to-
eat task in Huntington's disease: new insights into motor
impairments in a real-world skill. Neurobiology of
disease, 41(2), 560–569.
https://doi.org/10.1016/j.nbd.2010.11.002
Levin, M. F., Kleim, J. A., & Wolf, S. L. (2009). What do
motor "recovery" and "compensation" mean in patients
following stroke?. Neurorehabilitation and neural repair,
23(4), 313–319.
https://doi.org/10.1177/1545968308328727
Molina Rueda, F., Rivas Montero, F. M., Pérez de Heredia
Torres, M., Alguacil Diego, I. M., Molero Sánchez, A.,
& Miangolarra Page, J. C. (2012). Análisis del
movimiento de la extremidad superior hemiparética en
pacientes con accidente cerebrovascular: estudio piloto.
Neurologia (Barcelona, Spain), 27(6), 343–347.
https://doi.org/10.1016/j.nrl.2011.12.012
Musall, Simon (2023). stdshade (https://www.mathworks.
com/matlabcentral/fileexchange/29534stdshade),
MATLAB Central File Exchange.
Nakatake, J., Arakawa, H., Tajima, T., Miyazaki, S., &
Chosa, E. (2023). Age- and sex-related differences in
upper-body joint and endpoint kinematics during a
drinking task in healthy adults. PeerJ, 11, e16571.
https://doi.org/10.7717/peerj.16571
Nakatake, J., Totoribe, K., Arakawa, H., & Chosa, E. (2021).
Exploring whole-body kinematics when eating real
foods with the dominant hand in healthy adults. PloS
one, 16(10), e0259184. https://doi.org/10.1371/
journal.pone.0259184
Nakayama, H., Jørgensen, H. S., Raaschou, H. O., & Olsen,
T. S. (1994). Compensation in recovery of upper
extremity function after stroke: the Copenhagen Stroke
Study. Archives of physical medicine and rehabilitation,
75(8), 852–857. https://doi.org/10.101 6/0003-
9993(94)90108-2
Özdemir, A.T.; Barshan, B. Detecting Falls with Wearable
Sensors Using Machine Learning Techniques. Sensors
2014, 14, 10691-10708. https://doi.org/10.3390/s14061
0691
Plux Wireless Biosignals (2019). Accelerometer ACC User
Manual (Plux). http:// www.plux.info
Plux Wireless Biosignals (2017). Electromyography EMG
User Manual (Plux). http:// www.plux.info
Ricci, F. P., Santiago, P. R., Zampar, A. C., Pinola, L. N., &
Fonseca, M.deC. (2015). Upper extremity coordination
strategies depending on task demand during a basic daily
activity. Gait & posture, 42(4), 472-
478.https://doi.org/10.1016/j.gaitpost.2015.07.061
Santos, G. L., Russo, T. L., Nieuwenhuys, A., Monari, D.,
& Desloovere, K. (2018). Kinematic Analysis of a
Drinking Task in Chronic Hemiparetic Patients Using
Features Analysis and Statistical Parametric Mapping.
Archives of physical medicine and rehabilitation, 99(3),
501–511.e4. https://doi.org/10.1016/j.apmr.2017.08.4
79
Santos, P., Quaresma, C., Garcia, I., Quintão, C. (2022a,
July). Neuromotor Evaluation of the Upper Limb
During Activities of Daily Living: A Pilot Study. In:
Camarinha-Matos, L.M. (eds) Technological Innovation
for Digitalization and Virtualization. DoCEIS 2022.
IFIP Advances in Information and Communication
Technology, vol 649. Springer, Cham.
https://doi.org/10.1007/978-3-031-07520-9_11
Santos, P., Garcia, I., Quaresma, C., & Quintão, C. (2022b,
October). Analysis of Upper Limb Contraction Pattern
Using Electromyographic Signal During Activities of
Daily Living: a Pilot Study. In HEALTHINFO 2022
Editors (Eds.), The Seventh International Conference on
Informatics and Assistive Technologies for Health-
Care, Medical Support and Wellbeing.
https://www.thinkmind.org/download_full.php?instanc
e=HEALTHINFO+2022
Stansfield, B., Rooney, S., Brown, L., Kay, M., Spoettl, L.,
& Shanmugam, S. (2018). Distal upper limb kinematics
during functional everyday tasks. Gait & posture, 61,
135-140.https://doi.org/10.1016/j.gaitpost.2018.01.004
Stegeman, D., & Hermens, H. (2007). Standards for surface
electromyography: The European project Surface EMG
for non-invasive assessment of muscles (SENIAM).
Roessingh Research and Development, 10, 8-12.
https://www.researchgate.net/publication/228486725
Valevicius, A. M., Boser, Q. A., Lavoie, E. B., Chapman, C.
S., Pilarski, P. M., Hebert, J. S., & Vette, A. H. (2019).
Characterization of normative angular joint kinematics
during two functional upper limb tasks. Gait & posture,
69, 176–186. https://doi.org/10.1016/
j.gaitpost.2019.01.037
BIOSIGNALS 2024 - 17th International Conference on Bio-inspired Systems and Signal Processing
806
