
Reliability and Stability of Mean Opinion Score for Image Aesthetic
Quality Assessment Obtained Through Crowdsourcing
Egor Ershov
1
, Artyom Panshin
1
, Ivan Ermakov
1
, Nikola Bani
´
c
2
, Alex Savchik
3
and Simone Bianco
4
1
Institute for Information Transmission Problems, Russian Academy of Sciences, 119991 Moscow, Russia
2
Gideon Brothers, 10000 Zagreb, Croatia
3
ACMetric, Netherlands
4
University of Milano-Bicocca, 20126 Milan, Italy
Keywords:
Image Quality, Pairwise Comparison, Statistics, Stability, Aesthetics, Computational Aesthetics,
Crowdsourcing.
Abstract:
Image quality assessment (IQA) is widely used to evaluate the results of image processing methods. While
in recent years the development of objective IQA metrics has seen much progress, there are still many tasks
where subjective IQA is significantly more preferred. Using subjective IQA has become even more attractive
ever since crowdsourcing platforms such as Amazon Mechanical Turk and Toloka have become available.
However, for some specific image processing tasks, there are still some questions related to subjective IQA
that have not been solved in a satisfactory way. An example of such a task is the evaluation of image rendering
styles where, unlike in the case of distortions, none of the evaluated styles is to be objectively regarded as a
priori better or worse. The questions that have not been properly answered up until now are whether the scores
for such a task obtained through crowdsourced subjective IQA are reliable and whether they remain stable, i.e.,
similar if the evaluation is repeated over time. To answer these questions, in this paper first several images and
styles are selected and defined, they are then evaluated by using crowdsourced subjective IQA on the Toloka
platform, and the obtained scores are numerically analyzed. Experimental results confirm the reliability and
stability of the crowdsourced subjective IQA for the problem in question. The experimental data is available
at https://zenodo.org/records/10458531.
1 INTRODUCTION
Subjective image quality assessment (IQA) has long
been used for various image processing tasks where it
is relatively hard to objectively measure which of the
obtained results is of a higher quality (Mohammadi
et al., 2014; Bani
´
c and Lon
ˇ
cari
´
c, 2016).
Earlier, subjective IQA was usually performed by
assigning tasks to evaluators in a laboratory or a sim-
ilarly controlled environment, but with the rise of
Internet services such as Amazon Mechanical Turk,
subjective IQA has started being ever more crowd-
sourced due to increased simplicity and lower costs.
Crowdsourced subjective IQA significantly increases
flexibility, but it suffers from problems such as eval-
uators with poor task understanding, dubious confi-
dence of the obtained results, possibility of cheat-
ing, etc. Many of these problems have already been
addressed (Joglekar et al., 2013; Hosu et al., 2018)
and it has been shown that under certain conditions
crowdsourcing subjective IQA can generate reliable
results (Siahaan et al., 2016). Nevertheless, since the
Launch #2
Launch #1
Launch #2
Launch #1
1 2
3
4
5
1 2
3
4
5
1 2
3
4
5
1 2
3
4
5
Figure 1: The results of two independent crowdsourcing
launches provide similar scores for 5 images styles whereby
the second launch was without any filtering. It can be seen
how styles scoring also depends on the image content.
experimental conditions and the experimental setup
can vary significantly depending on the specific image
processing task, numerous questions still remain open
and require a verification of whether crowdsourcing is
useful for a given task.
One such crowdsourcing task that has not been
sufficiently researched is forced-choice pairwise im-
Ershov, E., Panshin, A., Ermakov, I., Bani
´
c, N., Savchik, A. and Bianco, S.
Reliability and Stability of Mean Opinion Score for Image Aesthetic Quality Assessment Obtained Through Crowdsourcing.
DOI: 10.5220/0012462000003660
Paper published under CC license (CC BY-NC-ND 4.0)
In Proceedings of the 19th International Joint Conference on Computer Vision, Imaging and Computer Graphics Theory and Applications (VISIGRAPP 2024) - Volume 4: VISAPP, pages
365-372
ISBN: 978-989-758-679-8; ISSN: 2184-4321
Proceedings Copyright © 2024 by SCITEPRESS – Science and Technology Publications, Lda.
365

age aesthetic quality assessment where the human
aesthetic preference of certain image styles is being
assessed. These styles are not the same as image
distortions which are the topic of the majority of pa-
pers on subjective image aesthetic quality assessment.
This is because distortions are objectively known to
be undesirable in practically all cases, while for im-
age styles it is often hard to give an objective evalua-
tion. Additionally, human aesthetic preferences are
known to change over the course of time (Pugach
et al., 2017), which also makes the problem more
challenging, unlike when only distortions are used.
One notable example of such a problem that is
present both in the academy and in the industry is
night photography rendering (Ershov et al., 2022;
Shutova et al., 2023). Namely, there are numerous
ways of how strictly to apply color constancy, how
strong should tonemapping be performed, to what de-
gree should contrast and saturation be adjusted, what
other forms of enhancement should be introduced to
improve the impression, etc. Such and similar topics
have not been sufficiently addressed in a proper way.
Because of that, some important questions related
to subjective image quality assessment still remain
open and the goal of this paper is to try to answer
some of them. The first question is whether the re-
sults obtained by means of crowdsourced subjective
image aesthetic quality assessment where the goal is
to assess different styles are reliable, i.e., whether
the scores margin can be sufficiently high enough to
confidently determine the winning style. The second
question is whether the obtained results remain sta-
ble over a given reasonably small amount of time or
whether they are subject to change as could maybe be
expected (Pugach et al., 2017).
In this paper, a set of experiments to answer these
questions in at least some of the conditions are de-
scribed. The answers to both questions are positive
and the experimental data used to come to this con-
clusion is made publicly available. These results are
based on forced-choice pairwise comparisons, which
are often preferred for collecting reliable subjective
evaluations despite the fact that a large number of
evaluations is required (Ma et al., 2016). The main
reason is the fact that ”forced-choice pairwise com-
parison method results in the smallest measurement
variance and thus produces the most accurate re-
sults” (Mantiuk et al., 2012). Therefore, it should be
used if possible, and it was possible to use it here.
The paper is structured as follows: in Section 2
the related work is described, Section 3 describes the
used setup, the experimental results are described in
Section 4, and Section 5 concludes the paper.
2 RELATED WORK
Objective IQA is an old problem (Wang et al., 2002)
that has not been fully solved despite numerous at-
tempts (Zaric et al., 2010; Bianco et al., 2018; Zhai
and Min, 2020) and this consequently also holds for
image aesthetic assessment (Deng et al., 2017) where
various objective metrics have been designed. One of
the use cases for these metrics is to numerically as-
sess the aesthetic of a single image and this is where
metrics such as NIMA (Talebi and Milanfar, 2018),
DeepFL-IQA (Lin et al., 2020), and other similar
ones (Ma et al., 2017; Madhusudana et al., 2022)
come into play. Another use case is pairwise image
aesthetic assessment to determine which of the two
given images of the same scene, but with different
rendering properties, has higher aesthetic quality. Nu-
merous objective metrics have also been proposed for
that problem and many others are somewhat based on
it (Ko et al., 2018; Pfister et al., 2021).
Figure 2: An image from the KADID-10k (Lin et al., 2019)
dataset and one of its distorted versions; it can objectively
be said that the distorted, i.e., blurred image is less pleasing.
Nevertheless, all of these and similar metrics are
far from satisfactory for tasks such as, e.g., assess-
ing the methods for night image photography ren-
dering that has been mentioned earlier, but this also
holds for much simpler problems such as applying
various styles in applications like Photoshop. One of
the main reasons is that datasets that are used to train
such metrics and whose ground-truth consists of col-
lected subjective evaluations are mostly focused on
assessing images and their distorted version as shown
in Fig.2. Examples of these datasets are KADID-
10k (Lin et al., 2019), KonIQ-10k (Hosu et al., 2020),
and numerous others (Sheikh et al., 2006; Ying et al.,
2020). On the other hand, while there are datasets
such as the MIT-Adobe FiveK Dataset (Bychkovsky
et al., 2011) that have images with the same scene
rendered in different styles, the problem with them is
that these styles are not automatically reproducible on
a given image since they were originally obtained by
manual retouching. For a more detailed list of similar
datasets, interested readers are referred to the recent
review given in (Ruikar and Chaudhury, 2023).
VISAPP 2024 - 19th International Conference on Computer Vision Theory and Applications
366

Figure 3: Several images from the used dataset organized in categories and rendered in all of the used styles. The numbers
stand for the following: 1 – outdoor, 2 – indoor, 3 – food, 4 – face. Letters a, b, c, d, e stand for styles 1, 2, 3, 4, 5, respectively.
The closest to a dataset of images with automati-
cally reproducible styles that do not amount to mere
distortions, but to actually desired styles is probably
the RV-TMO dataset (Ak et al., 2022), which contains
tonemapped versions of high dynamic range (HDR)
images obtained by applying four different tonemap-
ping operators and the subjective evaluations of these
versions. Nevertheless, since the original images are
HDR images, and not low dynamic range (LDR) im-
ages that are used far more often and that cover much
more scenarios, this dataset does covers only a sub-
problem of an already highly specific problem.
To the best of our knowledge there is no dataset
with images rendered in different usable styles that
contains pairwise ground-truth quality comparisons.
As for using crowdsourcing platforms to perform
crowdsourced subjective IQA, numerous results have
been published (Ribeiro et al., 2011; Keimel et al.,
2012; Marcus et al., 2015). While they are use-
ful in some aspects such as assuring the quality of
crowd workers (Hosu et al., 2018), they were mostly
obtained for assessment of distorted images (Ghadi-
yaram and Bovik, 2015), which means that they
do not fully cover the targeted scenario of this pa-
per since some styles are not necessarily objectively
worse than others. Hence, the procedures described in
these publications may be used as a guideline. Thus,
it would be safer not to take the results from there for
granted, but to additionally verify them.
3 SETUP
To the best of our knowledge, no previous work de-
scribes or contains the data under the conditions suit-
able to answer the questions from the introduction.
Because of that, before conducting any experiments,
it was first required to generate the required data. The
idea here was to define several different styles and
then apply them to a number of selected images in
a way that is always repeatable on any given image.
These rendered image versions were then subjectively
assessed and the results were statistically analysed.
3.1 Used Images and Styles
The aim was to create five different versions of each
image, in such a way that each version would have
an identifiable look, by varying the four main com-
ponents of a photographic look: brightness, contrast,
saturation, and hue. For each version, i.e., style, we
aimed for a balance between a) being sufficiently dis-
tinctive to allow comparison and discrimination, and
b) being reasonable in that most people would accept
the style as a valid look even if not necessarily to the
observer’s own taste. Where possible, images con-
taining some neutral gray surfaces were selected, as
color differences would be more easily observable on
these (e.g., clouds, snow, stone, white plates). Unlike
in many previous publications, none of the image ver-
sions, i.e., styles used here consisted of distortions.
Images were chosen from several common and
popular photographic genres:
1. Daytime Landscapes in cloudy or softly sunlit
lighting conditions. The reason for this is that
softer lighting without hard shadows allows for
more visually acceptable variation in processing,
because direct sunlight a) creates color expecta-
tions (e.g., white, neutral light at midday or warm,
golden light in early morning and late afternoon),
Reliability and Stability of Mean Opinion Score for Image Aesthetic Quality Assessment Obtained Through Crowdsourcing
367

and b) the higher contrast limits the variation in
brightness in processing. One with snow, one with
distinct clouds, one with a strong color component
(gilded statues).
2. Multi-Illuminant Evening Urban Street Scene
containing both some light in the sky and artificial
building lighting.
3. Multi-Illuminant Interiors mixing diffused day-
light and artificial light, including practical lights
(i.e., light sources visible in the frame). One do-
mestic interior, one public.
4. Plated Food Close-Ups, photographed profes-
sionally to be appetising, on neutral white plates.
One red-meat dish with top-backlighting for at-
mosphere, one flatlay dish of vegetables including
mushrooms for their close-to-neutral color.
5. Portraits in Soft Daylight (AI-generated to
avoid privacy issues).
The role of memory (canonical) colors was antic-
ipated to vary between these genres. Skin tones and
food colors are both known to have strong expecta-
tions among most observers, while multi-illuminant
evening and night urban scenes contain few visual
clues for color accuracy or acceptability.
The starting point for processing the different ver-
sions was an image file already processed beforehand
to be averagely acceptable. This was then processed
in Adobe Camera Raw (ACR) for the following four
variations, i.e., styles described more in detail below:
• Style 0: Neutral Original. This is the originally
chosen image, processed to be averagely accept-
able as a sort of neutral style.
• Style 1: Higher Contrast, Lower Saturation.
This style is obtained by increasing the contrast
and lowering the saturation. In terms of ACR con-
trols, this style is generated by setting Contrast to
+40 and Saturation to -40.
• Style 2: Higher Contrast and Saturation. This
style is obtained by increasing the contrast, the
saturation, and the contribution of highlights. In
terms of ACR controls, this style is generated by
setting Contrast to +50, Highlights to +100, and
Saturation to +33.
• Style 3: An Overall Warmer Appearance
Equivalent to a Lower Color Temperature,
Darker. This style is obtained by increasing the
temperature, and decreasing the overall exposure
as well as the contribution of highlights and shad-
ows. In terms of ACR controls, this style is gen-
erated by setting Temperature to +30, Exposure to
-0.30, Highlights to -50, and Shadows to -50.
• Style 4: Cinematic Color Grading. This style
corresponds to applying a cinematic color grad-
ing, which affects the image by rendering blue
shadows and orange highlight. In terms of ACR
controls, this style is generated by setting Shad-
ows Hue to 230 and Saturation to 90, and High-
lights Hue to 50 and Saturation to 90, leaving the
Midtones untouched.
Some samples of the selected images organized in
categories are shown in Fig. 3 in all used styles.
Figure 4: An example of voting in “Toloka”.
3.2 Toloka
We propose pairwise comparison without a honeypot
as in (Mantiuk et al., 2012). We suppose that in sub-
jective studies excluding bias is sufficient. Hence, this
modification in setup was done for reasons of exclud-
ing bias that occurs when experts provide a reference
image that is assumed to be the most preferable.
Ten scenes featuring five distinct styles were up-
loaded to the crowdsourcing platform “Toloka.” Each
scene generates
5
2
= 10 combinations of style pairs,
resulting in a total of 10 × 10 = 100 pairs for style
comparisons. The Toloka web page displayed five
pairs or rendered images per page, and for each of
them the participants were prompted with the ques-
tion, “Which image is more preferable?”. Images
were displayed on 50% gray background (Mantiuk
et al., 2012) due to fact that color comparison should
be conducted on neutral background in order to ex-
clude bias. Moreover, we consider that the space be-
tween two images should not been filled with some
other information or controls in order to not distract
the participants. Additionally, images should have
some space between them in order to simplify the
comparison procedure. For each pair, there were three
options as shown in Fig. 4):
• Left image is more preferable,
• Right image is more preferable,
• and both left and right images are the same.
VISAPP 2024 - 19th International Conference on Computer Vision Theory and Applications
368

An additional pair with similar images is included on
each page to filter out unfair participants.
The experiment was conducted 6 times under dif-
ferent conditions, including weekends, strictly defin-
ing the participants geographic location (excluding
Russian respondents), runs without filtering, and three
indistinguishable runs. The experiments involved 411
participants in total. In instances where the partici-
pants denoted the images as similar, the vote was dis-
regarded. Furthermore, if a participant failed to pass
the “filtering” pair, the entire votes page was ignored.
“Weekend” runs were conducted due to assump-
tion that on weekdays it is usually pensioners who
are most active, and they are generally considered to
be responsible workers. Thus, a weekend run may
be expected to result in increased voting inaccuracy.
The “without filtering” run indicated that users did not
complete any test pairs during that particular setup.
4 EXPERIMENTAL RESULTS
In this section, first the models used to handle the data
and the assumptions required to do it efficiently are
explained. Next, the experimental data is processed
in accordance with the previously mentioned models.
Finally, a discussion is given that summarizes the con-
clusions about the reliability and stability based on the
presented analysis of the obtained experimental data.
4.1 Models and Assumptions
As we implement the pairwise approach for our ex-
periments, the raw data obtained for the pairwise
comparisons of the style renderings, i.e., versions of
a single image can be denoted as A
i jt
where i and
j denote the i-th and j-th image versions, i.e., style
renderings that were shown to the participants and t
enumerates the participants who evaluated the (i, j)
image pair. A
i jt
is equal to 1 if the t-th participant
evaluated the i-th image version to be better than the
j-th and 0 otherwise. Each image has its own A
i jt
.
Producing a style ranking based on A
i jt
is not
straightforward since it is noisy and difficult to inter-
pret. Thus, it is necessary to introduce a model for
the data. The three most prominent models for pair-
wise comparison data are Thurstone’s Model Case
V (Thurstone, 1927), Bradley-Terry model (Bradley
and Terry, 1952), and vote count (VC).
As Bradley-Terry is more preferred than Thur-
stone’s Model (Handley, 2001), we follow the
Bradley-Terry model with slight notation change.
Following Luce’s choice axiom (Luce, 2012), the
preference obtained for every pair of compared image
versions has an associated Bernoulli random variable
ˆp
i jt
, which provides samples A
i jt
. It is assumed that
we have T observers for each pair. The corresponding
parameters of the Bernoulli distributions are denoted
as p
i jt
. We impose even stronger assumption: the ob-
server dependence is neglected and we further assume
p
i jt
= p
i j
for every t. This assumption can be seen as
merely an encapsulation of observer-dependent distri-
bution P(i, j) =
∑
observer
P(i, j | observer)P(observer).
This representation of the Bradley-Terry model equals
the VC procedure.
4.2 Scores Estimation
The ultimate goal of the suggested framework is to es-
timate the scores obtained by the image versions in a
given set, so in this section we focus on the analysis of
the scores instead of individual pairwise comparisons.
This scores are later used to rank the styles.
As fitting Bradley-Terry model and VC estimation
using MLE results are similar, we use the latter pro-
cedure throughout our study as it is the simpler ap-
proach. So, to calculate the scores of styles, i.e., ver-
sions of a given image, for each of these versions we
average the votes in its favor:
S
i
=
1
T (n − 1)
∑
j̸=i
T
∑
t=1
A
i jt
. (1)
The corresponding random variable is
ˆ
S
i
=
1
T (n − 1)
∑
j̸=i
T
∑
t=1
ˆp
i jt
. (2)
The mean score that we strive to obtain is given by
S
i
= E
ˆ
S
i
=
1
n − 1
∑
j̸=i
p
i j
. (3)
The ground-truth values p
i j
are, of course, unknown
and they need to be derived from the data. Because of
that, we substitute them with their estimates
p
i j
=
1
T
T
∑
t=1
A
i jt
. (4)
Example of values p
i j
and scores calculated in
such a way for the image whose two versions are
shown in Fig. 6 are given in Table 2.
4.3 Running Under Various Conditions
A way of testing the Toloka reliability is to compare
the scores obtained by performing separate evaluation
experiments for each of the conditions mentioned in
Section 3.2 and then conducting a statistical homo-
geneity test. However, as there is a sample for each
Reliability and Stability of Mean Opinion Score for Image Aesthetic Quality Assessment Obtained Through Crowdsourcing
369
of the mentioned experiments, we followed a slightly
different procedure. For each experiment k ∈ [1 ... K],
where in our case K = 6, and for each pair (i, j), we
estimated p
(k)
i j
. Then, the values p
(0)
i j
were estimated
using the combined data from all the experiments. Fi-
nally, a test of goodness of fit was conducted. p-value
less than 0.05 rate is represented in Table 1.
However, as there are numerous pairs, we need
to combine the tests results. This is carried out us-
ing Benjamini-Hochberg procedure (Benjamini and
Hochberg, 1995). More specifically, given p-values
p
k
for each experiment, we sort them as p
(1)
< · ·· <
p
(k)
and find the largest p
(I)
such that p
(I)
≤ qI/k.
Then the hypotheses with p
i
≤ p
(I)
are rejected. The
parameter q, providing false discovery rate bound, is
chosen to be 0.05.
To sum up, pairwise comparison has low rejection
rate for the null hypothesis of difference between ex-
periments as shown in Table 1. Also we found out that
even without any filtering of voters we can get high
quality of markup. Moreover, Benjamini-Hochberg
procedure, which aim was to reduce false positive er-
rors, does not reject any hypothesis. This means that
the evaluation results are stable even under changing
conditions and even when run at different times.
Table 1: The rejection rate of the hypotheses for various
setups; the number of hypotheses was 50 for every setup.
Run setup Rejection rate
first run 0.03
second run 0.03
third run 0.01
region 0.04
reduced control 0.06
weekend 0.05
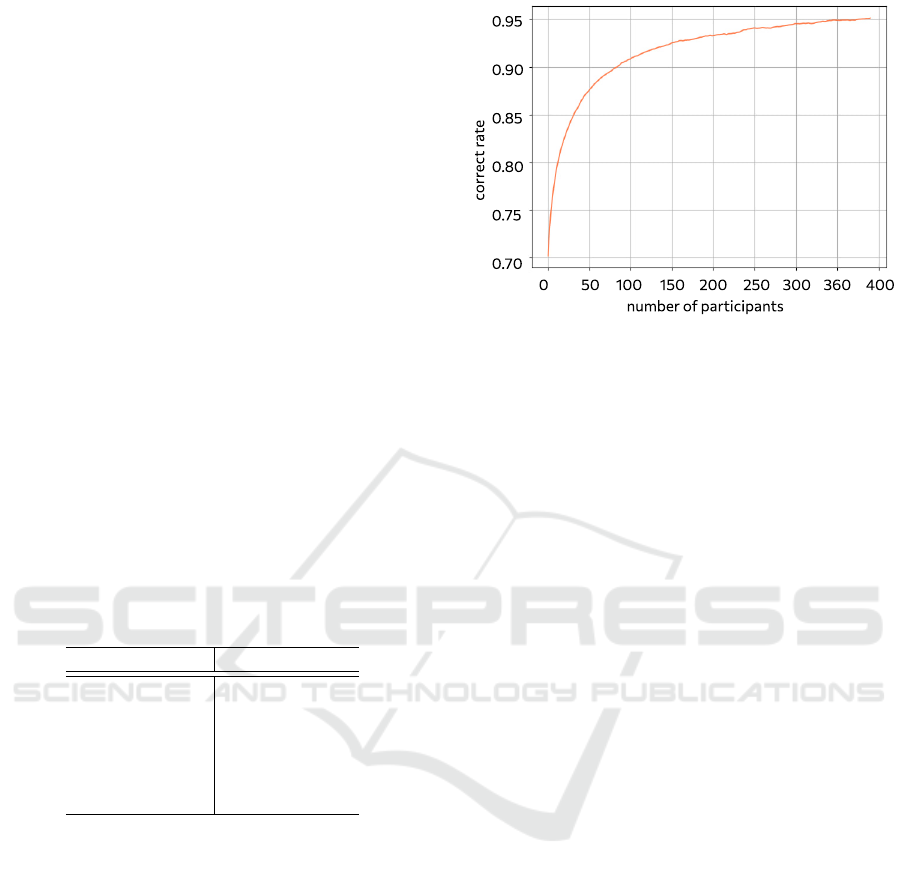
4.4 The Number of Participants
Moreover, the dependence of stability on the number
of participants per pair was also checked. All runs
were combined in one general data and this data was
extended via bootstrap. Then, every time the winner
for a pair as defined by the combined data was iden-
tified incorrectly by the bootstrapped data, we added
this bootstrap sample to the wrong class, otherwise it
was added to the correct class. The dependence of the
correct identification rate, i.e., the rate of adding to the
correct class on the number of participants is shown
in Fig. 5. It can be seen that it is possible to obtain
a satisfactory correct identification rate already with
a much smaller number of participants. This means
that the described crowdsourcing subjective IQA is
not significantly influenced by the number of partic-
ipants, i.e., it does not require a too big number of
Figure 5: The correct rate, i.e., the agreeing of the results
obtained by a given number of participants with the results
obtained by all participants that took part in the experiment;
the results of a given numbers of participants were simu-
lated by means of bootstrapping all the available data.
participants. Therefore, even the results obtained by a
smaller number of participants are reliable.
4.5 Ranking
In the context of pairwise style comparison data, lin-
ear ordering, i.e., ranking of styles may not be pos-
sible for certain images. An example would be three
styles of the same image, I
1
, I
2
, I
3
such that I
1
> I
2
≥
I
3
≥ I
1
, where I
i
> I
j
(or I
1
≥ I
2
respectively) denotes
being better in experiment, which means p
i j
> 0.5
(or p
i j
≥ 0.5 respectively). However, our comparison
data does not contain such conflicting triplets.
A straightforward method for achieving linear or-
der in such data would be to use style scores. Be-
cause of that, we checked the data for such pairwise
order violations, i.e., such styles I
1
, I
2
, that I
1
> I
2
,
but S
1
< S
2
. There is only one such pair, I
1
, I
2
among
all 100 pairs, see Fig. 6. The styles have p
12
= 0.57
and the scores with insignificant difference 0.636 and
0.644, respectively, as can be seen in Table 2.
Hence, we can conclude that in our data, the
scores are consistent with pairwise comparison, val-
idating their use for ordering styles. Because of that,
backed by these experimental results, we can claim
that forced-choice pairwise image aesthetic quality
assessment for the evaluation of the human aesthetic
preference of certain image styles is a valid and prac-
tical procedure since the final ranking only rarely con-
tradicts any individual pairwise results.
The full extent of the results can be seen in the
publicly available data that is available at https://
zenodo.org/records/10458531.
VISAPP 2024 - 19th International Conference on Computer Vision Theory and Applications
370

Figure 6: The style 2 of the image (left) has an insignifi-
cantly smaller score than the style 0 (right), yet the latter is
slightly preferred in pairwise comparison.
Table 2: Values p
i j
for different styles of the same images
sorted by score. Style 2 is slightly preferred in pairwise
comparison to style 0, while its score is slightly smaller.
i
j
0 2 3 1 4 Score
0 0.435 0.525 0.750 0.865 0.644
2 0.565 0.599 0.656 0.724 0.636
3 0.475 0.401 0.677 0.758 0.578
1 0.250 0.344 0.323 0.613 0.383
4 0.135 0.276 0.242 0.387 0.260
4.6 Discussion on Reliability and
Stability
As demonstrated in the previous subsections, statisti-
cal methods do not reveal any evidence that “Toloka”
is inappropriate for the task of crowdsourced subjec-
tive IQA. Namely, its performance and the quality of
results is significantly deteriorated neither by chang-
ing experimental conditions nor by the number of par-
Figure 7: Images with their scores from different experi-
ments. Numbers on bar charts stand for first three indistin-
guishable runs, reduced control, weekend, preferred loca-
tion, and combined experiments, respectively. Best viewed
in online version.
ticipants, and the final ranking was shown to be valid
in terms of practical results. Therefore, as already de-
scribed earlier in more specific details, the whole pro-
cedure can be considered reliable and stable.
5 CONCLUSION
In this paper, the goal was to examine in more de-
tail some of the important aspects of crowdsourced
subjective IQA when dealing with pairwise compar-
ison of images rendered in different styles that are
not a priori defined as objectively better of worse.
Test images have been chosen, they have been ren-
dered in several different styles, and then evaluated
by means of crowdsourcing through Toloka. After
numerically analyzing the obtained result, it has been
concluded that the described crowdsourced subjective
IQA for the problem in question is both reliable and
stable. Full experimental data and results are avail-
able at https://zenodo.org/records/10458531
1
.
REFERENCES
Ak, A., Goswami, A., Hauser, W., Le Callet, P., and Du-
faux, F. (2022). RV-TMO: Large-Scale Dataset for
Subjective Quality Assessment of Tone Mapped Im-
ages. IEEE Trans. on Multimedia.
Bani
´
c, N. and Lon
ˇ
cari
´
c, S. (2016). Sensitivity of
Tone Mapped Image Quality Metrics to Perceptually
Hardly Noticeable Differences. In Proc. of The Fifth
Croatian Computer Vision Workshop (CCVW 2013),
pages 15–18.
Benjamini, Y. and Hochberg, Y. (1995). Controlling the
false discovery rate: a practical and powerful ap-
proach to multiple testing. Journal of the Royal statis-
tical society: series B (Methodological), 57(1):289–
300.
Bianco, S., Celona, L., Napoletano, P., and Schettini, R.
(2018). On the use of deep learning for blind image
quality assessment. Signal, Image and Video Process-
ing, 12:355–362.
Bradley, R. A. and Terry, M. E. (1952). Rank analysis of in-
complete block designs: I. the method of paired com-
parisons. Biometrika, 39(3/4):324–345.
Bychkovsky, V., Paris, S., Chan, E., and Durand, F. (2011).
Learning photographic global tonal adjustment with a
database of input / output image pairs. In IEEE Conf.
on Cmput. Vis. and Pattern Recogn.
Deng, Y., Loy, C. C., and Tang, X. (2017). Image aesthetic
assessment: An experimental survey. IEEE Signal
Processing Magazine, 34(4):80–106.
1
Authors express gratitude for Toloka for supporting
crowdsourcing experiments.
Reliability and Stability of Mean Opinion Score for Image Aesthetic Quality Assessment Obtained Through Crowdsourcing
371

Ershov, E., Savchik, A., Shepelev, D., Bani
´
c, N., Brown,
M. S., Timofte, R., Ko
ˇ
s
ˇ
cevi
´
c, K., Freeman, M.,
Tesalin, V., Bocharov, D., et al. (2022). NTIRE 2022
Challenge on Night Photography Rendering. In Proc.
of the IEEE/CVF Conf. on Cmput. Vis. and Pattern
Recogn., pages 1287–1300.
Ghadiyaram, D. and Bovik, A. C. (2015). Massive On-
line Crowdsourced Study of Subjective and Objective
Picture Quality. IEEE Trans. on Image Processing,
25(1):372–387.
Handley, J. C. (2001). Comparative analysis of bradley-
terry and thurstone-mosteller paired comparison mod-
els for image quality assessment. In PICS, volume 1,
pages 108–112.
Hosu, V., Lin, H., and Saupe, D. (2018). Expertise screen-
ing in crowdsourcing image quality. In 2018 Tenth
international conference on quality of multimedia ex-
perience (QoMEX), pages 1–6. IEEE.
Hosu, V., Lin, H., Sziranyi, T., and Saupe, D. (2020).
Koniq-10k: An ecologically valid database for deep
learning of blind image quality assessment. IEEE
Trans. on Image Processing, 29:4041–4056.
Joglekar, M., Garcia-Molina, H., and Parameswaran, A.
(2013). Evaluating the Crowd with Confidence. In
Proc. of the 19th ACM SIGKDD intern. conf. on
Knowledge discovery and data mining, pages 686–
694.
Keimel, C., Habigt, J., Horch, C., and Diepold, K. (2012).
Qualitycrowd—a framework for crowd-based quality
evaluation. In 2012 Picture coding symposium, pages
245–248. IEEE.
Ko, K., Lee, J.-T., and Kim, C.-S. (2018). PCC-Net: Pair-
wise Aesthetic Comparison Network for Image Aes-
thetic Assessment. In 2018 25th IEEE International
Conf. on Image Processing (ICIP), pages 2491–2495.
IEEE.
Lin, H., Hosu, V., and Saupe, D. (2019). KADID-10k: A
Large-scale Artificially Distorted IQA Database. In
2019 Tenth International Conf. on Quality of Multi-
media Experience (QoMEX), pages 1–3. IEEE.
Lin, H., Hosu, V., and Saupe, D. (2020). DeepFL-IQA:
Weak Supervision for Deep IQA Feature Learning.
arXiv preprint arXiv:2001.08113.
Luce, R. D. (2012). Individual choice behavior: A theoret-
ical analysis. Courier Corporation.
Ma, K., Liu, W., Zhang, K., Duanmu, Z., Wang, Z., and
Zuo, W. (2017). End-to-End Blind Image Quality As-
sessment Using Deep Neural Networks. IEEE Trans.
on Image Processing, 27(3):1202–1213.
Ma, K., Wu, Q., Wang, Z., Duanmu, Z., Yong, H., Li, H.,
and Zhang, L. (2016). Group MAd Competition - A
New Methodology to Compare Objective Image Qual-
ity Models. In Proc. of the IEEE Conf. on Cmput. Vis.
and Pattern Recogn., pages 1664–1673.
Madhusudana, P. C., Birkbeck, N., Wang, Y., Adsumilli, B.,
and Bovik, A. C. (2022). Image Quality Assessment
Using Contrastive Learning. IEEE Trans. on Image
Processing, 31:4149–4161.
Mantiuk, R. K., Tomaszewska, A., and Mantiuk, R. (2012).
Comparison of Four Subjective Methods for Image
Quality Assessment. In Computer graphics forum,
volume 31, pages 2478–2491. Wiley Online Library.
Marcus, A., Parameswaran, A., et al. (2015). Crowdsourced
Data Management: Industry and Academic Perspec-
tives. Found. and Trends in Databases, 6(1-2):1–161.
Mohammadi, P., Ebrahimi-Moghadam, A., and Shirani, S.
(2014). Subjective and objective quality assessment
of image: A survey. arXiv preprint arXiv:1406.7799.
Pfister, J., Kobs, K., and Hotho, A. (2021). Self-Supervised
Multi-Task Pretraining Improves Image Aesthetic As-
sessment. In Proc. of the IEEE/CVF Conf. on Cmput.
Vis. and Pattern Recogn., pages 816–825.
Pugach, C., Leder, H., and Graham, D. J. (2017). How sta-
ble are human aesthetic preferences across the lifes-
pan? Frontiers in human neuroscience, 11:289.
Ribeiro, F., Flor
ˆ
encio, D., Zhang, C., and Seltzer, M.
(2011). Crowdmos: An approach for crowdsourcing
mean opinion score studies. In 2011 IEEE interna-
tional conference on acoustics, speech and signal pro-
cessing (ICASSP), pages 2416–2419. IEEE.
Ruikar, J. and Chaudhury, S. (2023). NITS-IQA Database:
A New Image Quality Assessment Database. Sensors,
23(4):2279.
Sheikh, H. R., Sabir, M. F., and Bovik, A. C. (2006). A
Statistical Evaluation of Recent Full Reference Image
Quality Assessment Algorithms. IEEE Trans. on im-
age processing, 15(11):3440–3451.
Shutova, A., Ershov, E., Perevozchikov, G., Ermakov, I.,
Bani
´
c, N., Timofte, R., Collins, R., Efimova, M.,
Terekhin, A., Zini, S., et al. (2023). NTIRE 2022
Challenge on Night Photography Rendering. In Proc.
of the IEEE/CVF Conf. on Cmput. Vis. and Pattern
Recogn., pages 1981–1992.
Siahaan, E., Hanjalic, A., and Redi, J. (2016). A Reli-
able Methodology to Collect Ground Truth Data of
Image Aesthetic Appeal. IEEE Trans. on Multimedia,
18(7):1338–1350.
Talebi, H. and Milanfar, P. (2018). NIMA: Neural Im-
age Assessment. IEEE Trans. on Image Processing,
27(8):3998–4011.
Thurstone, L. L. (1927). A law of comparative judgment.
Psychological review, 34(4):273.
Wang, Z., Bovik, A. C., and Lu, L. (2002). Why is image
quality assessment so difficult? In 2002 IEEE Inter-
national conference on acoustics, speech, and signal
processing, volume 4, pages IV–3313. IEEE.
Ying, Z., Niu, H., Gupta, P., Mahajan, D., Ghadiyaram,
D., and Bovik, A. (2020). From Patches to Pictures
(PaQ-2-PiQ): Mapping the Perceptual Space of Pic-
ture Quality. In Proc. of the IEEE/CVF Conf. on Cm-
put. Vis. and Pattern Recogn., pages 3575–3585.
Zaric, A., Loncaric, M., Tralic, D., Brzica, M., Dumic,
E., and Grgic, S. (2010). Image quality assessment-
comparison of objective measures with results of sub-
jective test. In Proc. ELMAR-2010, pages 113–118.
IEEE.
Zhai, G. and Min, X. (2020). Perceptual image quality as-
sessment: a survey. Science China Information Sci-
ences, 63:1–52.
VISAPP 2024 - 19th International Conference on Computer Vision Theory and Applications
372
