
Rule-Based Decision Making in Biologically Inspired Condition
Management System
Hariom Dhungana
Department of Mechanical and Marine Engineering,
Western Norway University of Applied Sciences, 5063 Bergen, Norway
Keywords: Condition Monitoring, Diagnostics, Prognostics, Biomimicry, Cognition, Decision Making.
Abstract: Biomimicry is an approach for solving industrial challenges by taking inspiration from bio-organisms’
responses. In an ongoing research project, investigations are being carried out to explore the use of biomimicry
approach for a human-centric condition management system. In this system the decision-making process is
divided into three types procedural decision-making, deliberative decision-making, and argumentative
decision-making. This paper intends to show the experimental verification of rule-based decision making (a
type of procedural decision making) in condition monitoring system using an example of rolling element
bearing. Rule-based decision-making involves using predefined guidelines to make choices, ensuring
structured, consistent, fair, efficient, and unbiased decisions. Vibration sensor data is used from PRONOSTIA
datasets to obtain four useful information’s and using those information’s in fuzzy rules to get decision. The
outcomes indicate the viability of the suggested framework for rule-based decision-making using real-time
vibration data.
1 INTRODUCTION
Biomimicry, the practice of drawing inspiration from
nature to solve human challenges, has found
relevance in the realm of decision-making (The
Biomimicry Institute — Nature-Inspired Innovation,
n.d.). The human brain plays a central role in the
process of decision making. It's a complex and
intricate organ that integrates various cognitive
processes and emotions to evaluate options, weigh
pros and cons, and arrive at a choice. Old brain and
new brain are familiar terms that refer to different
parts of the human brain that evolved at different
times in human evolution. The old brain is
responsible for basic survival functions, while the
new brain is responsible for more complex functions
such as reasoning, thinking, learning, and problem-
solving (Hawkins, 2021). Procedural decision
making involves an old brain while the thoughtful
decision making involves both old brain and new
brain. The old brain carries a cache of “best practices”
that is quick and simple.
Effective decision making in condition
monitoring system aims to reduce unplanned
downtime, extend equipment lifecycles, and optimize
maintenance efforts. Condition-based maintenance
emerged to minimize expenses associated with overly
frequent scheduled maintenance. Within an ongoing
research effort, a human-centred condition
management system framework has been proposed in
(Singh et al., 2024), drawing inspiration from human
cognition. Three decision making techniques named
procedural decision-making, deliberative decision-
making, and argumentative decision-making are
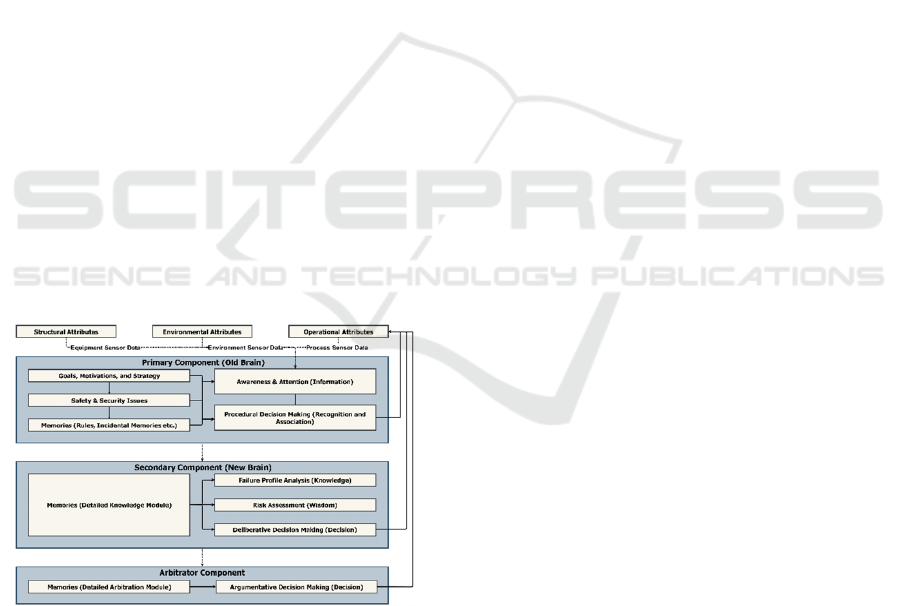
presented for equipment maintenance as in Figure 1.
Procedural decision making is the process of
making decisions based on a predetermined set of
rules, practices, or protocols. It can be modelled either
by rule-based approaches (Singh & Pokhrel, 2018) or
case-based approaches (Kolodner, 2014). It uses
sensory information integration and evaluation to
decide a course of action (Van Der Meer et al., 2012).
It is important for many everyday tasks, such as
recognizing faces, avoiding danger and so on. It
involves the brain's ability to process and interpret
sensory signal and to use that signal to make decision.
It might be useful in ensuring fair and consistent
decisions, but not guarantees to accommodate unique
or unexpected situations in decision-making like
something is better than nothing.
Deliberative decision-making involves a thorough
process where individuals thoughtfully analyse
Dhungana, H.
Rule-Based Decision Making in Biologically Inspired Condition Management System.
DOI: 10.5220/0012461100003636
Paper published under CC license (CC BY-NC-ND 4.0)
In Proceedings of the 16th International Conference on Agents and Artificial Intelligence (ICAART 2024) - Volume 3, pages 1245-1254
ISBN: 978-989-758-680-4; ISSN: 2184-433X
Proceedings Copyright © 2024 by SCITEPRESS – Science and Technology Publications, Lda.
1245
options, gather information, weight consequences,
and assess outcomes before making a choice. It
requires conscious thought, reasoning, and differs
from procedural decision-making that relies on swift,
automatic, and emotional reactions. In deliberative
process, the fault finding aims to uncover latent
failures, requiring thorough analysis for optimal
decision-making, reliability assessment, and
streamlined maintenance policy ideal (Junior et al.,
2022). An instance of deliberative decision-making,
involving reliability assessment and optimization of
maintenance policies for the yaw system on a wind
turbine, was showcased in (Catelani et al., 2020).
Balancing procedural and deliberative decision-
making are key for effective choices, harnessing
strengths from both approaches. Argumentative
decision-making involves evaluating options using
structured arguments and evidence, aiming to
enhance decisions by rational and well-justified
selection among alternatives. Arguments serve dual
roles: aiding alternative selection and justifying
adopted choices in both everyday decisions and
critical discussions (Amgoud & Prade, 2009).
Argumentation enhances AI explain ability by
revealing decision steps, offering reasoning amidst
uncertainty, and resolving conflicting information
(Vassiliades et al., 2021). The performance of
decision-making models has been improved by
combining the argumentation by providing human
supervision for image classification and large-scale
real-world semi-autonomous driving in (Fridman et
al., 2019).
Figure 1: Decision making framework proposed in
biologically inspired condition management system.
Immediate maintenance decision is carried by
procedural decision making from initial observation,
and deliberate or thoughtful maintenance decision is
done by using root cause finding, likelihood
estimation, continuous learning, and optimization of
available resources. The main objective of this work
is to show case study of rule-based decision making.
This paper thus investigates the usefulness of the
framework using in vibration signal in bearing. Some
preliminary case study of initial fault identification
was carried out in (Singh et al., n.d.). This work
shows the complete case of rule-based decision-
making using fuzzy rules.
A quick and efficient decision-making system
plays a vital role in enhancing maintenance task
especially for safety critical equipment’s. We argue
that the concept of rule-based decision making is at
the very basis of the quick decision making and that
using limited data through a well-established
technique both safety & security as well as goals and
motivation of low maintenance cost.
The rest of the paper is structured as follows:
Section 2 presents the methodology of rule-based
decision making, including fault detection,
identification, quantification, and RUL estimation
submodules. Section 3 provides the result of each
module to obtain corresponding information and how
fuzzy rules bind those information into decision and
Section 4 draws the concluded remarks.
2 METHODOLOGY
Integral to electromechanical systems, ball bearings
play a vital role, but their malfunctions can
dramatically impact the operational lifespan of
industrial processes. Through continuous monitoring
of bearing, potential faults are detected early, leading
to prompt rule-based decision. In systems demanding
high reliability and safety, timely maintenance
decisions are of paramount importance.
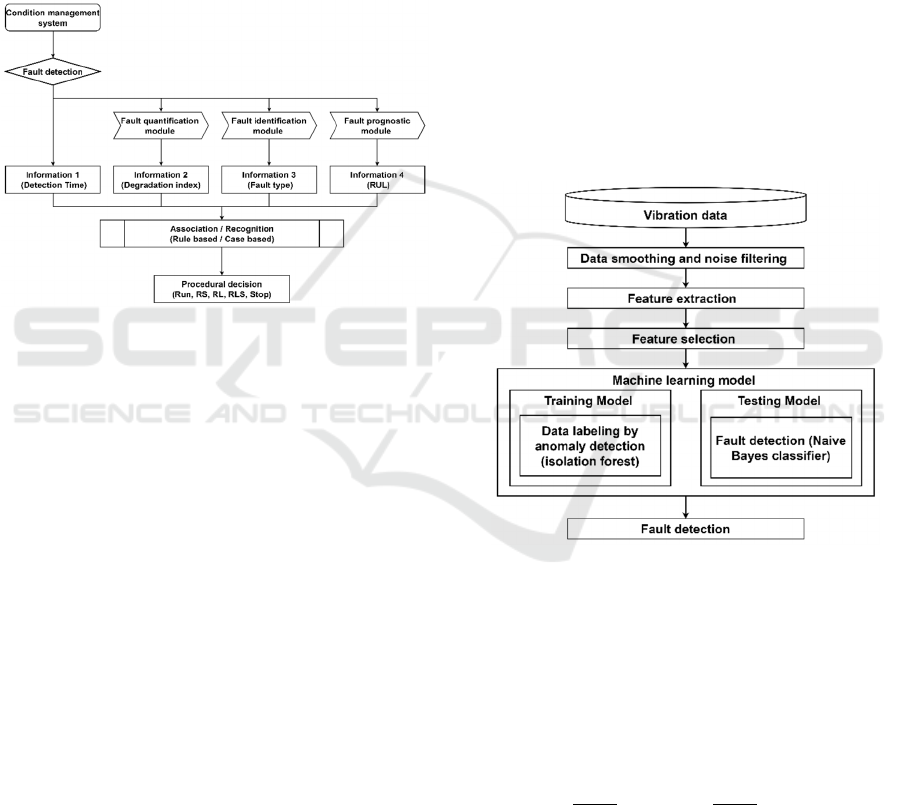
The functional flowchart of rule-based decision
making consists of five submodules named fault
detection, fault identification, fault quantification and
fault prognostic and use of fuzzy rule as shown in
Figure 2. These submodules are divided into
diagnostic and prognostic categories based on timing.
The diagnostic aspect includes fault detection,
identification, and quantification, while the
prognostic aspect estimates remaining useful life
(RUL). After fault detection, instantly the three other
fault analysis modules make some information’s. The
fault qualification module notes the degradation
index, the fault identification module tries to find out
which part of the bearing is showing fault traces and
the prognostic module roughly estimate the RUL.
After gathering the prerequisites information, the rule
module uses fuzzy logic to get decision.
Researchers lack a unanimous agreement on the
most suitable vibration-based fault detection, fault
ICAART 2024 - 16th International Conference on Agents and Artificial Intelligence
1246
identification, damage indicator and fault prognostic
method or parameter. While vibration feature-based
methods are simple and easily applicable, they are not
computationally intensive; Moreover, they provide
approximate quantitative damage assessment. We
utilize the Naive Bayes classifier for fault detection,
relying on time intervals between vibration envelope
peaks for fault identification. Additionally, the
capability index derived from the kernel density plot
of vibration data serves as a degradation indicator for
fault quantification. For fault prognostics, we employ
polynomial regression to predict RUL.
Figure 2: Functional flowchart of procedural decision
making in bearing after fault detection.
2.1 Fault Detection
Fault detection aims to spot deviations from normal
behavior that might result in errors, failures, or
malfunctions. It enables operators to identify
mechanical anomalies and determine the underlying
problem for subsequent targeted repairs. Common
bearing failure modes exhibit distinct characteristics,
necessitating varied identification strategies. Single
features are insufficient for precise fault detection,
prompting the use of machine learning-based fault
detection module for intelligent analysis. The fault
detection process steps are shown in Figure 3.
Noise is a natural part of vibration data, to
minimize effect of noise data we applied sliding
window with 5 points. After denoising, thirteen-time
domain features (Maximum, Minimum, Average
absolute value, Peak to peak, Variance, Standard
Deviation, Root mean square, Crest factor, Clearance
Factor, Impulse factor, Skewness, Kurtosis, and
Shape factor) are extracted from both accelerometer
data. Detailed definitions, physical meanings, and
statistical equations are described on (Wang et al.,
2019). Pearsons’s correlation coefficient is used to
select useful feature’s fault detection (Cai et al.,
2018). Maximum value, Variance, Skewness, and
Kurtosis features are picked as promising features for
fault representation.
Since the datasets contain the measurement until
the either of the accelerometer overpassed 20g, there
is no pre-defined label. We labelled the fault based on
anomalies. Anomalies, unique patterns with distinct
attributes from normal instances, hold significance
across domains, providing actionable insights. We
employ the Isolation Forest algorithm for anomaly
finding, leveraging its fast tree-based methodology
that assigns anomaly scores via binary search tree
paths (Liu et al., 2008). This algorithm
accommodates multiple features, enhancing labelling
accuracy, and draws insights from diverse monitoring
methods (Hayes & Capretz, 2014). Particularly
effective for high-dimensional problems with
irrelevant attributes or scarce anomalies, Isolation
Forest's computational efficiency suits streaming data
scenarios.
Figure 3: Flowchart of fault detection module.
After labelling, we used the Naive Bayes classifier
for fault detection, known for its efficacy in text
classification, medical diagnosis, predictive
maintenance, and fault detection (Rish, 2001). This
classifier simplifies learning by assuming feature
independence within classes. It employs Bayesian
theory, as shown in equation (1)
𝑃
𝐷
|
𝑥
=
𝑃
𝐷
𝑃
𝑥
𝑃
𝑥
|
𝐷
=
𝑃
𝐷
𝑃
𝑥
𝑃
𝑥
|
𝐷
(1)
2.2 Fault Identification
Fault identification is the process of specifically
pinpointing the component of location underlying
Rule-Based Decision Making in Biologically Inspired Condition Management System
1247

causes or mechanism of abnormal behavior in an
equipment. Bearing faults can be grouped into two
categories single-point defects and generalized
roughness. To vibration signature produced by
generalized roughness are vague, while the single-
point defects can be swiftly and easily identified from
the vibration signal envelope. Defects at different
components (outer race, inner race, ball, and cage)
creates different characteristic frequencies. These
defects typically produce periodic vibration signals
with repetitive patterns over time (Song et al., 2018).
This pattern facilitates frequency measurement,
contributing to the detection of periodicity or
regularity within the vibration signal. In this context,
'zero crossing time' is synonymous with the time
interval that highlights defects on bearing
components in time-domain vibration signatures
(William & Hoffman, 2011). The comprehensive
methodology for extracting vibration signatures from
time-domain vibration features is elaborated in our
earlier work (Singh et al., n.d.).
2.3 Fault Quantification
Fault Quantification finds the level of abnormality to
quantify the degree of degradation and fault (partial
or complete) (Kandukuri et al., 2016). As highlighted
before, fault quantification significantly influences
the informational value for rule-based decision-
making, and the choice of degradation indicator
features is context-specific, as no single feature
proves universally effective for all structures and
damage types. The selection of degradation indicators
(
𝐷
) involves a compromise between damage
sensitivity and alignment with anticipated structural
response. To address uncertain parameters, different
uncertainty quantification methods have emerged,
categorized into Probabilistic and Possibilistic
approaches. Probabilistic approaches treat model
input parameters as random variables with known
probability density functions (Kong et al., 2017).
Capability index have been used in the
manufacturing industry to provide quantitative
measures on process potential and performance,
moreover it can be used as damage index by fault.
Here we use kernel density function to measure the
uncertainty in the fault model, which is an extension
of the histogram. It is coined by statistician and is
expressed with different notion as process capability
index (Pearn & Chen, 1999), Six Sigma method
(Gupta et al., 2018; Kulkarni et al., 2023) Six sigma
method was developed to minimize process variance
and to improve the quality and performance of the
system. The process capability indices reflect the
degree of the process variation with respect to the
specific limits. As the degree of fault increases the
value of degradation index falls.
𝐷
=
𝑑−
|
𝜇−𝑀
|
3𝜎
=
𝑚𝑖𝑛
𝑈𝑆𝐿 − 𝜇,𝜇 − 𝐿𝑆𝐿
3𝜎
(2)
2.4 Fault Prognostics
Fault prognostics predicts future system behavior
using current condition and data history. Due to the
uncertainty and nonlinearity of the predictive models
when damage accumulates, an alternative goal is to
estimate the RUL that the system can perform in a
safe status under the future loading before one no
longer has confidence in the prognosis model. Here,
the fault prognosis module predicts the RUL of the
bearing from the time of anomaly detection timeline.
Regression is a powerful statistical method and
used widely for RUL prediction in prognosis (Kwon
et al., 2019). We've observed a non-linear relationship
between vibration feature (maximum vibration value)
and failure; therefore, we use polynomial regression.
It's important to note that the size and distribution of
the dataset used for model building impact the
regression performance of the prognostic module. We
use the 200 sample measurements for calculation of
polynomial coefficients. The mathematical
representation of our model follows equation (3),
where 'n' represents the polynomial degree and
𝑃
,
𝑃
.. 𝑃
are the coefficient of polynomial curve.
𝑃
𝑥
=𝑃
𝑥
+𝑃
𝑥
+⋯……+𝑃
𝑥
(3)
2.5 Fuzzy Rules
By drawing upon past experiences and knowledge,
individuals can make decisions based on the
recognition of relevant cues and the associated
outcomes associated with them. It relies on the
recognition of familiar patterns and the subsequent
application of established strategies that have proven
successful in similar contexts. The phenomenon of
decision making from the viewpoint of computer
science and information technology was presented in
(Marko Bohanec, 2009). To address uncertainty in
FMECA for CNC machine tools' manufacturing
stage, fuzzy mathematics and data envelopment
analysis are used to determine risk factors, assess
failure modes, and calculate a new RPN (Yu et al.,
2022).
Here we use Fuzzy rules to obtain decision from
the information obtained from diagnostic and
prognostic fault analysis submodules. Fuzzy rule
ICAART 2024 - 16th International Conference on Agents and Artificial Intelligence
1248

emulates human-like reasoning in handling
uncertainty and imprecision, making it ideal for
ambiguous scenarios. Fuzzy rules, structured as 'IF
Antecedent THEN Consequent,' work with linguistic
variables and smooth transitions via membership
functions. They enable flexible decision-making in
imprecise situations, bridging the gap between vague
input and actionable output. Fuzzy Rule-Based
Systems offer accountability when input data is
fuzzified (Trillo et al., 2020). These rules manage
uncertainty using degrees of truth, encoding expert
knowledge in a human-understandable format.
All input and output membership functions, fuzzy
rules and the lookup table are developed prior to the
implementation of the fuzzy logic technique to find
the rule-based decision, therefore it is less time
consuming.
In data science, defining membership functions in
fuzzy systems is crucial. Various methods exist to
describe membership functions, including horizontal,
vertical, pairwise-comparison, problem-specific,
fuzzy clustering, artificial neural networks, and
genetic algorithms (Klir & Yuan, 1995). In this
context, we opt for a simple and quick approach based
on the information range obtained from each module.
Decision variables include anomaly detection
time, damage index, and RUL. Detection time
impacts failure risk: early detection provides time to
avoid immediate failure. The damage index quantifies
fault severity inversely, with a higher index indicating
better performance. RUL guides decisions: a low
RUL suggests potential need for immediate action or
reduced operating attributes to prolong lifetime.
Decision is taken as output membership variables.
The American Roller Bearing Company's catalog,
drawing on a century of experience, provides domain
knowledge and expert opinions for defining input and
output variables as membership functions (American
Roller Bearing, n.d.). They emphasize the
temperature's influence on bearing life due to reduced
hardness at high temperatures, impacting static and
dynamic capacities. To compute actual bearing rating
life (L), one must account for speed, load, and
temperature, all inversely related to rating life (see
equation 4). where D is dynamic load rating, P is
applied load, e equals 10/3 for rolling element, R is
the rotation.
𝑅𝑎𝑡𝑖𝑛𝑔 𝑙𝑖𝑓𝑒
𝐿
=
𝐷
𝑃
∗ 10
60 ∗ 𝑅
∗𝑇𝑒𝑚𝑝
𝑓
𝑎𝑐𝑡𝑜𝑟
(4)
Bearings typically operate under varying loads
and speeds, defined by a duty cycle that specifies the
load, speed, and percentage of time. In these cases, a
full duty cycle occurs within one bearing revolution.
Equation 5 provides the formula for calculating the
rating life under such variable operating conditions.
where
𝑇
, 𝑇
, 𝑇
are percentage of time at different
conditions (𝑇
+ 𝑇
+ … 𝑇
= 1) and 𝐿
, 𝐿
, 𝐿
are
life in hours for each period of constant load and
speed.
𝑅𝑎𝑡𝑖𝑛𝑔 𝑙𝑖𝑓𝑒
𝐿
=
1
𝑇
𝐿
+
𝑇
𝐿
+⋯.. +
𝑇
𝐿
(5)
Our goal isn't to achieve the optimal decision;
instead, we aim to demonstrate experimental
validation of rule-based decision-making. Our criteria
for failure are subjective, prioritizing safe operation.
Drawing from equations 4 and 5, we consider five
procedural decision alternatives in this work based on
criticality. Load's greater quantitative impact than
speed determines their order: 'run as is' (decision
one), 'reduce speed' (decision two), 'reduce load'
(decision three), 'reduce load and speed' (decision
four), and 'stop' (decision five). These decisions
correspond to five classes: run, reduce speed (RS),
reduce load (RL), reduce load & speed (RLS), and
stop immediately. The details of membership
function, range of information variables, fuzzy sets,
and boundary of trapezoid is presented in Table 1.
Table 1: Membership functions and their boundary.
Membershi
p function
Rang
e
Fuzzy sets Trapezoid
Detection
Time
0-
25000
Early
Awhile
Late
[0,0,2000,5000]
[2000,5000,
10000, 15000]
[10000, 15000,
25000, 25000]
RUL 0-
25000
Short
Intermediat
e
Long
[0,0,2000,5000]
[2000,5000,
10000, 15000]
[10000, 15000,
25000, 25000]
Degradation
index
0 - 21 Low
Medium
High
[0,0,1, 3]
[1,3,5,10]
[5,7, 21, 21]
Decision 1 - 10 Run
RS
RL
RLS
Stop
[0,0,1, 2]
[1,2,3,4]
[3,4,6,7]
[6,7,8,9]
[8,9,10,10]
Detection time, RUL and degradation indices are
taken as Antecedent, and decision is taken as
Consequent. Using a 27 linguistic rule base, derived
from empirical knowledge, and illustrated in Figure
4, rules are determined for instance:
Rule-Based Decision Making in Biologically Inspired Condition Management System
1249
RULE 1: IF early detection time AND short RUL
AND low degradation index, THEN decision is
'Stop.'
RULE 27: IF late detection time AND long RUL
AND high degradation index, THEN decision is
'Reduce speed.'"
In defuzzification, we convert the output fuzzy set
into a single crisp value. In this model, we use the
Centre of Gravity (centroid) method to calculate this
crisp output value from the accumulated membership
functions. This work utilizes the scikit-fuzzy Python
package for fuzzy logic operations.
Figure 4: Decision matrices by considering detection time
and RUL at three different stages of degradation index. The
bottom right graph shows the membership function with
five possible categorical.
2.6 Data Sets
We evaluate the model using the PRONOSTIA
datasets provided by the FEMTOST Institute,
specifically designed for accelerated degradation
tests of bearings. Our focus is on vibration data due
to its valuable insights for condition management.
These datasets include readings from two
accelerometers, sampled every 10 seconds at a
frequency of 25.6 kHz. Seventeen experiments were
conducted under three different operating conditions,
as summarized in Table 2. Six experiments
(Bearing1_1, Bearing1_2, Bearing2_1, Bearing2_2,
Bearing3_1, Bearing3_2) are utilized for training,
while the remaining eleven experiments are used for
testing. We specifically employ the 'run to failure'
experiment from the training and test datasets for
verification purposes. Figure 5 illustrates the bearing
experimentation platform, and more detailed dataset
information can be found in (Nectoux et al., 2012).
These datasets are openly available to support
prognostics research for condition monitoring,
encompassing vibration signals collected throughout
the entire lifetime from accelerated degradation tests
of rolling element bearings.
Figure 5: Overview of the experimentation platform
(Nectoux et al., 2012).
Table 2: Operating conditions of various experiments.
Operating Conditions
Condition 1 Condition 2 Condition 3
Load
(Newton) /
Speed
(RPM)
4000 / 1800 4200 /1650 5000 / 1500
Training
sets
Bearing1_1
Bearing1_2
Bearing2_1
Bearing2_2
Bearing3_1
Bearing3_2
Testing sets
Bearing1_3
Bearing1_4
Bearing1_5
Bearing1_6
Bearing1_7
Bearing2_3
Bearing2_4
Bearing2_5
Bearing2_6
Bearing2_7
Bearing3_3
3 RESULTS
In the older brain, decision-making processes tend to
be straightforward and satisfying, enabling quick
responses to potential threats or opportunities. To
elucidate the implementation process and the
practicality of the proposed decision-making
framework, we have structured the results steps in a
manner consistent with the methodology. We selected
the Bearing1_3 experiment as a case study to
illustrate the workings of each information-producing
module. The subsequent timeline and details are
elaborated upon in the methodology section.
3.1 Fault Detection
To establish a clear decision boundary between
normal and anomaly, we evaluate two parameters:
'anomaly' and 'decision score' for categorized
anomalies. If both parameters meet our criteria, we
ICAART 2024 - 16th International Conference on Agents and Artificial Intelligence
1250
label it as an anomaly. Furthermore, to enhance
confidence and reduce false positives, we consider
three consecutive timestamps with anomaly vibration
features as the detection time for anomalies. The two
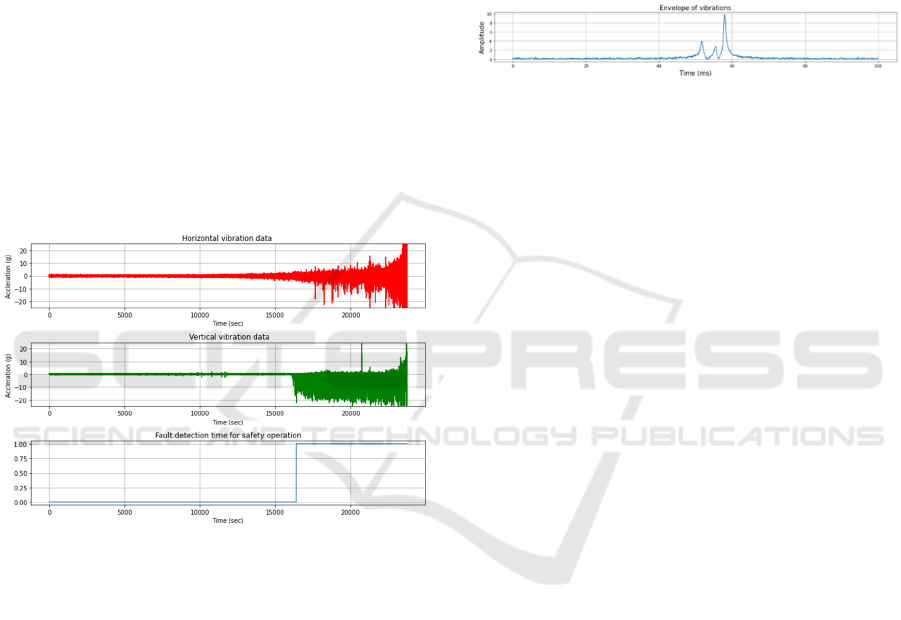
top graphs in Figure 6. show the raw vibration data
from horizontal and vertical accelerometer and the
last graph shows the fault detection time (16430 sec
or 4.56 Hours) is the instance to take procedural
decision. This module results first information about
detection time. The fault detection times for all eleven
experiments are documented in the second column of
Table 3. After detecting faults, the other three module
(fault identification, fault quantification and fault
prognostic) begins to find other information.
In Bearing2_5 experiments, we observed initial
jerks and heightened vibrations that later stabilized
into smooth operation. To eliminate spurious
detections, we disregard faults occurring before 10
percent of the useful life. Any faults detected after
this point are considered genuine, and we employ
analytical methods for rule-based decision-making.
Figure 6: The top two graphs show the temporal vibration
signal of horizontal and vertical accelerometers. The last
graph shows the fault detection time at 16430 sec.
3.2 Fault Identification
The spacing between the peaks of the vibration
envelope serves as an indicator for identifying the
failure component. When the peak spacing falls
within a ±5% deviation from theoretical values, we
classify it as the identified faulty part of the bearing.
For an operating condition of 1800 RPM, the
theoretical peak spacings are 4.53 ms for inner race
defects, 5.91 ms for outer race defects, 9.28 ms for
rolling ball defects, and 76.80 ms or 58.89 ms for cage
defects. After allowing for a 5% margin of deviation,
we consider values within this range as matched cases
for fault identification.
However, in the case of Bearing1_3, as shown in
Figure 7, we cannot find peak spacings that match the
specified fault components. Out of the eleven
experiments, we can only identify the faulty part in
four experiments, as presented in the third column of
Table 3. Additionally, since we lack information
about the effects of each part's failure, we do not
incorporate this information into the rule for decision-
making process. At this moment, advanced signature
extraction techniques are essential for improving fault
detection, with a focus on future work.
Figure 7: Envelope of vibration data after fault detection (at
16430 sec).
3.3 Fault Quantification
The degradation index is computed based on
vibration samples obtained after detecting a fault. The
upper and lower specification limits for acceleration
values are set at -20g and 20g. To determine the
degradation index, we calculate both the lower and
upper limits and then select the minimum value
between these limits for each sensor. The mean
degradation index is subsequently derived by
averaging the results from horizontal and vertical
accelerometers vibration data. The quantification of
fault across all eleven experiments is presented in the
fourth column of Table 3. In case of Bearing1_3
experiment, the degradation index value is 3.36,
which is marginally acceptable for run of down
regulation.
3.4 Fault Prognostics
To expedite RUL estimation, we built a prognostic
module using a dataset of 200 samples, with 190
collected before fault detection and 10 after. We
employed third-order polynomial regression to
estimate RUL. The initial step involves extracting
maximum vibration features from both
accelerometers. Using these features, polynomial
regression models determine coefficients to map the
nonlinear relationship between these features and
time. RUL is calculated as the time difference
between fault detection and the moment the timeline
reaches the 20g failure threshold.
Figure 8 displays RUL estimates from the
prognostic model. The top graph illustrates two
maximum vibration features over time: the red line
represents horizontal max values, and the green line
Rule-Based Decision Making in Biologically Inspired Condition Management System
1251
represents vertical max values. The black vertical line
indicates the fault detection time. Once anomalies are
detected, the model uses 200 samples to calculate and
fit a regression curve. In the lower graph, the yellow
curve represents predictions from the horizontal
accelerometer, while the blue curve represents
predictions from the vertical accelerometer. The
predicted RUL for each experiment is determined by
whichever curve first surpasses the 20g amplitude
threshold, akin to the failure criteria. The predicted
RUL of eleven experiments is presented in the last
column of Table 3.
Figure 8: Estimation of RUL by curve fitting after detection
of fault by using 200 sample near the fault detection time.
Table 3: Information obtained from different fault analysis
submodules for rule-based decision making.
Experim
ents
Fault analysis
Experim
ents
Detect
ion
time
(sec)
Fault type Degr
adati
on
index
RUL
(sec)
B1_3
B1_4
B1_5
B1_6
B1_7
B2_3
B2_4
B2_5
B2_6
B2_7
B3_3
16430
10900
24510
16360
22140
2580
3440
4030
6890
2240
4250
Unidentified
Inner race
Outer race
Unidentified
Unidentified
Unidentified
Unidentified
Unidentified
Outer race
Unidentified
Outer race
3.36
5.63
4.58
9.48
6.38
13.28
20.1
19.32
5.5
7.68
4.88
4920
1060
580
910
830
1370
6390
2970
1150
500
1470
3.5 Fuzzy Rules
Decision making can be regarded as the analytical
processes of making a choice among several
alternatives and committing to a future course of
actions or an opinion of choice. After diagnostics and
prognostics offer crucial information, it becomes
essential to have a decision-making methodology in
place. This methodology is necessary to efficiently
make use of the available information to produce
satisfactory decisions.
We established rules to link procedural decisions
with variables, including detection time, predicted
RUL, and degradation index, drawing from
information as stated in Section 2.5. Figure 9. shows
the input and output membership function of
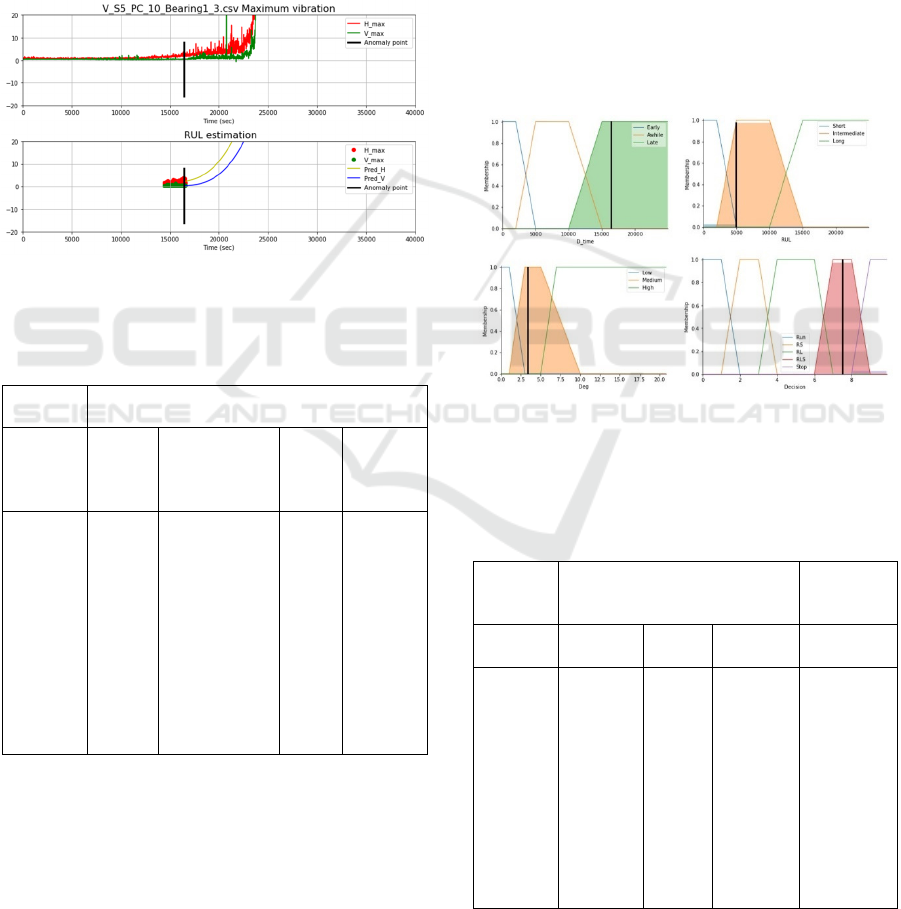
Bearing1_3 for decision making. Here fault detection
time is 16430 seconds, Predicted RUL from that
instance is 4920 seconds and the degradation index is
3.36. By inputting these information’s, the defined
rule gives 7.52 as defuzzification value. Based on
mapping to decision sets, it belongs to reduce load
and speed for safety critical system. Similarly, the
corresponding defuzzification values for eleven
experiments is shown in the last column of Table 4.
Figure 9: Membership functions of inputs and outputs for
the decision making. The top left shows the fault detection
time, the bottom left shows the degradation index, the top
right shows the RUL and the bottom right graph shows the
defuzzification values procedural decisions.
Table 4: Rule-based decision after defuzzification.
Experim
ent
Input membership function
Output
member
function
D_time RUL Degrad_
index
Decision
B1_3
B1_4
B1_5
B1_6
B1_7
B2_3
B2_4
B2_5
B2_6
B2_7
B3
_
3
16430
10900
24510
16360
22140
2580
3440
4030
6890
2240
4250
4920
1060
580
910
830
1370
6390
2970
1150
500
1470
3.36
5.63
4.58
9.48
6.38
13.28
20.1
19.32
5.5
7.68
4.88
7.52
6.69
9.17
7.59
8.13
3.21
1.84
3.93
6.68
3.86
6.61
As mentioned previously, our aim is not to
identify the best decision but to experimentally
ICAART 2024 - 16th International Conference on Agents and Artificial Intelligence
1252

validate rule-based decision-making. However, these
decisions are subject to the failure criteria outlined by
the data provider. The five decision alternatives
include: running as is, reducing speed, reducing load,
reducing load and speed, and stopping.
In this scenario, we assume the decision
membership function ranges from zero to 10 after
defuzzification. We divide this range equally into five
categories. For instance, decision values from 0-2 are
associated with 'run as is,' 2-4 with 'reduce speed,' and
so forth.
Out of the eleven experiments conducted,
Bearing2_4 aligns with the 'run as is' decision, while
Bearing2_3, Bearing2_5, and Bearing2_7 correlate
with 'reduce speed.' Similarly, Bearing1_3,
Bearing1_4, Bearing1_6, Bearing2_6, and
Bearing3_3 fall under 'reduce load and speed,' and
Bearing1_5 and Bearing1_7 signify the 'immediate
stop' decision. Overall, these decisions seem
promising in preventing catastrophic failures in
safety-critical systems and in prolonging bearing life
through downregulation.
4 CONCLUSION
We apply rapid decision-making techniques inspired
by the old brain to enhance timely and effective
decision-making for time-sensitive industrial
equipment. This approach bridges the gap between
cognitive science and condition monitoring, offering
a broader perspective on sustainability and inspiring
future research in design, modelling, validation, and
human-in-the-loop concepts.
In bearing maintenance and fault diagnosis, swift
decisions are crucial to avert catastrophic failures and
minimize downtime. Our model, utilizing vibration
data and extract various information (detection time,
RUL and degradation index , and use that information
with established rules to make instant decisions.
In scenarios with sparse data and basic algorithms,
this rapid decision-making approach proves
beneficial for condition management. It's anticipated
to assist maintenance engineers in enhancing bearing
inspection programs' efficiency. With a specific focus
on bearing faults, these findings offer promise for
real-world applications.
Future work involves experimental validation of
advanced cognitive processes, like root cause
analysis, integrated with procedural decision-making
for improved maintenance actions. This may also
include the incorporation of deep learning and
optimization techniques to continuously enhance
maintenance strategies.
ACKNOWLEDGEMENTS
The authors thank to Maneesh Singh, Knut Øvsthus
and Anne-Lena Kampen for providing useful
discussion.
REFERENCES
American Roller Bearing. (n.d.). Bearing Life Calculation -
Bearing Loads & Speeds. Retrieved January 4, 2024,
from https://www.amroll.com/bearing-selection-load-
life.html
Amgoud, L., & Prade, H. (2009). Using arguments for
making and explaining decisions. Artificial
Intelligence, 173(3–4), 413–436. https://doi.org/10.
1016/J.ARTINT.2008.11.006
Cai, J., Luo, J., Wang, S., & Yang, S. (2018). Feature
selection in machine learning: A new perspective.
Neurocomputing, 300, 70–79. https://doi.org/10.
1016/J.NEUCOM.2017.11.077
Catelani, M., Ciani, L., Galar, D., & Patrizi, G. (2020).
Optimizing Maintenance Policies for a Yaw System
Using Reliability-Centered Maintenance and Data-
Driven Condition Monitoring. IEEE Transactions on
Instrumentation and Measurement, 69(9), 6241–6249.
https://doi.org/10.1109/TIM.2020.2968160
Fridman, L., DIng, L., Jenik, B., & Reimer, B. (2019).
Arguing Machines: Human Supervision of Black Box
AI Systems That Make Life-Critical Decisions.
Conference on Computer Vision and Pattern
Recognition Workshops (CVPRW), 2019-June, 1335–
1343. https://doi.org/10.1109/CVPRW.2019.00173
Gupta, V., Jain, R., Meena, M. L., & Dangayach, G. S.
(2018). Six-sigma application in tire-manufacturing
company: a case study. Journal of Industrial
Engineering International, 14(3), 511–520.
https://doi.org/10.1007/S40092-017-0234-6/FIGURES
/6
Hawkins, J. (2021). A Thousand Brains: A New Theory of
Intelligence. Hachette UK.
Hayes, M. A., & Capretz, M. A. M. (2014). Contextual
anomaly detection in big sensor data. Proceedings -
2014 IEEE International Congress on Big Data,
BigData Congress 2014, 64–71. https://doi.org/10.
1109/BIGDATA.CONGRESS.2014.19
Junior, R. F. R., Areias, I. A. dos S., Campos, M. M.,
Teixeira, C. E., da Silva, L. E. B., & Gomes, G. F.
(2022). Fault detection and diagnosis in electric motors
using 1d convolutional neural networks with multi-
channel vibration signals. Measurement, 190, 110759.
https://doi.org/10.1016/J.MEASUREMENT.2022.110
759
Kandukuri, S. T., Klausen, A., Karimi, H. R., &
Robbersmyr, K. G. (2016). A review of diagnostics and
prognostics of low-speed machinery towards wind
turbine farm-level health management. Renewable and
Rule-Based Decision Making in Biologically Inspired Condition Management System
1253

Sustainable Energy Reviews, 53, 697–708.
https://doi.org/10.1016/J.RSER.2015.08.061
Klir, G. J., & Yuan, Bo. (1995). Fuzzy Sets and Fuzzy
Logic Theory and Applications. Prentice Hall, 574.
Kolodner, J. (2014). Case-Based Reasoning. Morgan
Kaufmann.
Kong, X., Cai, C. S., & Hu, J. (2017). The State-of-the-Art
on Framework of Vibration-Based Structural Damage
Identification for Decision Making. Applied Sciences
2017, Vol. 7, Page 497, 7(5), 497.
https://doi.org/10.3390/APP7050497
Kulkarni, T., Toksha, B., Shirsath, S., Pankade, S., &
Autee, A. T. (2023). Construction and Praxis of Six
Sigma DMAIC for Bearing Manufacturing Process.
Materials Today: Proceedings, 72, 1426–1433.
https://doi.org/10.1016/J.MATPR.2022.09.342
Kwon, S. J., Park, J., Choi, J. H., Lim, J. H., Lee, S. E., &
Kim, J. (2019). Polynomial Regression method-based
Remaining Useful Life Prediction and Comparative
Analysis of Two Lithium Nickel Cobalt Manganese
Oxide Batteries. 2019 IEEE Energy Conversion
Congress and Exposition, ECCE 2019, 2510–2515.
https://doi.org/10.1109/ECCE.2019.8912625
Liu, F. T., Ting, K. M., & Zhou, Z. H. (2008). Isolation
forest. Proceedings - IEEE International Conference on
Data Mining, ICDM, 413–422. https://doi.org/
10.1109/ICDM.2008.17
Marko Bohanec. (2009). Decision Making: A Computer-
Science and Information-Technology Viewpoint.
https://hrcak.srce.hr/clanak/114036
Nectoux, P., Gouriveau, R., Medjaher, K., Ramasso, E.,
Chebel-Morello, B., Zerhouni, N., & Varnier, C.
(2012). PRONOSTIA : An experimental platform for
bearings accelerated degradation tests. 1–8.
Pearn, W. L., & Chen, K. S. (1999). Making decisions in
assessing process capability index Cpk. Quality and
Reliability Engineering International.
Rish, I. (2001). An empirical study of the naive Bayes
classifier. In IJCAI 2001 Workshop on Empirical
Methods in Artificial Intelligence , 41–46.
Singh, M., Øvsthus, K., Kampen, A.-L., & Dhungana, H.
(n.d.). Initial Fault Identification for Procedural
Decision Making Using Biologically Inspired
Condition Management System. The Unified
Conference of DAMAS, InCoME and TEPEN
Conferences (UNIfied 2023).
Singh, M., Øvsthus, K., Kampen, A.-L., & Dhungana, H.
(2024). Development of a Biologically Inspired
Condition Management System for Equipment. Lecture
Notes in Mechanical Engineering, 319–331.
https://doi.org/10.1007/978-3-031-39619-9_23
Singh, M., & Pokhrel, M. (2018). A Fuzzy logic-
possibilistic methodology for risk-based inspection
(RBI) planning of oil and gas piping subjected to
microbiologically influenced corrosion (MIC).
International Journal of Pressure Vessels and Piping,
159, 45–54. https://doi.org/10.1016/J.IJPVP.2017.
11.005
Song, L., Wang, H., & Chen, P. (2018). Vibration-Based
Intelligent Fault Diagnosis for Roller Bearings in Low-
Speed Rotating Machinery. IEEE Transactions on
Instrumentation and Measurement, 67(8), 1887–1899.
https://doi.org/10.1109/TIM.2018.2806984
The Biomimicry Institute — Nature-Inspired Innovation.
(n.d.). Retrieved May 12, 2023, from
https://biomimicry.org/
Trillo, J. R., Fernandez, A., & Herrera, F. (2020). HFER:
Promoting explainability in fuzzy systems via
hierarchical fuzzy exception rules. IEEE International
Conference on Fuzzy Systems, 2020-July.
https://doi.org/10.1109/FUZZ48607.2020.9177575
Van Der Meer, M., Kurth-Nelson, Z., & Redish, A. D.
(2012). Information processing in decision-making
systems. The Neuroscientist : A Review Journal
Bringing Neurobiology, Neurology and Psychiatry,
18(4), 342–359. https://doi.org/10.1177/10738584114
35128
Vassiliades, A., Bassiliades, N., & Patkos, T. (2021).
Argumentation and explainable artificial intelligence: a
survey. The Knowledge Engineering Review, 36, e5.
https://doi.org/10.1017/S0269888921000011
Wang, T., Han, Q., Chu, F., & Feng, Z. (2019). Vibration
based condition monitoring and fault diagnosis of wind
turbine planetary gearbox: A review. Mechanical
Systems and Signal Processing, 126, 662–685.
https://doi.org/10.1016/J.YMSSP.2019.02.051
William, P. E., & Hoffman, M. W. (2011). Identification of
bearing faults using time domain zero-crossings.
Mechanical Systems and Signal Processing, 25(8),
3078–3088. https://doi.org/10.1016/J.YMSSP.2011.
06.001.
ICAART 2024 - 16th International Conference on Agents and Artificial Intelligence
1254
