Identification of Honeybees with Paint Codes Using Convolutional
Neural Networks
Gabriel Santiago-Plaza
1
, Luke Meyers
3
, Andrea Gomez-Jaime
4
, Rafael Mel
´
endez-R
´
ıos
1
,
Fanfan Noel
2
, Jose Agosto
2
, Tugrul Giray
2
, Josu
´
e Rodr
´
ıguez-Cordero
2
and R
´
emi M
´
egret
1
1
Department of Computer Science, University of Puerto Rico R
´
ıo Piedras, Puerto Rico
2
Department of Biology, University of Puerto Rico R
´
ıo Piedras, Puerto Rico
3
Department of Biology, Seattle University, U.S.A.
4
Department of Biology, Universidad de Los Andes, Colombia
gabriel.santiago21, rafael.melendezrios, fanfan.noel, jose.agosto1, tugrul.giray, josue.rodriguez10, remi.megret
Keywords:
Computer Vision, Deep Learning, Re-Identification, Honey Bee Monitoring, Paint Code Recognition.
Abstract:
This paper proposes and evaluates methods for the automatic re-identification of honeybees marked with
paint codes. It leverages deep learning models to recognize specific individuals from images, which is a key
component for the automation of wild-life video monitoring. Paint code marking is traditionally used for
individual re-identification in the field as it is less intrusive compared to alternative tagging approaches and is
human-readable. To assess the performance of re-id using paint codes, we built a mostly balanced dataset of
8062 images of honeybees marked with one or two paint dots from 8 different colors, generating 64 distinct
codes, repeated twice on distinct individual bees. This dataset was used to perform an extensive comparison
of convolutional network re-identification approaches. The first approach uses supervised learning to estimate
the paint code directly; the second approach uses contrastive learning to learn an identity feature vector that is
then used to query a database of known identities. Best performance reached 85% correct identification for all
64 identities, and up to 97.6% for 8 identities, showing the potential of the technique. Ablation studies with
variation in training data and selection of IDs provide guidance for future use of this technique in the field.
1 INTRODUCTION
Paint codes is a technique traditionally used by bi-
ology experimenters in the field for pollinator mon-
itoring (Giray et al., 2015), as it allows marking in-
dividual bees without interrupting their natural activ-
ity. Such paint codes have also been used in labo-
ratory settings on very small animals, such as ants,
for visual identification (Sasaki et al., 2013). Other
techniques involve gluing tags with numbers, bar-
codes (Crall et al., 2015) or RFID (Streit et al., 2003)
elements on the thorax, which requires more intru-
sive manipulation and a heavier marking. Automated
systems for re-identification have so far focused on
more standardized conditions such as tags, which can
have a much more controlled appearance, suitable for
computer vision analysis. Extending automated re-
identification to less standardized markings such as
paint codes opens the door to more lightweight pro-
tocols for individual monitoring of behavior of such
small insects, thus increasing the scope and scale of
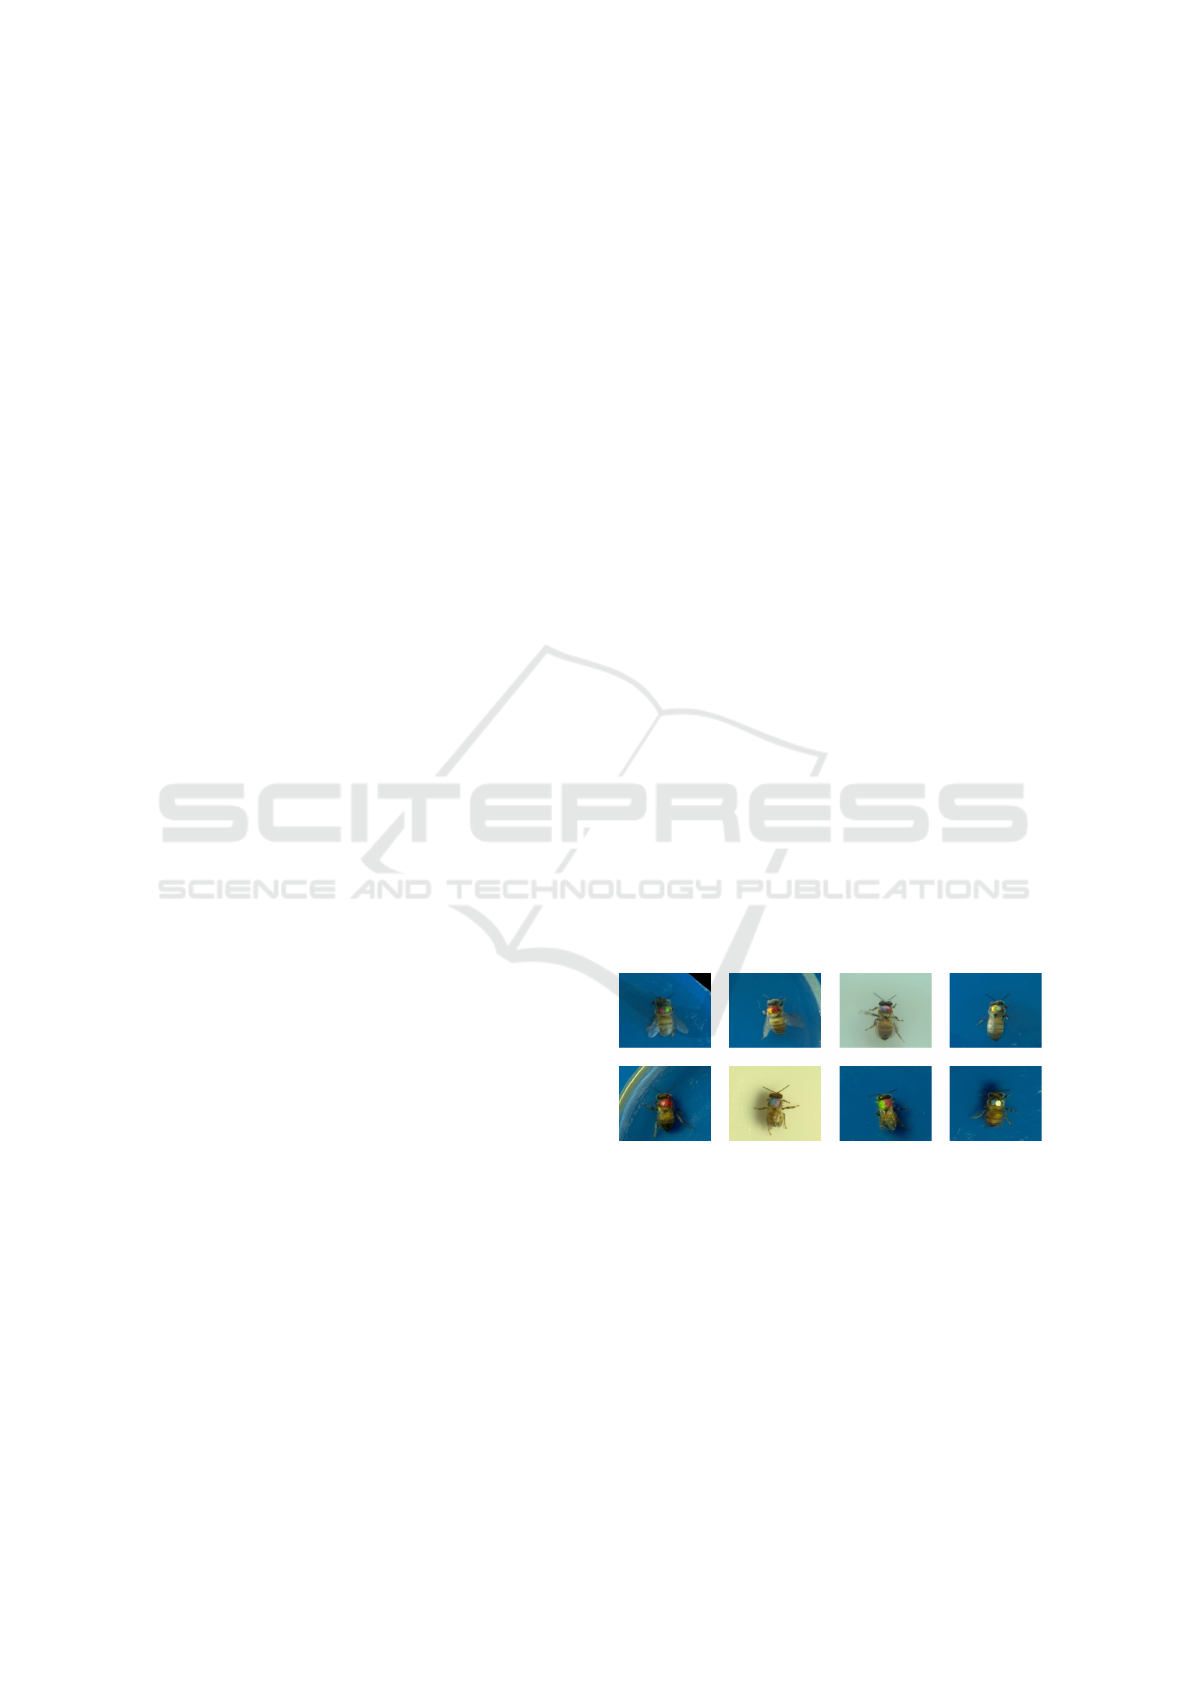
Figure 1: Sample of image of honey bees with paint codes
from the contributed dataset: all 64 codes are designed
from 8 unique colors. The paint markings have two dots
(left/right) with distinct ordered colors, except the 8 mono-
color markings where only one dot is painted in the middle.
Background is either blue or white, with changes in overall
color due to natural lighting variations.
experimentation and behavior analysis that can be
performed in biological and ecological applications.
Using paint marking in automatic re-identification
of honeybees was first demonstrated recently in (Mey-
ers et al., 2023), based on deep learning techniques for
re-identification using contrastive learning. It showed
772
Santiago-Plaza, G., Meyers, L., Gomez-Jaime, A., Meléndez-Ríos, R., Noel, F., Agosto, J., Giray, T., Rodríguez-Cordero, J. and Mégret, R.
Identification of Honeybees with Paint Codes Using Convolutional Neural Networks.
DOI: 10.5220/0012460600003660
Paper published under CC license (CC BY-NC-ND 4.0)
In Proceedings of the 19th International Joint Conference on Computer Vision, Imaging and Computer Graphics Theory and Applications (VISIGRAPP 2024) - Volume 2: VISAPP, pages
772-779
ISBN: 978-989-758-679-8; ISSN: 2184-4321
Proceedings Copyright © 2024 by SCITEPRESS – Science and Technology Publications, Lda.

feasibility of the task for a small amount of indi-
viduals (11 in the test set), based on a dataset col-
lected in real conditions. In this paper, we propose
to approach this problem from a more principled per-
spective with the collection of a large well-controlled
dataset, ensuring training and test data are indepen-
dent, and large enough to perform various types of
ablation studies.
This paper makes the following main contribu-
tions. (i) New annotated dataset of 20730 images
of honey bees displaying 64 different paint codes,
with 127 different individuals, from which a mostly
balanced dataset of 8062 images with two indepen-
dent training and testing splits were extracted for the
development of re-identification models. Figure 1
shows a sample of such images. (ii) comparison of
two approaches for re-identification: a color code
classification approach and a contrastive learning re-
identification approach. (iii) experimental evaluation
of the impact of training data on performance, in
terms of diversity and quantity, providing guidelines
on the use of such techniques in practice.
The rest of this paper is organized as follows. In
section 2, we will discuss related work and the mo-
tivation for the proposed methods. In section 3 we
will present the methods used to collect the dataset,
the machine learning models and the design of the re-
identification pipeline. In section 4, we will present
the experimental results of the performance evalua-
tion, then conclude and discuss possible future work
enabled by these results in section 5.
2 RELATED WORK
Identification of honeybees by beekeepers is tradi-
tionally performed visually using numbered tags or
colored paint, or using electronic RFID tags for en-
trance/exit detection. Automatic identification of bees
from video usually uses barcode tags instead (Crall
et al., 2015; Boenisch et al., 2018; Smith et al., 2022;
Rodriguez et al., 2022; Chan et al., 2022), which can
be more easily detected and decoded by the machines
and provide a potentially large number of codes. De-
spite these advantages, using such tags for bee mark-
ing involves gluing them to their thorax, which re-
quires delicate manipulation. Adult individuals need
to be sedated with CO2 gas to avoid them flying away
or stinging while attaching the tag and waiting for the
glue to dry properly, which is relatively invasive.
In contrast, paint codes are more lightweight, as
they only requires depositing a small quantity of paint
on the thorax using a very thin brush or a toothpick,
which can be done while the bees are busy drinking
nectar, even in the field. Paint codes also can be rec-
ognized visually by the beekeepers without the need
for machine assistance, which is not the case for bar-
code or RFID tags. This makes paint codes a method
of choice for experiments in the field, where wild in-
dividuals need to be marked quickly and with as lit-
tle disruption as possible. Biology bee specialists can
routinely deposit codes of 1, 2 or 3 dots of paint with-
out capturing the individuals, creating a large number
of potential codes. Despite this, human perception
still restricts the number of individuals that can be
monitored visually at once, and the constant attention
needed to perform such identification over long peri-
ods of time makes it prone to errors. Due to this, ex-
periments such as learning assays (Giray et al., 2015)
where bees are monitored on their choice of flowers
from patches of 36 artificial flowers are, for instance,
limited to 5 individuals monitored over one day, thus
requiring weeks of experimentation to obtain enough
data to be conclusive. Once bees are marked, au-
tomating the re-identification with video analysis has
the potential to enable monitoring of a much larger
number of individuals for longer periods of time.
Deep Learning has recently enabled markerless
re-identification of diverse animals with good perfor-
mance (see (Ravoor and Tsb, 2020) for a review, as
well as (Romero-Ferrero et al., 2019; Li et al., 2019;
Papafitsoros et al., 2022; Bergamini et al., 2018)).
Markerless Re-ID was also applied to honey bees
(Bozek et al., 2021; Chan et al., 2022) and bumble-
bees (Borlinghaus et al., 2023), with promising re-
sults. The general approach in these cases is that of
representation learning, where an identity feature vec-
tor is trained to discriminate between individuals from
the training set. Due to the large variability of appear-
ances and the complexity of image analysis, a deep
neural network is typically used for the feature ex-
traction step, in order to extract invariant but discrim-
inative features.
The case of paint codes, which is an intermedi-
ate case between completely markerless Re-ID and
the much more constrained tag recognition has not re-
ceived much attention. Using paint markings in auto-
matic re-identification of honeybees was first demon-
strated in (Meyers et al., 2023). In this work, individ-
ual bees where painted in-situ in a flower patch ex-
perimental setup, and monitored through video dur-
ing several days. Bees where detected and tracked
in the videos, then manually annotated by identity,
yielding a dataset of 4392 images with 27 identities.
A Re-ID model was trained using a contrastive learn-
ing approach to learn a 128-dimensional feature vec-
tor with a convolutional neural network model. Ex-
periments showed excellent performance in closed-
Identification of Honeybees with Paint Codes Using Convolutional Neural Networks
773
set setting (99.3% Top-1 performance with a gallery
of 10 images) where images of the exact same indi-
viduals were used to train the model and test the re-
identification. In open-setting, where different indi-
viduals were used for training (16 IDs) and testing (11
IDs), performance dropped to 87%. In open-setting,
only a limited number of images can be used as refer-
ence for each identity, which requires the feature ex-
traction model to be pre-trained on a separate dataset
beforehand, and makes the problem more challeng-
ing, but more realistic because of the fact that no
extensive retraining of the models can be performed
once in the field.
For this reason, we focus in this paper on the open-
setting setup, where different individuals are used in
model training and testing, thus being more relevant
to the target application. To explore this, we will
base our work on a new significantly larger dataset
to ensure enough diversity during training and a large
enough testing set to evaluate in a principled way the
potential to recognize a larger number of identities.
3 METHODS
3.1 Dataset Collection and Design
The 64 IDs image dataset contributed in this paper
was generated by processing video data of 127 indi-
vidual bees marked with paint codes. This subsection
describe the collection and processing methods used.
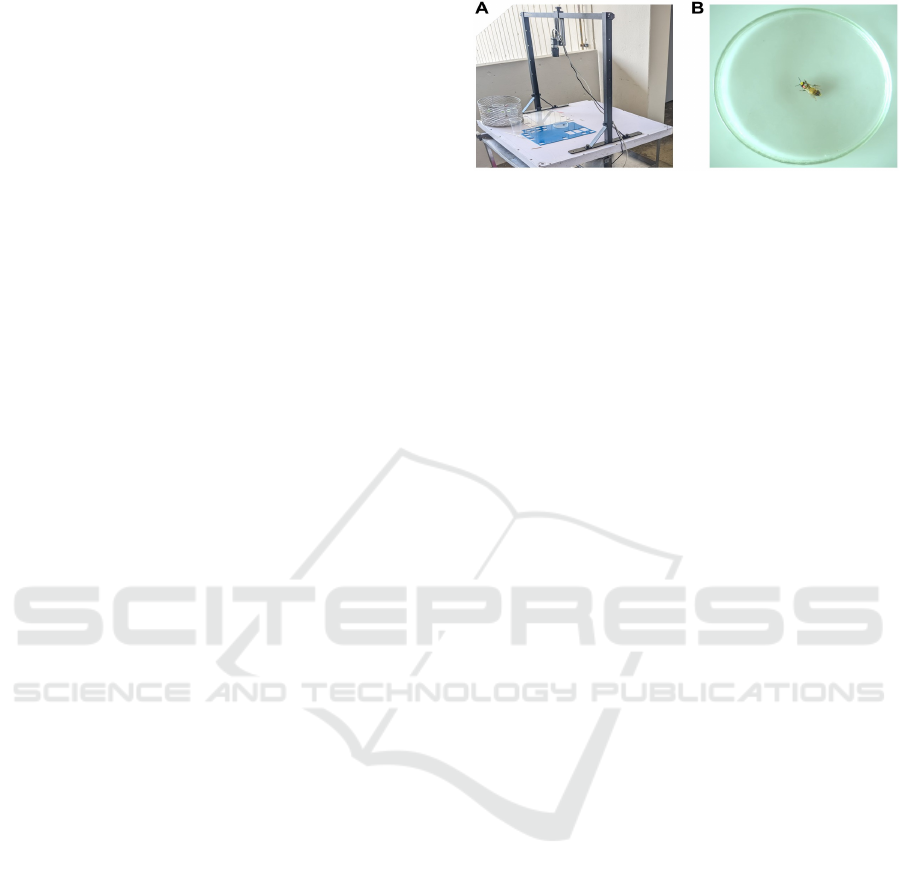
Video Collection. The hardware setup for the video
collection is illustrated in Figure 2-A. We captured the
videos using an NVIDIA Jetson Xavier edge comput-
ing system executing a GStreamer pipeline to capture
MP4 videos from a Basler acA1920-40gc GigE cam-
era with a resolution of 1920x1184 at 30 fps. The
honey bees were placed individually in a petri dish
that encompassed the whole field of view of the cam-
era and left to walk for a few seconds each to capture
different poses. The background color was provided
by an acrylic sheet below the petri dish, swapped be-
tween white and blue colors. White and blue acrylic
has been used as a neutral visual differentiator for
bees in choice assay experiments by (Giray et al.,
2015) and thus is similar to visual conditions of field
experiments.
Handling of Bees and Paint Code Marking. The
64 colorIDs in the dataset consist of all bi-color per-
mutations of eight shades of enamel paint, as illus-
trated in Figure 1. Bright tones of red, lilac, yel-
Figure 2: A) Video collection setup composed of a high-
resolution camera capturing a petri dish where individuals
are introduced one by one. White and blue acrylic sheets are
put behind the petri dish in sequence to define two modal-
ities for the background color. B) Example of raw image
capture, with skeleton keypoints detection overlaid.
low, blue, green, pink, orange and white were selected
for the experiment. Pairs with different colors were
marked with the first color on the left of the thorax,
and the second color on the right. Pairs with the same
color (monocolor) were marked as a single dot in the
middle. The thorax of each individual was painted us-
ing toothpicks, following standard procedures for this
type of marking (Giray et al., 2015).
The bees used to produce the dataset were all
young adult bees within their first 2 days post-
eclosion. While young adults, the bees cannot sting
nor fly away and are kept in plastic cups with the bor-
der greased in order to prevent their escape. There-
fore, using young adult bees greatly improved the
feasability of collecting sufficient images of all 128
individuals in multiple conditions over time. Each
batch of 64 bees was able to be recorded for a set
amount of time in sequence, thus ensuring a balanced
presence of all 64 codes in the final dataset. Such or-
der also aided the ID annotation of the extracted im-
ages, compared to the annotation of images without
any specific order, therefore reducing the probability
of annotation errors.
Data Leakage and Train/Test Split. The protocol
used also helped reduce the risk of data leakage. As
mentioned in (Stock et al., 2023), ecological data is
very prone to data leakage, due to the difficulty in col-
lecting enough independent data and ensuring control
of external factors. In our case, the background, pose
or location within the image or other external factor
may provide unintended information about the iden-
tity, if not controlled for properly. For these reasons,
the data collection protocol ensured that frames of
each individual were collected several times, and over
two distinct backgrounds (white and blue) in condi-
tions kept as similar as possible across all individuals.
Each colorID was repeated twice, to mark 128 in-
dividual bees in total. This provided a first batch of 64
individuals (batch1) used for training, and a second
VISAPP 2024 - 19th International Conference on Computer Vision Theory and Applications
774

Figure 3: Distribution of images per batch, individual ID and background color. To mostly balance the dataset, 64 images
were retained for each ID, 32 with white background and 32 with blue background, with a few exceptions. Training ID 4
(yellow-pink) did not receive any images, but all other IDs had at least 16 images associated to them.
independent batch (batch2) used for testing. This fol-
lows the open-setting approach, where batch1 is used
to train the models, and batch2 simulates new data
collected during an experiment with different individ-
uals. Thus, batch2 data is to be used at inference time
and is not meant to retrain the model extensively.
Image Extraction. Once the videos were recorded,
a pose detection model was trained using the
SLEAP.ai software (Pereira et al., 2022). The top of
the head, the thorax, the waist and the bottom of the
abdomen were used as keypoints for each bee (see e.g.
Figure 2-B). This model was then applied to all col-
lected videos, and the detections were tracked through
time to generate continuous tracks of each individual.
When changing the background or the individual, the
track was naturally interrupted. Based on the detec-
tions, images of resolution 256x256 were extracted
centered on the thorax and rotated such that the waist-
head line is vertical (see Figure 1).
Annotation and Balancing. These images were
annotated using FiftyOne (Moore and Corso, 2020)
with the following fields: individualID, colorID,
trackID, background color, and location (in-lab or
outside). This generated an unbalanced dataset of
20730 images.
This dataset was balanced by selecting a maxi-
mum of 64 images per ID and ensuring the same
amount of white and blue backgrounds when possi-
ble. Only a few individuals didn’t reach 64 images
(6 in training and 9 in testing) due to challenges of
capturing enough data at this scale, with one individ-
ual (individualID 4) not being represented at all. The
final dataset is therefore composed of two batches of
individuals: training batch1 with 63 individuals and
colorIDs, and testing batch2 with 64 individuals and
colorIDs, for a total of 127 individuals (see Figure 3).
3.2 Dataset Splits
To evaluate the effect of the impact of quantity and
diversity of data available during training, two param-
eters were considered: number of identities and num-
ber of images per identity.
Choice of the Number of Identities. In varying the
number of bee identities we chose splits according to
the color combinations in our dataset. Since color po-
sition matters when recognizing the bee’s identity, we
defined symmetric and asymmetric subsets of IDs. A
symmetric subset of all 64 IDs is such that whenever
a code is present, its symmetrical code obtained by
swapping left and right is also present (for instance,
both yellow-green and green-yellow would be part of
such subset). A subset is asymmetric otherwise.
We created ID splits with the constraint that all
colors be represented uniformly, thus generating four
symmetric splits:
• 8 symm IDs with a monocolor thorax, each color
is represented once,
• 16 symm IDs with symmetrical color codes, each
color is represented two times on each side,
• 32 symm IDs following 16 symm approach with
four repetitions,
• 64 IDs using all IDs, which is naturally symmet-
ric.
and three asymmetric splits:
• 8 asym IDs with two different colors in each pair,
each color is represented one time on each side,
and no two colors were shown together more than
once,
• 16 asym IDs extending the 8 asym IDs with 8 ad-
ditional asymmetrical IDs,
• 32 asym IDs combining the 16 asym IDs with 8
additional asymmetrical IDs.
Note, for the training split, one ID was missing, lead-
ing to a 63 maximum number of IDS, which was still
Identification of Honeybees with Paint Codes Using Convolutional Neural Networks
775

considered symmetric as this was a single exception.
Other training splits avoided the missing ID.
Split for a Number of Images per Identity. By
keeping the number of identities fixed, a set of splits
were generated for various amounts of images per
identity. We chose our number of images ranging
from 2, 4, 8, 16, 32, and 64 images per individual,
evenly distributing the white and blue backgrounds
for each identity.
To ensure as much independence as possible for
the reference/query splits discussed in subsection 3.4,
trackID was used in a stratified sampling manner,
where the 4 images per ID in the reference split did
not share the same track as any of the images in the
query split, thus avoiding near duplicate images in
both datasets, which would have occured when sam-
pling randomly.
3.3 Color Recognition Model
The color recognition model (CR) is designed to pre-
dict directly the color of the left and right paint dots.
For this we used the following encoding: the output
vector is of dimension 16, obtained by the concate-
nation of two one-hot encoding vectors: one for the
8 possible colors for the left paint dot and 8 possi-
ble colors for the right paint dot. The case of mono-
color IDs was encoded as both left and right having
the same color.
The model backbone is a deep convolutional net-
work, ResNet50, truncated after layer conv3, with a
classification head made of 1 dense layer with 16 di-
mensional output and sigmoid activation. The loss
function used is the average Binary Cross Entropy
(BCE). The Adam optimizer was used with a learn-
ing rate of 0.001, a batch size of 64, and a training
duration of 1300 epochs. Dropout layers were used
during training before and after the fully connected
layer at rates of 0.5 and 0.2, respectively. Data aug-
mentation was applied with a probability of 30%. It
included random rotation around the center and ran-
dom change of brightness and contrast in the interval
(0.5, 1.5).
Inference is performed by applying the model to a
test image and selecting for each side (left/right) the
color with highest value in the output vector.
3.4 Contrastive Learning Model
The supervised contrastive learning model (SCL) is
designed to output an identity feature vector (Khosla
et al., 2020) that allows to discriminate each identity
based on proximity in feature space. This is a re-
identification approach (Wang et al., 2020), where the
feature extraction model needs to be complemented
at inference time with an additional reference dataset,
or gallery, that provides the labeled images to be re-
trieved for each query image.
The model backbone is the same deep convolu-
tional network as for the Color Recognition model,
with an embedding head made of 1 dense layer fol-
lowed by L2-normalization, to produce a 128 dimen-
sional feature vector. The model was trained in a
similar manner as FaceNet (Schroff et al., 2015), us-
ing Triplet Loss with a margin of 0.2. The triplets
were generated by a semi-hard triplet miner to iden-
tify all semi-hard triplets in each batch to configure
the loss. The same optimization, dropout, and aug-
mentation parameters as the Color Recognition model
were used.
At inference time, we used a simple nearest neigh-
bor classifier (NN) to evaluate the embedding vectors
produced by the SCL model. We call reference and
query splits the set of images used to train/test the
NN classifier, to avoid confusion with the train/test
split used to train the SCL model itself.
4 EVALUATION
Evaluation Protocol. The CR model’s accuracy
was evaluated based on correct identification of the
ColorIDs in the test split. The SCL model’s accuracy
was measured as Top-1 Accuracy.
For SCL evaluation, each batch (batch1/batch2)
was split at the trackID level into a reference and
query subset. While each of these subsets contains
all identities, the reference set of images contain up
to four images per identity and the query set contains
the rest of the images that do not share a trackID with
the references. These sets were used as the base from
which to sample the reference and test splits.
For the SCL model, we considered two ap-
proaches for the reference split, everything else be-
ing equal. The SCL model was trained on a training
split from batch1, and the NN model was tested on
a query split from the testing split (batch2), follow-
ing an open-setting approach where re-identification
is performed on a different set of individuals than in
model training. The only variable changed was the
choice of the reference split to initialize NN eval-
uation, which was either pre-defined as a Training
Reference split from batch1 (the query has the same
paint code colorIDs as the reference, but with differ-
ent individuals), or as a Testing Reference split from
batch2 (query has the same individuals as the refer-
VISAPP 2024 - 19th International Conference on Computer Vision Theory and Applications
776
ence). Thus the SCL model can be evaluated on its
ability to recognize an ID on color code alone (Train-
ing Reference split), as well as individual specific fea-
tures (Testing Reference split).
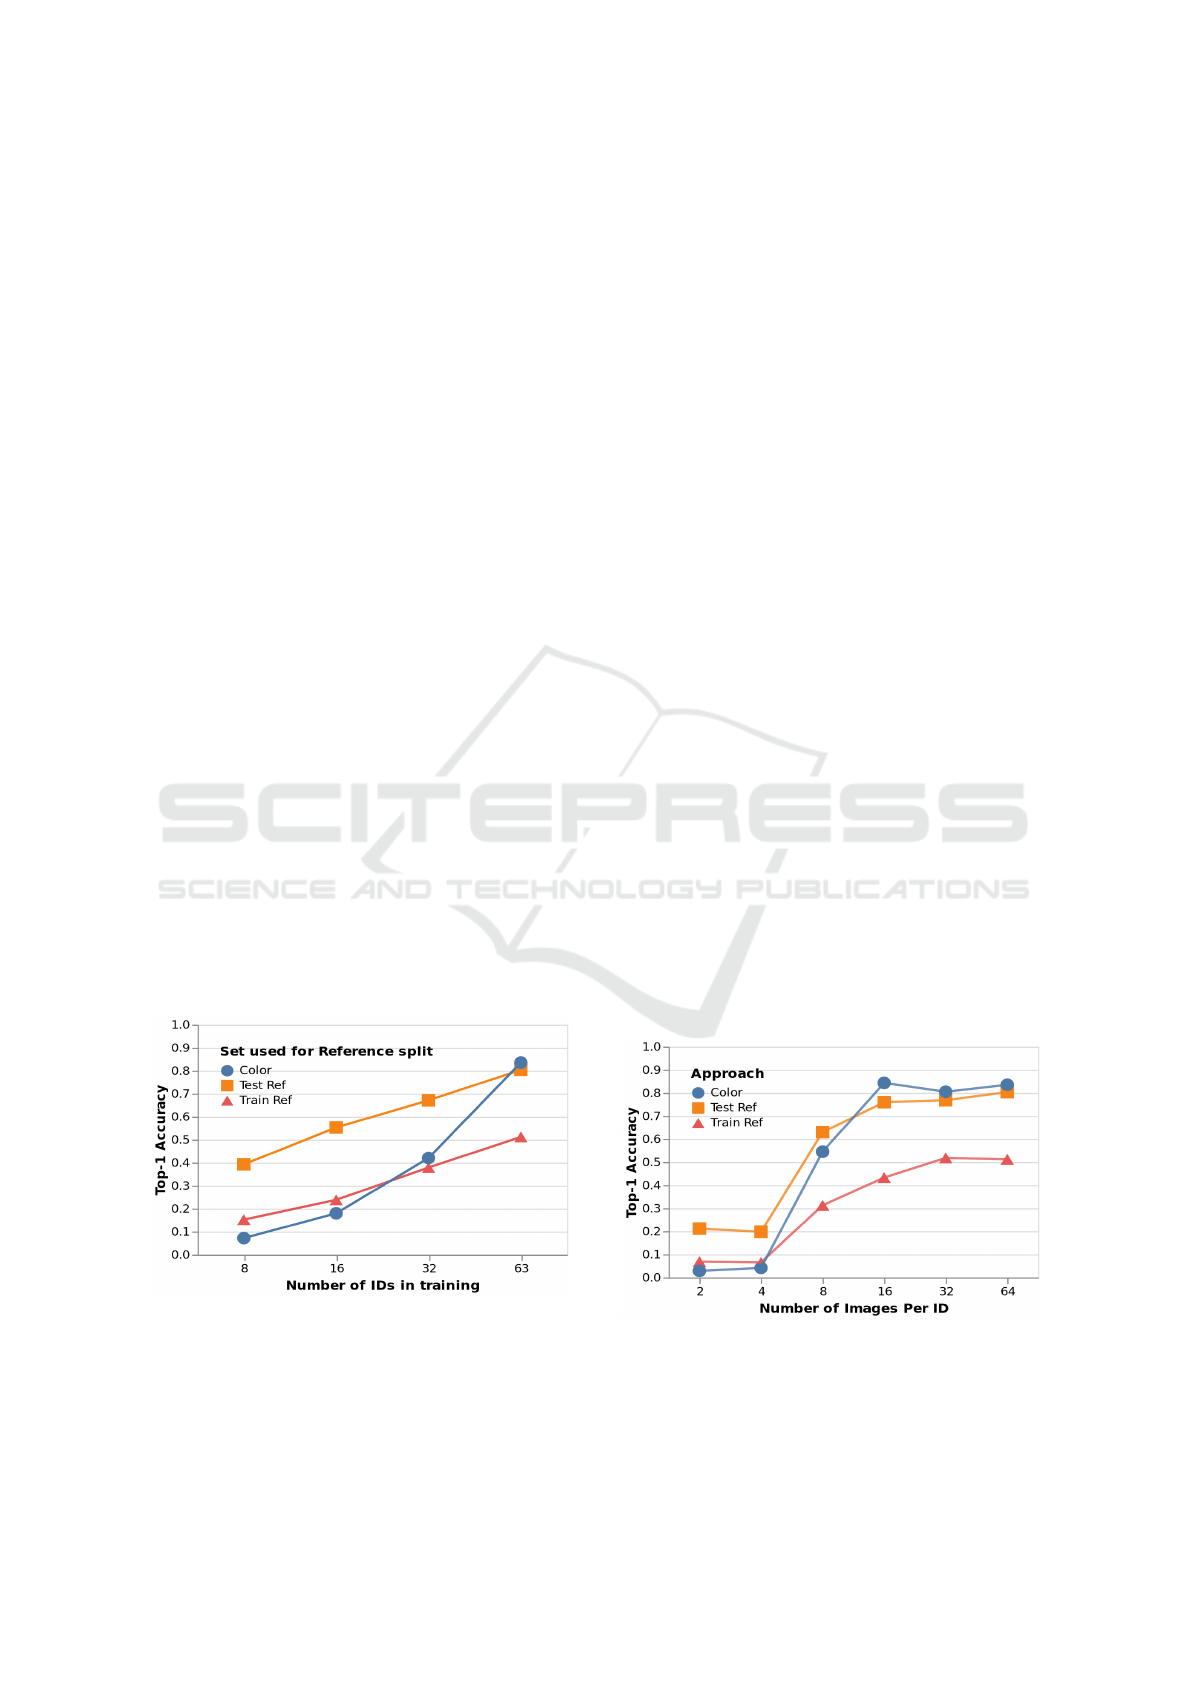
Impact of the Number of IDs in the Training Set.
The CR and SCL models were trained using varying
numbers of IDs and evaluated for all 64 IDs. The 8,
16, 32 and 63 symm train splits were used, ensuring
each color appeared the same amount of times on each
side. Results are shown in Figure 4. We can see a
clear trend that the the performance improves with the
number of IDs for all approaches.
When trained on all IDs, the CR model performed
better than the SCL models. We also see that the use
of training reference images with the SCL model af-
fected the performance significantly compared to us-
ing testing reference images, even if they shared the
same colorID. The SCL models performed superior to
the CR model for lower numbers of training IDs.
A possible explanation for these observations is
that while the CR model is trained to ignore any traits
not related to the color code, the SCL model may
also take into account additional features such as mor-
phology or paint shape in the bee when re-identifying.
This may have helped the SCL model in the low train-
ing ID regime in the test reference case, by providing
additional features extracted by the model to create
meaningful distinctions between new identities, but
hindered performance by taking into account infor-
mation that was not relevant to recognize the colorID
in the train reference case. The CR model was not as
robust in the low ID regime, as it seems it was more
reliant on being trained on examples of specific color
codes to recognize them in the future.
Figure 4: Impact of the number of colorIDs during train-
ing on the identification performance of the 64 test IDs. 3
approaches are compared: Color is the color recognition ap-
proach, Train ref/Test ref is re-identification using the SCL
model with a train or test reference set respectively. See text
for discussion.
Impact of the Number of Images per ID in the
Training Set. The CR and SCL models were also
trained using varying numbers of images per each of
the 64 training IDs. The models were evaluated for
performance on all 64 test IDs. Results are shown
in Figure 5. For all approaches, there is a substan-
tial drop in performance for less than 16 images per
ID, but show diminishing returns after that. Coupled
with previous analysis on the number of training IDs,
at a given budget for the number of images, priority
should be given to a diverse set of identities, rather
than multiplying the number of distinct images for
a limited number of IDs. The color recognition ap-
proach performed the best in this experiment, with
slightly better performance than the SCL approach
with test reference. These results support that espe-
cially for an experimental setup with video data, a rel-
atively small number of images may contain enough
variation in conditions or pose to train a robust model.
Impact of the Choice and Number of Test IDs.
The CR and SCL models that were trained with all 64
identities and 64 images per identity were also eval-
uated on test sets with a smaller number of IDs. Our
splits for testing were divided into symmetrical and
asymmetrical color codes as defined in subsection 3.2.
Results shown in Figure 6 confirm a performance in-
creases with fewer test identities for the SCL model.
The CR model performance does not show such an
increase. Although the CR model had slightly better
performance for 64 test IDs, it is outperformed by the
SCL model for a lower number of IDs. We also note
that there is not a clear difference between symmetri-
cal and asymmetrical IDs. Importantly, 97.6% perfor-
mance was achieved with 8 symm IDs, and 95.2% 16
asymm IDS, showing the feasibility of high-accuracy
Figure 5: Impact of the number of training images per ID
on the identification performance of the 64 test IDs. 3 ap-
proaches are compared: Color is the color recognition ap-
proach, Train ref/Test ref is re-identification using the SCL
model with a train or test reference set respectively. See text
for discussion.
Identification of Honeybees with Paint Codes Using Convolutional Neural Networks
777
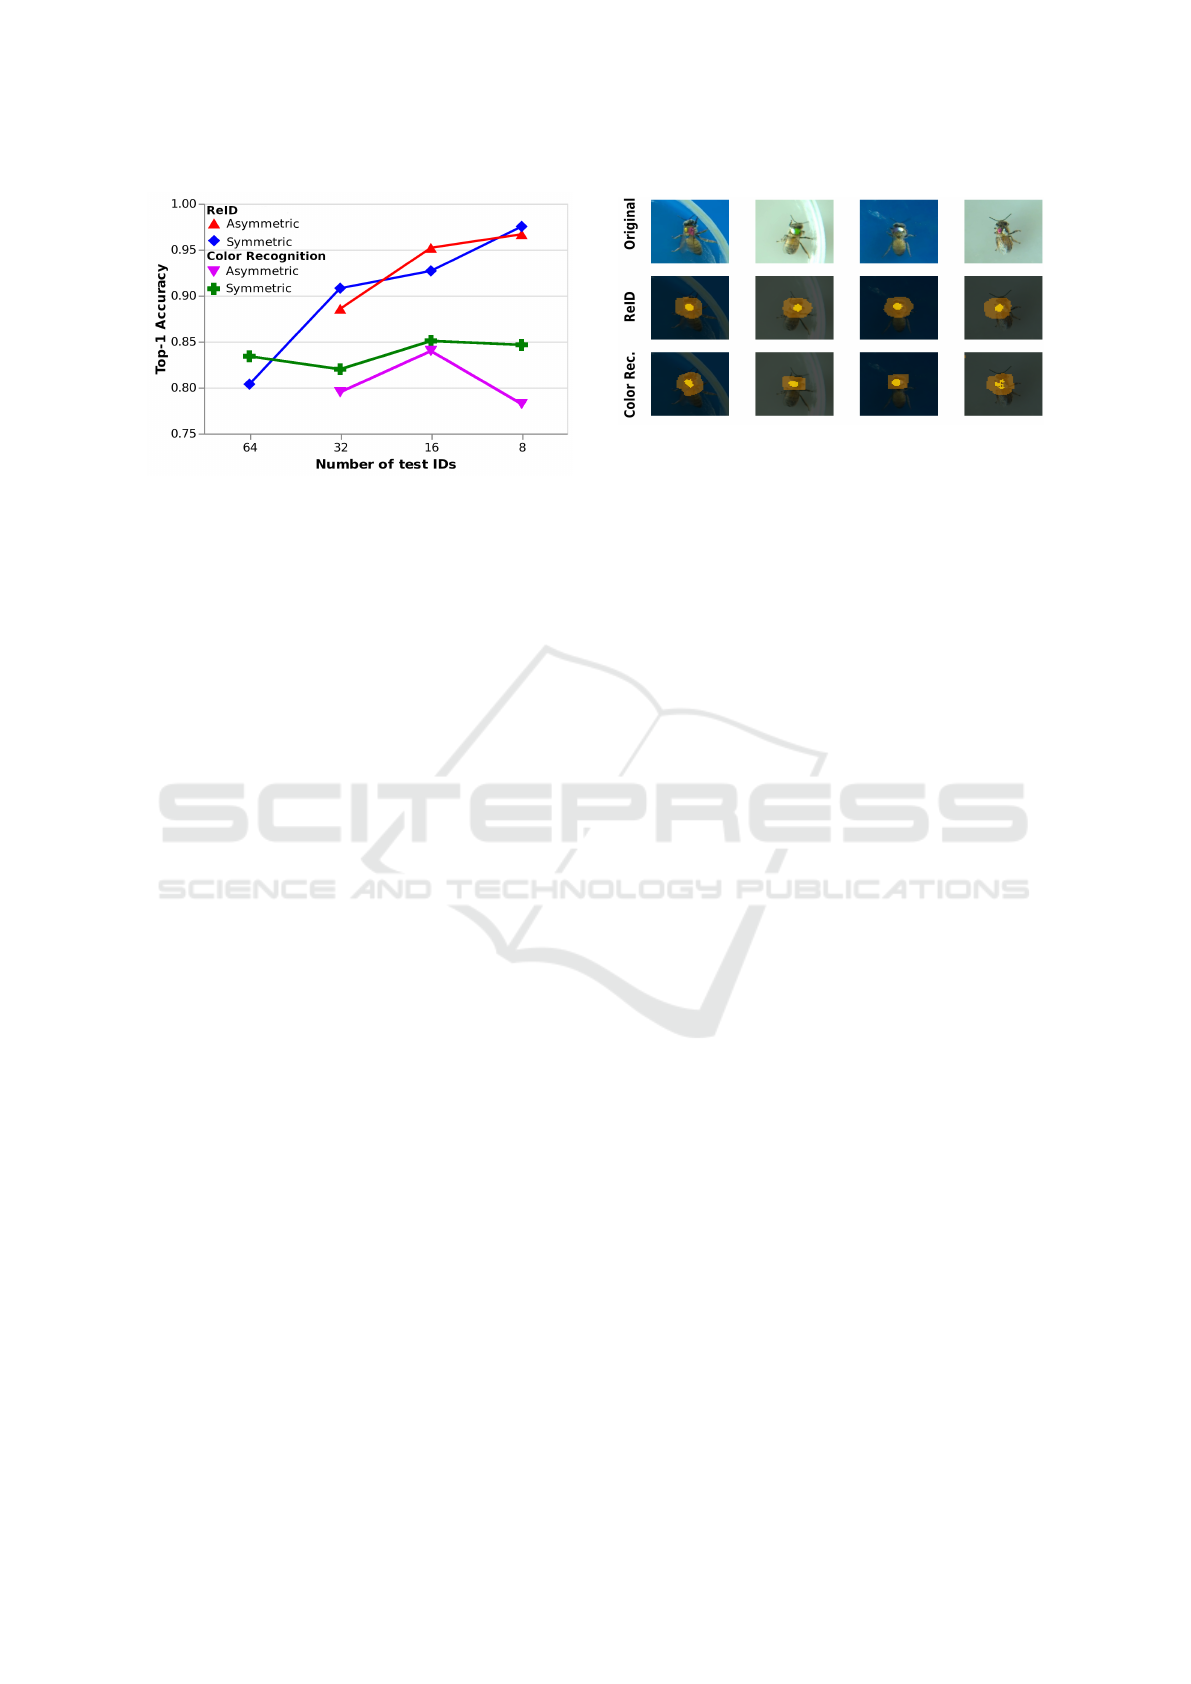
Figure 6: Impact of the number of test IDs on the perfor-
mance of the models trained on 64 IDs. Two models are
considered: SCL model with test reference set (ReID), and
CR model. The SCL model with training reference is not
shown. Separate curves are drawn for test ID subsets with
symmetrical colorIDs vs asymmetrical colorIDs.
re-identification on a limited set of unique IDs using
a larger training set.
4.1 Occlusion Masks
Occlusion sensitivity maps were computed with the
best performing (for 64 IDs) trained CR and SCL
models by occluding small sections of the image to
understand which parts of the image are more impor-
tant for the model to make a decision. We used an oc-
clusion area of 32x32 pixels, roughly equal to the size
of the paint marks, and a stride of 4 pixels. The dis-
similarity between the feature vectors obtained from
the masked and unmasked images was used as in-
dicator of importance of a region for the decision.
This resulted in 2D heat maps representing the impor-
tance of each region of the images. These maps were
then thresholded at the 99
st
and 90
th
percentiles and
overlayed to the original image to understand exactly
which areas of the image had a higher importance (see
Fig. 7).
These maps show that the models focus on the
paint codes first and neighboring region second and
tend to ignore the background, thus confirming that
the models were able to learn the importance of the
paint for identification without explicit guidance. The
color recognition model appears to have a slightly
smaller spread around the paint mark in some im-
ages, suggesting it uses less information from the
paint marking edges or the bees’ body compared to
the SCL model.
Figure 7: Occlusion mask analysis of the best models.
First row: input images. Second row: Heat-map for SCL
model. Third row: Heat-map for CR model. The heat-map
was thresholded by quantile, showing the 99
th
percentile in
bright yellow, and the 90
th
percentile in orange.
5 CONCLUSIONS
In this paper, we introduced a new dataset and ex-
periments to evaluate the identification of honey bees
painted with color codes of one and two colors using
convolutional neural networks. The data collection
and preparation was designed to ensure suitability of
the datasets to properly evaluate the performance on a
reasonably large number of distinct colorIDs (64).
A color recognition and a re-identification ap-
proach were compared, and their performances dis-
cussed. The color recognition performed better when
trained with all available training IDs, and did not
require test reference data to generalize. The re-ID
approach was more general in its approach, as it did
not enforce any specific structure to the paint codes.
Given a few samples per test ID, it performed bet-
ter than the more specific color recognition approach
in regime with lower amount of training IDs. It also
performed better when testing on a subset of identi-
ties. Qualitative analysis of the models showed that
the models’ decisions were most sensitive to the tho-
rax region where the paint code is located, confirming
the ability of the models to focus on the same region
that human experts use, with only the weak signal of
the global identity during training.
Following these results, it appears the significant
effort put in the data collection of 64 unique identities
was a key in obtaining good performance from the
models. Large-scale diverse datasets for animal re-
identification are still a bottleneck for training mod-
els that can work with lightweight markings such
as paint codes, which have a high intrinsic variabil-
ity due to the way they are marked, and low con-
trol of image capture conditions. For this reason,
the contributed dataset is available to the community
at https://github.com/megretlab/bee-paintreid. Future
work will tackle the collection of additional data to
VISAPP 2024 - 19th International Conference on Computer Vision Theory and Applications
778

reach saturation of performance and improve gener-
alization to new setups, as well as using additional
information such as tracking and morphology estima-
tion to leverage the existing data further.
ACKNOWLEDGEMENTS
This research was supported by USDA/NIFA, award
2021-67014-34999, by the PR-LSAMP Bridge to the
Doctorate Program, NSF award 2306079 and by IQ-
BIO REU, NSF award 1852259. This work used
the UPR High-Performance Computing facility, sup-
ported by NIH/NIGMS, award 5P20GM103475.
REFERENCES
Bergamini, L., Porrello, A., Dondona, A. C., Del Negro, E.,
Mattioli, M., D’alterio, N., and Calderara, S. (2018).
Multi-views embedding for cattle re-identification. In
2018 14th international conference on signal-image
technology & internet-based systems (SITIS), pages
184–191. IEEE.
Boenisch, F., Rosemann, B., Wild, B., Dormagen, D.,
Wario, F., and Landgraf, T. (2018). Tracking all mem-
bers of a honey bee colony over their lifetime us-
ing learned models of correspondence. Frontiers in
Robotics and AI, 5:35.
Borlinghaus, P., Tausch, F., and Rettenberger, L. (2023). A
purely visual re-id approach for bumblebees (bombus
terrestris). Smart Agricultural Technology, 3:100135.
Bozek, K., Hebert, L., Portugal, Y., Mikheyev, A. S., and
Stephens, G. J. (2021). Markerless tracking of an
entire honey bee colony. Nature communications,
12(1):1733.
Chan, J., Carri
´
on, H., M
´
egret, R., Agosto-Rivera, J. L., and
Giray, T. (2022). Honeybee re-identification in video:
New datasets and impact of self-supervision. In Pro-
ceedings of the 17th International Joint Conference
on Computer Vision, Imaging and Computer Graphics
Theory and Applications (VISIGRAPP 2022), volume
5: VISAPP, pages 517–525.
Crall, J. D., Gravish, N., Mountcastle, A. M., and Combes,
S. A. (2015). Beetag: a low-cost, image-based track-
ing system for the study of animal behavior and loco-
motion. PloS one, 10(9):e0136487.
Giray, T., Abramson, C. I., Chicas-Mosier, A., Brewster,
T., Hayes, C., Rivera-Vega, K., Williams, M., and
Wells, H. (2015). Effect of octopamine manipulation
on honeybee decision making: reward and cost dif-
ferences associated with foraging. Animal Behaviour,
100:144–150.
Khosla, P., Teterwak, P., Wang, C., Sarna, A., Tian, Y.,
Isola, P., Maschinot, A., Liu, C., and Krishnan, D.
(2020). Supervised contrastive learning. Advances
in neural information processing systems, 33:18661–
18673.
Li, S., Li, J., Tang, H., Qian, R., and Lin, W. (2019). ATRW:
a benchmark for amur tiger re-identification in the
wild. arXiv preprint arXiv:1906.05586.
Meyers, L., Cordero, J. R., Bravo, C. C., Noel, F., Agosto-
Rivera, J., Giray, T., and M
´
egret, R. (2023). To-
wards Automatic Honey Bee Flower-Patch Assays
with Paint Marking Re-Identification. Workshop
CV4Animals, in conjunction CVPR 2023, Vancouver,
Canada. arXiv:2311.07407.
Moore, B. E. and Corso, J. J. (2020). Fiftyone. GitHub
page: https://github.com/voxel51/fiftyone.
Papafitsoros, K., Adam, L.,
ˇ
Cerm
´
ak, V., and Picek, L.
(2022). Seaturtleid: A novel long-span dataset high-
lighting the importance of timestamps in wildlife re-
identification. arXiv preprint arXiv:2211.10307.
Pereira, T. D., Tabris, N., Matsliah, A., Turner, D. M., Li, J.,
Ravindranath, S., Papadoyannis, E. S., Normand, E.,
Deutsch, D. S., Wang, Z. Y., et al. (2022). Sleap: A
deep learning system for multi-animal pose tracking.
Nature methods, 19(4):486–495.
Ravoor, P. and Tsb, S. (2020). Deep Learning Methods for
Multi-Species Animal Re-identification and Tracking
– a Survey. Computer Science Review, 38:100289.
Rodriguez, I. F., Chan, J., Alvarez Rios, M., Branson,
K., Agosto-Rivera, J. L., Giray, T., and M
´
egret, R.
(2022). Automated video monitoring of unmarked and
marked honey bees at the hive entrance. Frontiers in
Computer Science, 3:142.
Romero-Ferrero, F., Bergomi, M. G., Hinz, R. C., Heras,
F. J. H., and Polavieja, G. G. d. (2019). idtracker.ai:
tracking all individuals in small or large collectives of
unmarked animals. Nature Methods, 16(2):179.
Sasaki, T., Granovskiy, B., Mann, R. P., Sumpter, D. J. T.,
and Pratt, S. C. (2013). Ant colonies outperform indi-
viduals when a sensory discrimination task is difficult
but not when it is easy. Proceedings of the National
Academy of Sciences, 110(34):13769–13773.
Schroff, F., Kalenichenko, D., and Philbin, J. (2015).
FaceNet: A Unified Embedding for Face Recognition
and Clustering. arXiv:1503.03832 [cs], pages 815–
823. arXiv: 1503.03832.
Smith, M. L., Davidson, J. D., Wild, B., Dormagen, D. M.,
Landgraf, T., and Couzin, I. D. (2022). Behavioral
variation across the days and lives of honey bees.
Iscience, 25(9):104842.
Stock, A., Gregr, E. J., and Chan, K. M. A. (2023).
Data leakage jeopardizes ecological applications of
machine learning. Nature Ecology & Evolution,
7(11):1743–1745. Number: 11 Publisher: Nature
Publishing Group.
Streit, S., Bock, F., Pirk, C. W., and Tautz, J. (2003). Au-
tomatic life-long monitoring of individual insect be-
haviour now possible. Zoology, 106(3):169–171.
Wang, H., Du, H., Zhao, Y., and Yan, J. (2020). A Com-
prehensive Overview of Person Re-Identification Ap-
proaches. IEEE Access, PP:1–1.
Identification of Honeybees with Paint Codes Using Convolutional Neural Networks
779
