
Beyond the Known: Adversarial Autoencoders in Novelty Detection
Muhammad Asad
1,2 a
, Ihsan Ullah
1,2 b
, Ganesh Sistu
3 c
and Michael G. Madden
1,2 d
1
Machine Learning Research Group, School of Computer Science, University of Galway, Ireland
2
Insight SFI Research Centre for Data Analytics, University of Galway, Ireland
3
Valeo Vision Systems, Tuam, Ireland
Keywords:
Anomaly Detection, Adversarial Auto-Encoders, Reconstruction, Discriminator, Distribution.
Abstract:
In novelty detection, the goal is to decide if a new data point should be categorized as an inlier or an outlier,
given a training dataset that primarily captures the inlier distribution. Recent approaches typically use deep
encoder and decoder network frameworks to derive a reconstruction error, and employ this error either to de-
termine a novelty score, or as the basis for a one-class classifier. In this research, we use a similar framework
but with a lightweight deep network, and we adopt a probabilistic score with reconstruction error. Our method-
ology calculates the probability of whether the sample comes from the inlier distribution or not. This work
makes two key contributions. The first is that we compute the novelty probability by linearizing the manifold
that holds the structure of the inlier distribution. This allows us to interpret how the probability is distributed
and can be determined in relation to the local coordinates of the manifold tangent space. The second contribu-
tion is that we improve the training protocol for the network. Our results indicate that our approach is effective
at learning the target class, and it outperforms recent state-of-the-art methods on several benchmark datasets.
1 INTRODUCTION
Novelty detection is one of the main challenges in
computer vision data analysis. Its aim is to distin-
guish whether a new data point aligns with typical
patterns (is an inlier) or deviates from them (is an out-
lier) (Almohsen et al., 2022). This task is challenging
because, while the inlier class is usually well char-
acterized, there is generally insufficient information
about the distribution of outliers. A related challenge
is that outliers are typically infrequent and in some
cases almost never observed, as seen in cases such
as industrial fault detection (Liu et al., 2018). The
significance of this methodology is not just confined
to one domain; it arises in many applications, from
medical diagnostics and drug discovery to computer
vision tasks (Pidhorskyi et al., 2018) such as anomaly
detection in images and videos. In these, it is impor-
tant to detect new or unexplained data points and to
respond to outliers. Detecting these outliers ensures
that models are efficient and can learn the variations
in the data.
a
https://orcid.org/0000-0002-6398-0320
b
https://orcid.org/0000-0002-7964-5199
c
https://orcid.org/0009-0003-1683-9257
d
https://orcid.org/0000-0002-4443-7285
In the area of computer vision, for instance, nov-
elty detection is instrumental for detecting outliers
(You et al., 2017), denoising images, and finding
anomalies in visual media. Authors see novelty de-
tection through the approach of one-class classifica-
tion (Sabokrou et al., 2018), an approach that works
well when negative classes are absent, less in number,
or uncertain. In this context, the negative class is a
novelty, outlier, or anomaly, while the positive class
is well characterized in the training data instances
(Bergadano, 2019; Zhang et al., 2016).
Modern novelty detection approaches are leverag-
ing the capabilities of deep learning. These advanced
techniques often take one of two paths: they either de-
velop a one-class classifier (Almohsen et al., 2022) or
utilize the reconstruction in encoder-decoder models
to deal with novelty (Ravanbakhsh et al., 2017).
In this research, we present an autoencoder archi-
tecture inspired by adversarial autoencoders. Unlike
existing methods that train a one-class classifier (Al-
mohsen et al., 2022), we focus on understanding the
probability distribution of inlier data points. This pro-
cess simplifies the task of novelty detection by check-
ing if those samples are less common or potential out-
liers. These samples are then confirmed as outliers
if they fall below a certain threshold, as discussed in
256
Asad, M., Ullah, I., Sistu, G. and Madden, M.
Beyond the Known: Adversarial Autoencoders in Novelty Detection.
DOI: 10.5220/0012459600003660
Paper published under CC license (CC BY-NC-ND 4.0)
In Proceedings of the 19th International Joint Conference on Computer Vision, Imaging and Computer Graphics Theory and Applications (VISIGRAPP 2024) - Volume 2: VISAPP, pages
256-265
ISBN: 978-989-758-679-8; ISSN: 2184-4321
Proceedings Copyright © 2024 by SCITEPRESS – Science and Technology Publications, Lda.
Pidhorskyi et al. (2018). In recent years, the work by
Pidhorskyi et al. (2018) has made a significant contri-
bution to the field of novelty detection. This method-
ology has been adopted widely (Zhou, 2022) because
of the manifold learning that captures the distribution
structure of inliers and by determining if a specific
sample is an anomaly by looking at its likelihood dis-
tribution.
Building upon the work in Pidhorskyi et al.
(2018), we have developed a method in which we
determine the probability distribution of the entire
model, which can cover both the signal and the noise.
Our main goal is novelty detection in images and
managing the latent space distribution by ensuring
that it can accurately represent the inlier distribution.
This is not just about generating good images; it is
also about getting an accurate novelty score. Many
studies in deep learning have focused on the recon-
struction error (Ionescu et al., 2019; Xia et al., 2015;
Pidhorskyi et al., 2018). We use that too, but in our
system, the reconstruction error is mainly related to
the noise from the reconstruction of the outliers. Af-
ter getting the latent distribution and improving the
image generation, we use an adversarial autoencoder
network with two discriminators. These discrimina-
tors help us tackle both challenges.
We named our approach Beyond the Known: Ad-
versarial Autoencoders in Novelty Detection as BK-
AAND. Our method has a unique advantage it allows
the decoder network to effectively learn and map out
the shape of the inlier distribution. This is done by
understanding the probability distribution of the la-
tent space. What makes our approach efficient is how
we handle the manifold for a given test sample. We
make it linear and show that, based on local manifold
coordinates, the data distribution splits into two parts.
One part is influenced by the manifold itself, which
includes the decoder network and latent distribution.
The other part is influenced by the reconstruction er-
ror. While we do take advantage of that, our frame-
work shows that the reconstruction error only influ-
ences the noise part of the model.
Our main contributions include:
• Introducing a lightweight approach based on com-
puting the loss and probability distribution for
both inliers and the entire model (Section 3).
• Evaluating our model on a variety of datasets,
each with different outlier percentages, ensuring
its performance across different scenarios.
• Performing a comparative analysis with state-of-
the-art techniques in the field (Section 5), using
AUC and F
1
score.
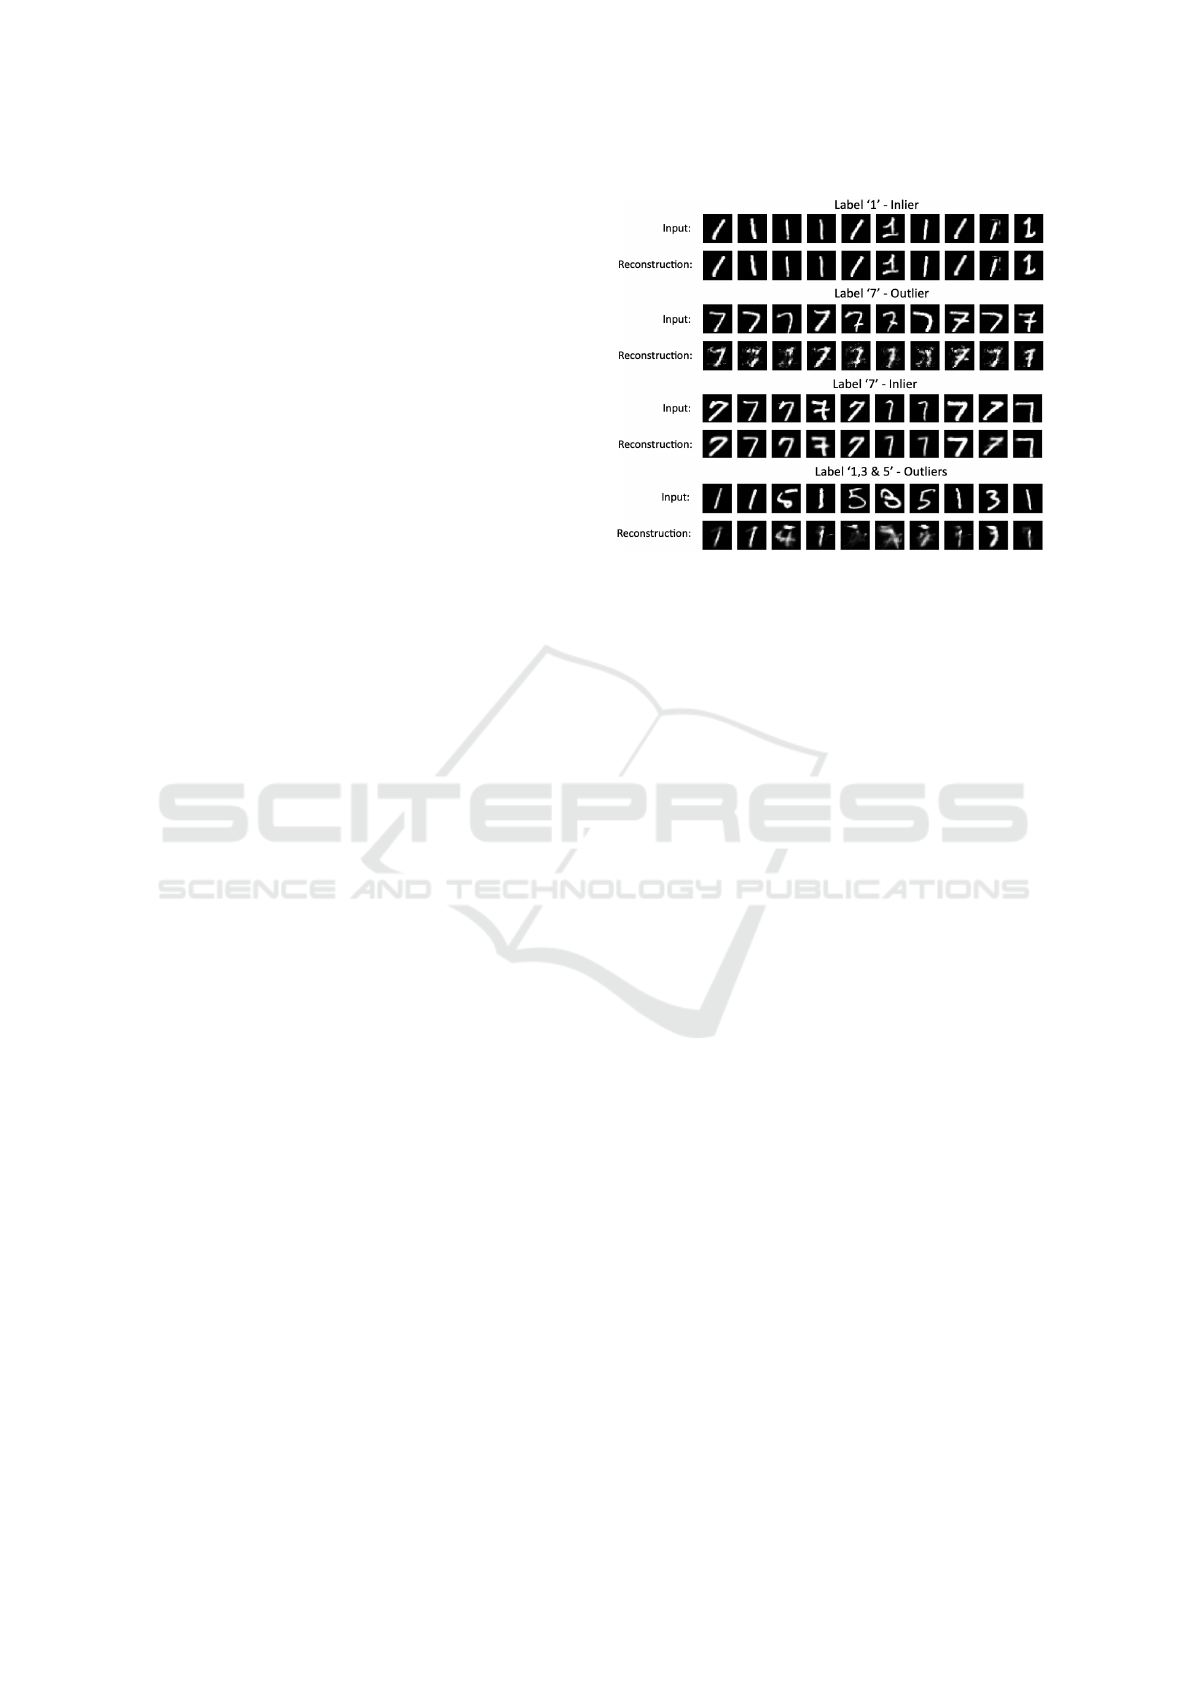
Figure 1: Illustration of reconstructions of inliers and out-
liers on MNIST images. The figure displays the reconstruc-
tions generated by the autoencoder network, which was ini-
tially trained on data labeled ”1” in MNIST (LeCun, 1998).
The first row represents the input images of the inliers with
the label ’1’, while the second row shows their respective
reconstructions. Meanwhile, the third row displays input
images of outliers with the label ’7’, and the fourth row
presents the corresponding reconstructions and so on. For a
fair comparison, similar digits are considered.
In Section 2, related studies and literature are dis-
cussed. Section 3 outlines our methodology and the
framework. Section 4 details the experiments we con-
ducted. The results we obtained are discussed in Sec-
tion 5. Our final thoughts and conclusions based on
the findings are presented in Section 6.
2 RELATED WORK
Anomaly detection can be addressed as a novelty
detection problem, as done in many research stud-
ies (Liu et al., 2018; Zhang et al., 2016; Luo et al.,
2017; Hinami et al., 2017; Xia et al., 2015; Sultani
et al., 2018; Sabokrou et al., 2018; Bergadano, 2019;
Hasan et al., 2016; Smeureanu et al., 2017; Ravan-
bakhsh et al., 2018, 2017). The goal is to train a
model on recognized normal data and then identify
unknown data/outliers as anomalies. With the rise of
deep learning approaches, there have been sugges-
tions (Smeureanu et al., 2017; Ravanbakhsh et al.,
2017) to use the pre-trained convolutional network
features for the training of one-class classifiers. The
effectiveness of these approaches mostly relies on the
foundational model, which is frequently trained on
unrelated datasets (Sabokrou et al., 2018).
More recent developments in this area use gener-
ative networks to learn features, as discussed in var-
ious studies (Liu et al., 2023; Zhou and Xing, 2023;
Beyond the Known: Adversarial Autoencoders in Novelty Detection
257
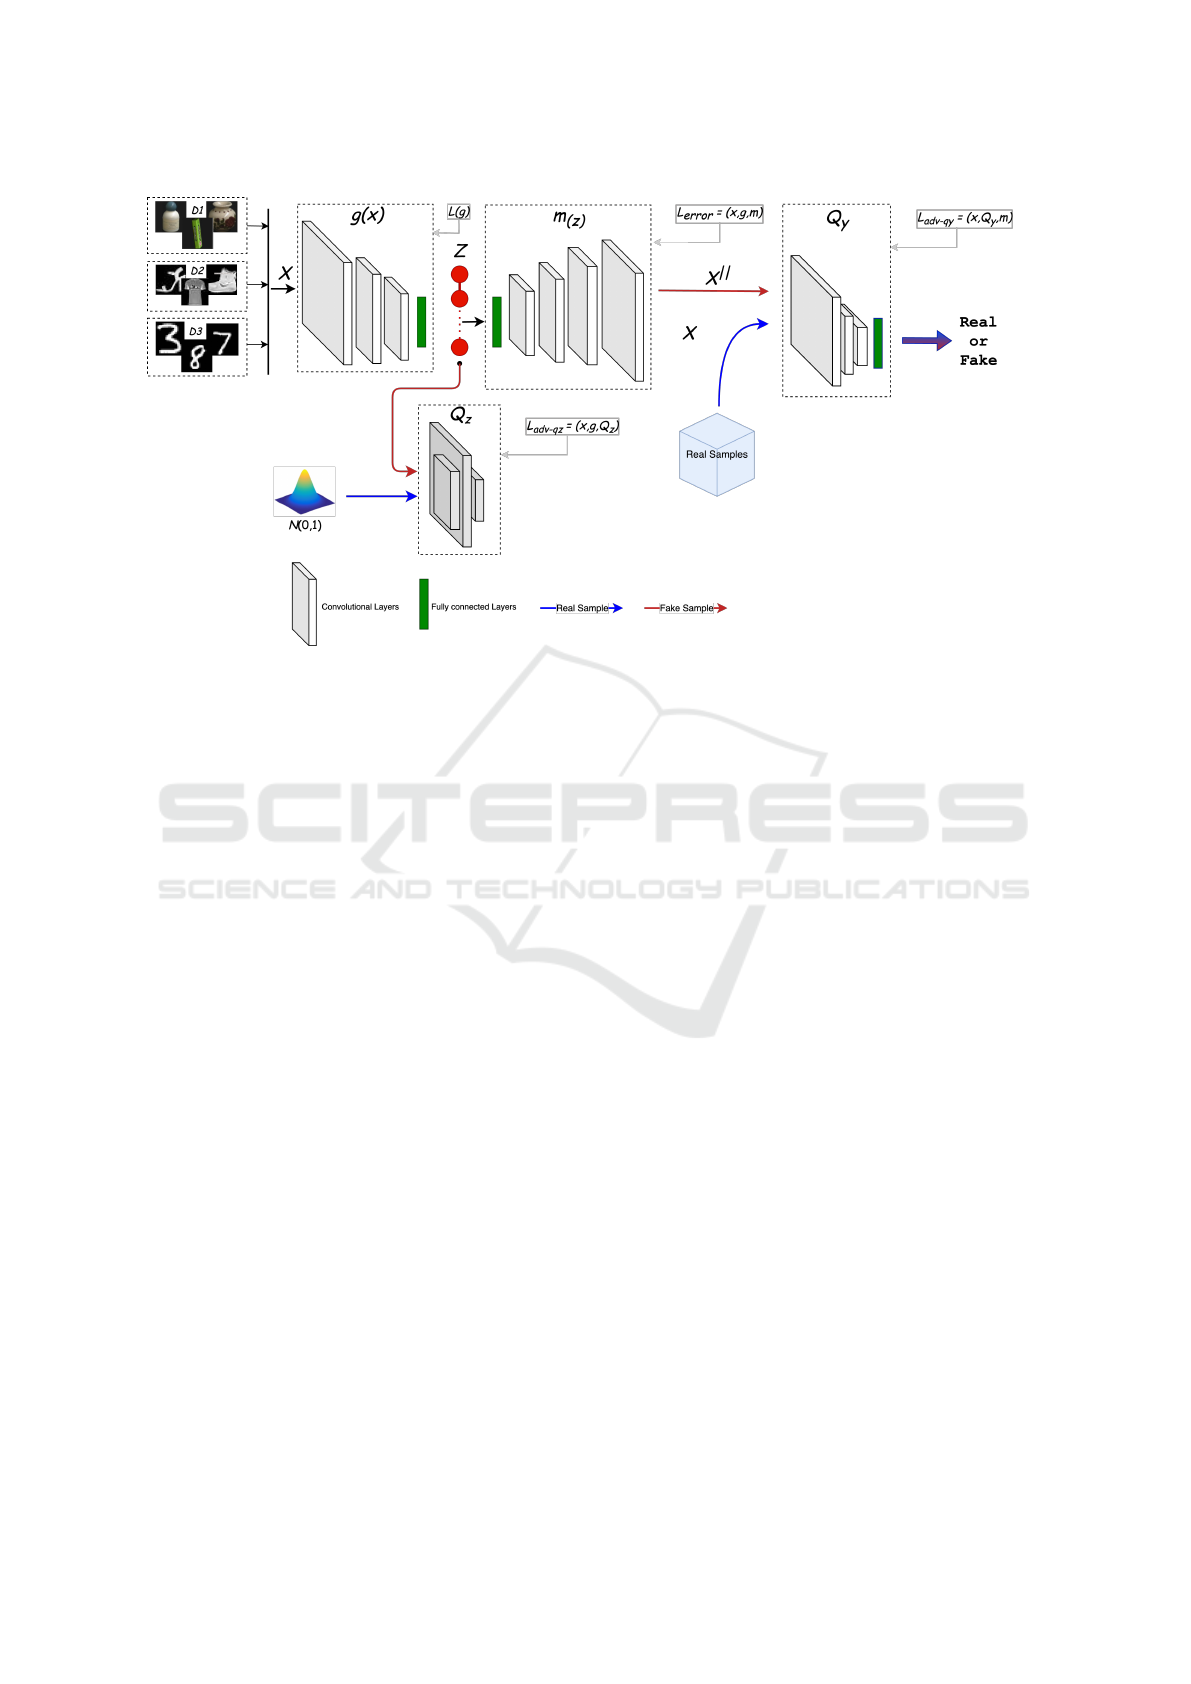
Figure 2: Framework of the BK-AAND network. The network is designed to train an Adversarial Autoencoder (AAE)
(Sabokrou et al., 2018, 2017). In line with previous works (Almohsen et al., 2022; Pidhorskyi et al., 2018), it adds an
additional adversarial component that enhances the generative capabilities of images that are decoded and then improves the
manifold learning.
Gong et al., 2019; Ren et al., 2015; Xu et al., 2015;
Ionescu et al., 2019; Xu et al., 2017; Sabokrou et al.,
2018). Specifically, Ionescu et al. (2019) suggested
using convolutional auto-encoders that are combined
with object detection to learn both motion and ap-
pearance representations. Several studies (Yamanishi
et al., 2000; Humbert et al., 2022; Jiang et al., 2022)
utilize statistical techniques to better understand and
capture the common patterns within data. They create
models based on these patterns and anything that de-
viates significantly from these models is considered
unusual or as an outlier. Essentially, these methods
learn from the usual trends and patterns in the data
and then point out the rare occurrences that do not
follow the trend.
Some authors (Xu et al., 2022; Angiulli et al.,
2020; Wang et al., 2022) use a different approach,
instead of modeling the usual patterns, they look
at the distances between data points. They believe
that normal data points tend to cluster together, while
outliers are more isolated, maintaining greater dis-
tances from these clusters. The LOF method (Breunig
et al., 2018) deals with this by determining the density
around a data point. If a point is surrounded by sev-
eral other points, it is considered normal. However, if
it is isolated from others, it is flagged as an outlier.
Another method called the Kernel Null Foley-
Sammon Transform (KNFST) (Bodesheim et al.,
2013) is an approach where data from known cate-
gories is presented into singular representative points.
When new data is introduced, its difference from
these points determines its novelty or how unusual it
is. This means that if a new data point is far from
any known category point, it is seen as more novel.
Building on these methods, Liu et al. (2017) intro-
duced the Incremental Kernel Null Space Based Dis-
criminant Analysis (IKNDA). This method refines the
process by analyzing the data, potentially making the
detection of outliers more efficient and accurate.
Outliers are data points that do not follow the
usual pattern. To find these outliers, some studies (Al-
mohsen et al., 2022; Chen et al., 2023) use a method
called self-representation, where data is divided into
smaller groups or subspaces. Some studies (Hasan
et al., 2016; Xu et al., 2017) use autoencoders to
model what normal data looks like and then detect if
any data that looks different.
GANs (Goodfellow et al., 2014) are also used
by researchers for anomaly detection. For example,
Wang et al. (2018) created new data that looks like the
usual data. By doing this, they were able to measure
how different each data point was from the usual pat-
tern. Another study (Zhang et al., 2016) used GANs
but focused on videos. A study conducted by Ionescu
et al. (2019) trains a model to reconstruct noisy data
by cleaning out the different ones, making the normal
data stand out even more. In Sabokrou et al. (2018),
a two phase framework was introduced for one-class
classification and novelty detection. In first phase a
network is trained to accurately reconstruct inliers.
VISAPP 2024 - 19th International Conference on Computer Vision Theory and Applications
258

Figure 3: Illustration of reconstruction of outliers on Coil-
100 images. The figure displays the reconstructions gener-
ated by the autoencoder network, which was initially trained
on one image. The first row represents the input images of
the outliers, while the second row shows their respective re-
constructions.
Whereas, in the second phase the other component
is a one-class classifier, which utilizes a separate net-
work to determine the novelty score of the data.
Recent studies (Li et al., 2021; Kendall and Gal,
2017; DeVries and Taylor, 2018; Liang et al., 2017)
have worked into identifying out-of-distribution sam-
ples, essentially trying to find data that does not fit the
usual distribution. They do this by finding the out-
put entropy. One approach is to set a threshold for
the softmax score, that helps in classification (Kendall
and Gal, 2017). An advanced technique, known as
ODIN (Liang et al., 2017), first changes the input
data, which is adjusted through the gradients with re-
spect to the input. Following this, ODIN combines
the softmax score with scaling to enhance its detec-
tion capabilities.
While these strategies are promising, they rely on
having labels for the regular, or in-distribution, data to
help the training of the classifier networks. This could
be a limitation in situations, where such labels might
be sparse or entirely absent.
3 METHODOLOGY
In this section, we provide an overview of our network
architecture and the training methodology employed
to learn the mapping functions f and g as shown in
Figure 2. These mappings, g and f , are modeled us-
ing an autoencoder network. Our approach is based
on previous novelty detection works (Almohsen et al.,
2022; Pidhorskyi et al., 2018), which relies on the use
of autoencoders (Rumelhart et al., 1986).
The primary objective in designing the autoen-
coder network and training procedure is to ensure that
it captures the details of the underlying manifold M.
For instance, if M represents the distribution of im-
ages representing a specific object category, our aim
is that the encoder and decoder should generate im-
ages that closely resemble the actual distribution. We
introduce the latent space, denoted as z (Pidhorskyi
et al., 2018), which should closely match a predefined
distribution, preferably a normal distribution with a
mean of 0 and a standard deviation of 1, denoted as
N(0, 1). Furthermore, we seek to make each com-
ponent of z maximally informative, so that they be-
have as independent random variables. This condi-
tion greatly facilitates the learning of a distribution
p
Z
(z) from training data mapped onto the latent space
z. Also, the autoencoder has generative capabilities,
allowing us to generate data points x ∈ M by sampling
from p
Z
(z). This distinguishes our approach from
Generative Adversarial Networks (GANs) (Goodfel-
low et al., 2014). Importantly, we also incorporate an
encoder function g.
Variational Autoencoders (VAEs) (Kingma and
Welling, 2013) have demonstrated their efficacy in
handling continuous latent variables and generating
data from a randomly sampled latent space. In con-
trast, Adversarial Autoencoders (AAEs) (Rumelhart
et al., 1986) utilize an adversarial training paradigm
to align the following distribution of the latent space
with a specified distribution. A notable advantage of
AAEs over VAEs is their ability to make the encoder
match the entire prior distribution.
When dealing with images, both AAEs and VAEs
often generate samples that deviate from the actual
manifold (Pidhorskyi et al., 2018). This occurs be-
cause the decoder is updated based on a reconstruc-
tion loss, typically calculated as pixel-wise cross-
entropy between the input and output images. This
loss function tends to produce blur images, which can
have adverse effects on our proposed approach. Simi-
lar to AAEs, PixelGAN autoencoders (Makhzani and
Frey, 2017) also introduce an additional adversarial
component in order to impose the prior distribution
on latent space.
Following the methodology of previous studies
(Pidhorskyi et al., 2018; Sabokrou et al., 2018, 2017),
we introduce an additional adversarial training crite-
rion that compares the output of the decoder network
with the distribution of real data. It reduces the blur-
riness and enhances the local details of the generated
images. We also introduce the different loss functions
that calculate the losses for all the network compo-
nents.
Our complete objective consists of three key com-
ponents. Firstly, we calculate an adversarial loss
through Q
z
discriminator, to match the latent space
distribution with the predefined prior distribution,
typically a standard normal distribution with a mean
of 0 and a standard deviation of 1, denoted as N(0, 1).
Secondly, adversarial loss from the distribution of de-
coded images is obtained from z with the already-
known distribution of training data i.e., inliers. Fi-
nally, autoencoder loss is used to quantify the dissim-
ilarity between the decoded images and the original
encoded input image using Q
z
discriminator. Figure 2
Beyond the Known: Adversarial Autoencoders in Novelty Detection
259

provides an illustration of our network configuration.
3.1 Adversarial Losses
For the discriminator Q
z
, the adversarial loss is de-
fined as:
L
adv-qz
(x, g, Q
z
) = E [log(Q
z
(N (0, 1)))]
+ E [log(1 − Q
z
(g(x)))] (1)
The objective of the encoder g is to represent x
in z in such a way that its distribution closely mirrors
N(0, 1). Q
z
purpose is to differentiate between the en-
codings created by g and a standard normal distribu-
tion. In this adversarial setting, while g aims to reduce
the value of this objective, Q
z
enhances it. Likewise,
the adversarial loss associated with the discriminator
Q
y
is:
L
adv-qy
(x, Q
y
,m) = E [log (Q
y
(x))]
+ E [log (1 − Q
y
(m(N (0, 1))))]
(2)
Here the decoder m has the goal of generating x
from a standard normal distribution, N(0,1), such that
x appears as though it was drawn from the original
distribution. Q
y
role is to observe between the data
points reconstructed by m and original data points x.
In this way, m strives to reduce the objective function,
whereas Q
y
works to increase it.
3.2 Autoencoder Loss
For the combined optimization of encoder g and de-
coder m, the goal is to reduce the error for the input
x that originates from an already-known data distribu-
tion. The error is defined as:
L
error
(x, g, m) = −E
z
[log(p(m(g(x))|x))] (3)
Here, L
error
represents the negative expected log-
likelihood, commonly known as the reconstruction er-
ror. Even though this loss lacks an adversarial aspect,
it is used for autoencoder training. By reducing this
loss, the functions g and m are considered accurate for
the approximation of the original data.
3.3 Combined Loss Function
By combining all the previously mentioned loss func-
tions, the total loss is formulated as:
L(x,g,Q
z
,Q
y
,m) = L
adv-qz
(x, g, Q
z
)
+ L
adv-qy
(x, Q
y
,m)
+ βL
error
(x, g, m) (4)
Figure 4: The t-SNE visualization of inlier (digit 7) and out-
liers (digits 1, 3, 5) classes. Each point represents a digit,
and the colors distinguish between inliers and outliers. The
visualization shows the distinct clusters formed in reduced
two-dimensional space, offering insights into their latent
representations. This visualization also shows a clear dif-
ference in the distribution to validate our experiments.
Here, β is a tuning parameter, that makes the re-
lationship between the reconstruction loss and other
losses. The autoencoder’s optimal configuration is
derived by minimizing the above equation, which
yields:
(g
∗
,m
∗
) = argmin
g,m
max
Q
y
,Q
z
L(x,g,Q
z
,Q
y
,m) (5)
For the training process via stochastic gradient de-
scent, each component is alternately updated:
• Q
y
weights are updated to maximize L
adv-qy
• m weights are optimized to minimize L
adv-qy
• Q
z
weights are updated to maximize L
adv-qz
• Both g and m weights are optimized to minimize
L
error
and L
adv-qz
4 EXPERIMENTS
Here, we present the assessment of our BK-AAND
framework using three distinct datasets. The selection
of these datasets is motivated by literature. We also
provide an in-depth performance analysis and com-
pare it to leading-edge methods. Moreover, we offer
comprehensive discussions to demonstrate the robust-
ness and importance of our proposed approach.
VISAPP 2024 - 19th International Conference on Computer Vision Theory and Applications
260
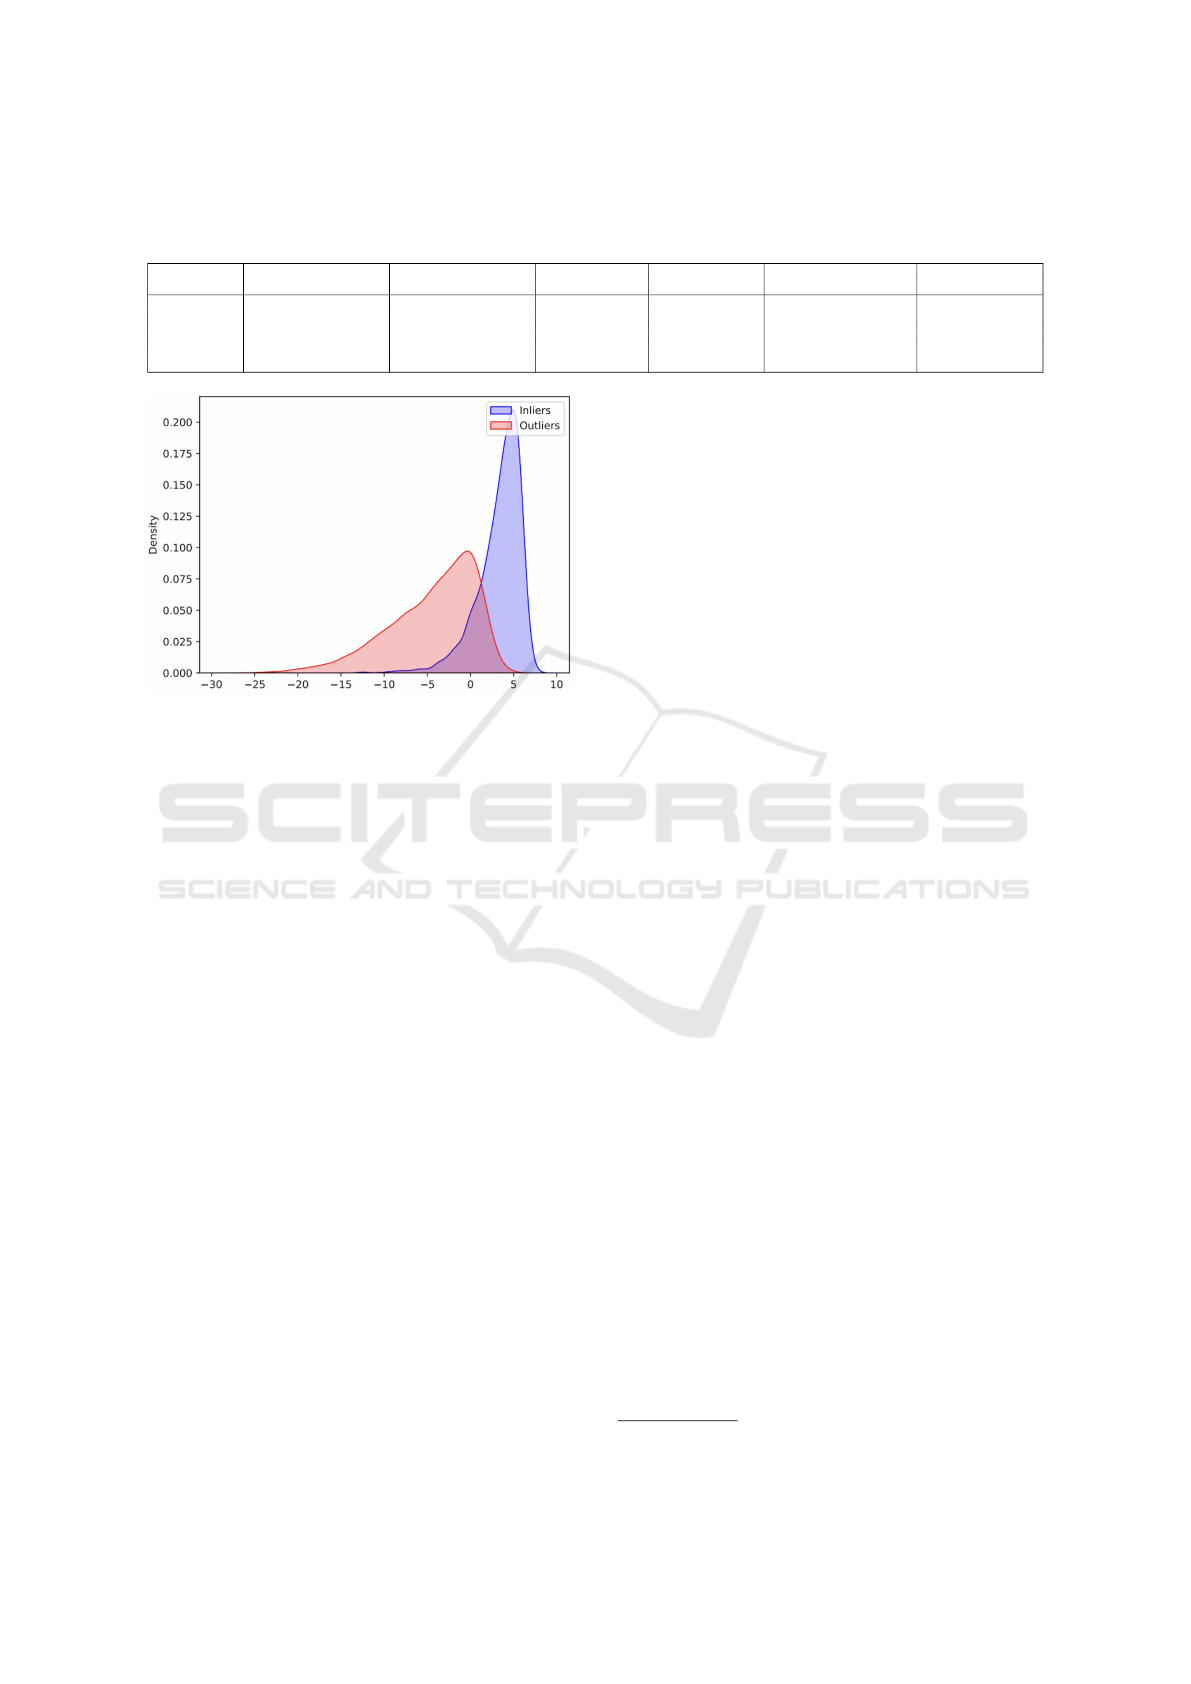
Table 1: Comparison of F1 scores with prior research on MNIST (LeCun, 1998). The inliers consist of images from a single
category, while outliers are randomly selected from the remaining categories. Our results are shown in bold outperforming
previous works.
% of outliers D(R(X ))
D(R(X ))
D(R(X )) D(X )
D(X )
D(X ) LOF DRAE GPND (Base) BK-AAND (Ours)
(Sabokrou et al., 2018) (Sabokrou et al., 2018) (Xia et al., 2015) (You et al., 2017) (Pidhorskyi et al., 2018)
10 0.97 0.93 0.92 0.95 0.98 0.989
20 0.92 0.90 0.83 0.91 0.97 0.985
30 0.92 0.87 0.72 0.88 0.96 0.980
40 0.91 0.84 0.65 0.82 0.95 0.976
50 0.88 0.82 0.55 0.73 0.94 0.972
Figure 5: This image illustrates a Probability Density Func-
tion (PDF) plot on the MNIST dataset, providing a visual
representation of the distribution of data. The peaks in the
plot indicate the likelihood of different values occurring in
the dataset. Inliers (seven categories of images), represent-
ing typical or expected data points, are depicted by the main
body of the distribution, while outliers, which deviate sig-
nificantly from the norm, stand out as distinct points in sep-
arate peaks.
4.1 Datasets
We conducted our experiments using three widely
used datasets: MNIST (LeCun, 1998), Coil-100
(Nene et al., 1996), and Fashion MNIST (Xiao et al.,
2017). They are represented by D1,D2 and D3 in Fig-
ure 2.
MNIST. This dataset features handwritten digits from
0 to 9. Which is made up of 60,000 training images
and 10,000 test images. These grayscale images have
a size of 28x28 pixels. In our experiments, each of
the ten categories is treated as inlier, while all other
categories act as outliers.
Coil-100. This dataset captures 100 objects with 72
images per object, totaling 7,200 images. For our
tests, we randomly choose n categories n ∈ {1, 4,7}
(Almohsen et al., 2022; Pidhorskyi et al., 2018) as in-
liers, and the remaining categories are treated as out-
liers.
Fashion-MNIST. This is a dataset of similar size,
scale and format to MNIST, but for a different do-
main. The dataset contains 60,000 training images
and 10,000 test images. The images are sized at
28x28 pixels in grayscale, and are in 10 classes cor-
responding to different fashion item categories (types
of clothing/footwear).
4.2 Evaluation Metrics
We assess the effectiveness of our novelty detection
methodology using two metrics, the F
1
score and
the Area Under the Receiver Operating Characteris-
tic curve (AUROC), which are widely used in related
work (Chen et al., 2023; Li et al., 2021; Almohsen
et al., 2022; Wang et al., 2022; Angiulli et al., 2020).
All results presented can be requested from our im-
plementation
1
, which is coded in the advanced deep
learning framework, PyTorch (Paszke et al., 2017).
4.3 Parameters and Implementation
Details
For the execution of experiments, we used two differ-
ent machines. The first machine is a MacBook Pro
2023 with an M2 processor, equipped with an 8-core
CPU, 24 GB of RAM, a 10-core GPU, and a 16-core
neural engine specifically designed for deep learning
computations. The second machine is a desktop with
an NVIDIA GeForce 2080 Ti GPU and 24 GB of
RAM.
Datasets were consistently partitioned into 5-
folds. We adopted a base learning rate of 0.002, with
80 epochs. For our experiments, a batch size of 128
was chosen, while the latent size was set at 16. To
rigorously evaluate the robustness of our method, we
introduced varying outlier percentages to the dataset:
10%, 20%, 30%, 40%, and 50%. Specifically for the
Coil-100 dataset, we further extended our outlier tests
to include 15% and 25% in order to align our findings
with previous research for comparative validity.
Other hyper-parameter details were kept the same
as in Pidhorskyi et al. (2018). To ensure a fair
and consistent comparative analysis, hyperparameters
were kept the same as per specifications in related
works.
1
https://github.com/asad-python/BK-AAND
Beyond the Known: Adversarial Autoencoders in Novelty Detection
261
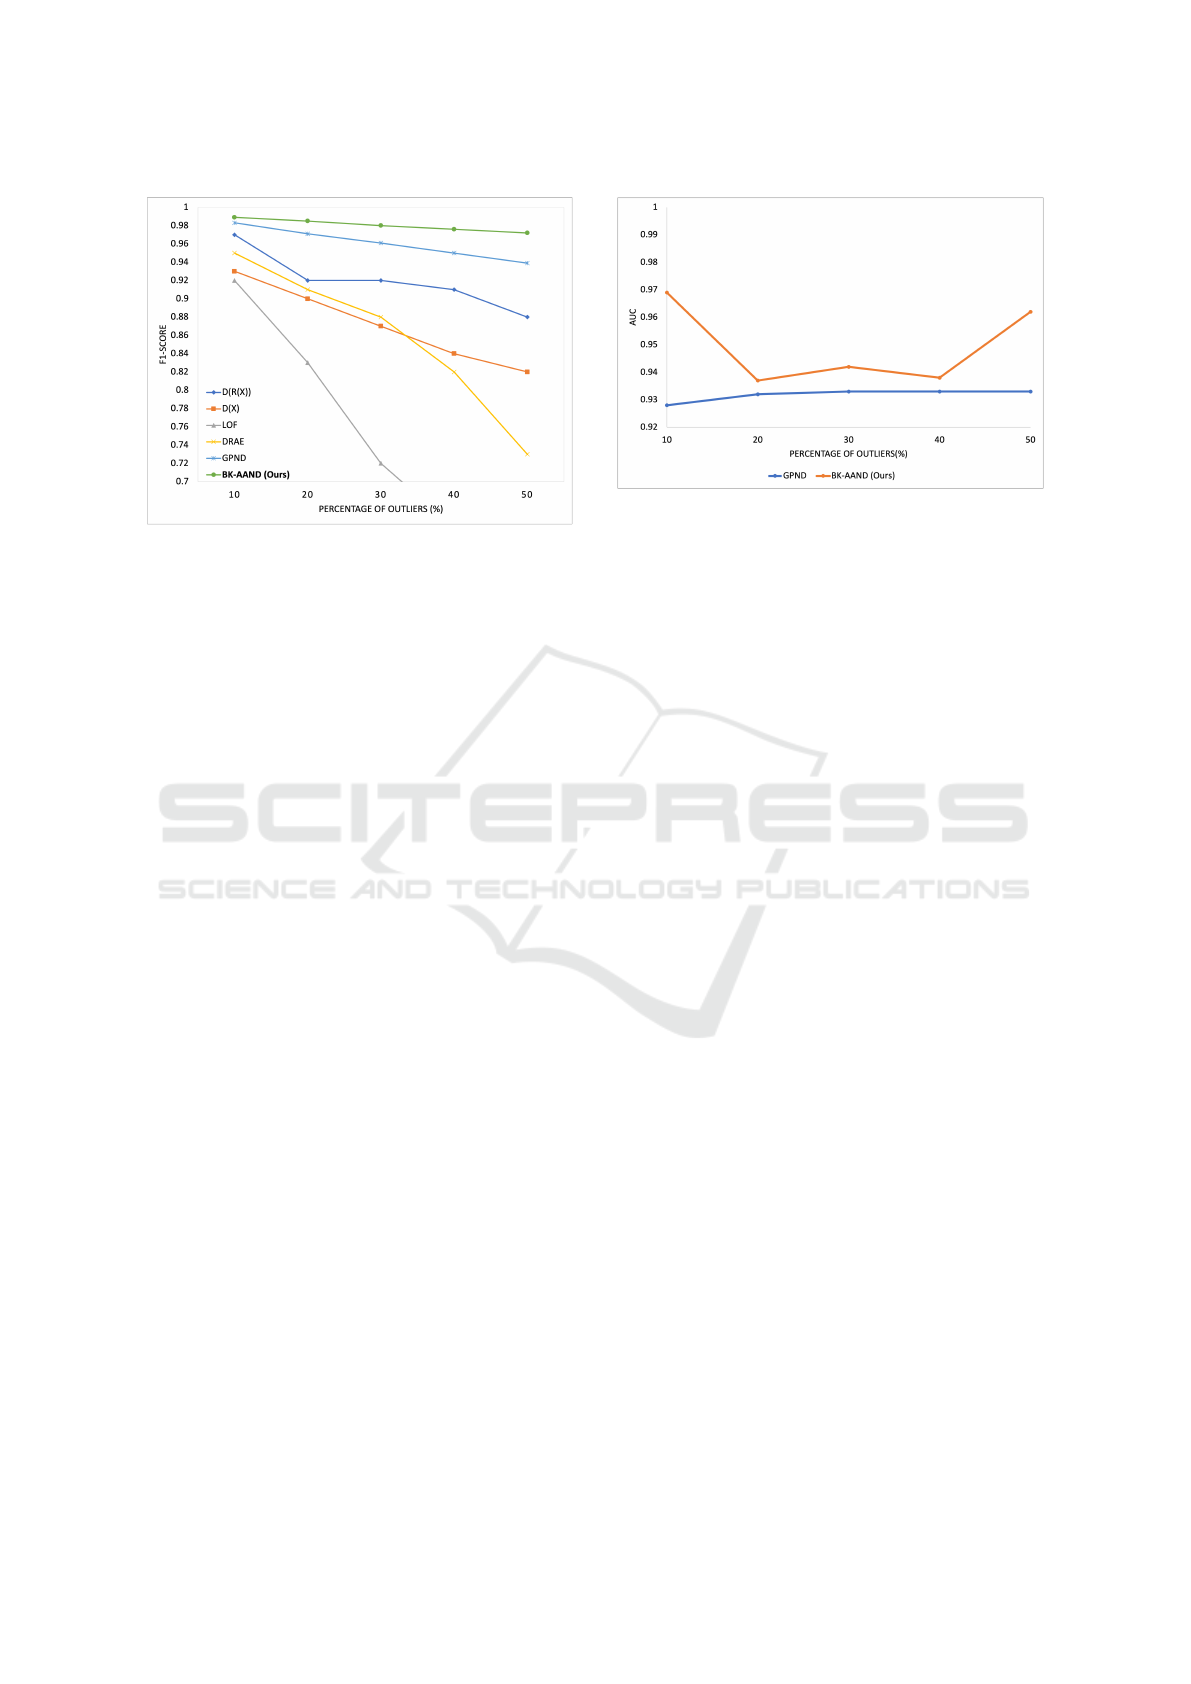
Figure 6: Comparison of results on MNIST (LeCun, 1998)
dataset with previous literature. Images from a single cat-
egory serve as inliers, while outliers are randomly selected
from different categories.
5 RESULTS
We have evaluated our framework on three different
datasets, varying the percentages of outliers. This sec-
tion provides a detailed discussion on the results.
5.1 MNIST Dataset
We adopt a methodology close to the one described
in Sabokrou et al. (2018) and Pidhorskyi et al. (2018),
adding several distinct modifications. Our outcomes
derive from the mean of 5-fold cross-validation,
wherein each fold has 20% of every class. For every
digit class, our model undergoes training, with out-
liers introduced by randomly selecting images from
alternate categories, their proportion varying between
10% to 50%. Compared to the approach in Sabokrou
et al. (2018), where data is not segmented into discrete
training, validation, and testing sets, we take a differ-
ent approach. Specifically, we avoid using the same
inliers for both training and testing, fixing to a 60%,
20%, and 20% division for the training, validation,
and test sets. The results on the MNIST dataset are
shown in Table 1, comparison with other approaches
(Breunig et al., 2018; Sabokrou et al., 2018; Pid-
horskyi et al., 2018; Xia et al., 2015) in Figure 6.
Reconstruction of inliers and outliers is visually rep-
resented in Figure 1 for better comparison. Results
show that our approach is performing better than pre-
vious studies when tested on different percentages of
outliers. The t-SNE visualization in Figure 4 and PDF
plot in Figure 5 is also illustrated to validate the dis-
tribution of the data and predictions.
Figure 7: Comparison of results on Fashion-MNIST with
GPND (Pidhorskyi et al., 2018). Single categories of im-
ages are considered at inliers and for outliers, we randomly
choose the categories as in GPND.
5.2 Coil-100 Dataset
We followed the method in Pidhorskyi et al. (2018)
with a few changes related to the percentages of the
outliers. Our results are an average from the 5-fold
cross-validation. In this process, 20% of each group
(class) is tested. Since there are not many samples in
each group, we train with 80% and test with 20%. The
study in You et al. (2017) did not separate their data
for training, validating, and testing. They did not need
to because they used a special network called VGG
(Simonyan and Zisserman, 2014) that was already
trained with ImageNet (Russakovsky et al., 2015) as
discussed in Pidhorskyi et al. (2018). Unlike them,
we did not reuse some parts (inliers) and stuck to us-
ing 80% for training and 20% for testing.
Reconstruction of outliers is shown in Figure 3.
Our results for Coil-100 are in Table 2. We did not do
better than R-graph (You et al., 2017) in a few cases
i.e.,15% of outliers. But it is important to remember
that R-graph worked with a VGG network that was
already trained. We started from scratch and trained
a system (BK-AAND) using a very small amount of
data i.e., 70 samples for each group.
5.3 Fashion-MNIST Dataset
For this dataset, we have repeated the same experi-
ments with the same protocol that is used for MNIST.
Please refer to 5.1 for the experimental setup. Table
3 shows the results achieved on this Fashion-MNIST.
Moreover, the comparison with the base GPND pa-
per (Pidhorskyi et al., 2018) is also provided in Figure
7. We have compared GPND on different numbers of
percentages and it can be seen that it outperforms the
base model on all those percentages of outliers.
VISAPP 2024 - 19th International Conference on Computer Vision Theory and Applications
262

Table 2: Results on Coil-100 dataset, inliers consist of images randomly selected from the 1,4 or 7 categories, while the
outliers are chosen randomly from categories not included in the set of inliers, at most one outlier from each category
Methods Inliers: One category of im-
ages, Outliers: 50%
Inliers: Four category of
images, Outliers: 25%
Inliers: Seven category of
images,Outliers: 15%
AUC F1 AUC F1 AUC F1
OutRank (Moonesinghe and Tan, 2008) 0.836 0.862 0.613 0.491 0.570 0.342
CoP (Rahmani and Atia, 2017) 0.843 0.866 0.628 0.500 0.580 0.346
REAPER (Lerman et al., 2015) 0.900 0.892 0.877 0.703 0.824 0.541
OutlierPursuit (Xu et al., 2010) 0.908 0.902 0.837 0.686 0.822 0.528
LRR (Liu et al., 2010) 0.847 0.872 0.687 0.541 0.628 0.366
DPCP (Tsakiris and Vidal, 2015) 0.900 0.882 0.859 0.684 0.804 0.511
ℓ
1
thresholding (Soltanolkotabi and Candes, 2012) 0.991 0.978 0.992 0.941 0.991 0.897
R-graph (You et al., 2017) 0.997 0.990 0.996 0.970 0.996 0.955
GPND (Pidhorskyi et al., 2018) 0.968 0.979 0.945 0.960 0.919 0.941
BK-AAND (Ours) 0.998 0.957 0.997 0.972 0.844 0.929
Table 3: Fashion-MNIST (Xiao et al., 2017) results, where inliers are from the images of a single category, and we chose
outliers from other random categories.
% of Outliers 10 20 30 40 50
AUC 0.968 0.937 0.942 0.937 0.962
F1 0.97 0.942 0.918 0.889 0.927
6 CONCLUSIONS
6.1 Key Findings
We proposed BK-AAND, an approach along with
a network structure for novelty detection. This is
designed around deriving mappings f and g which
presents the parameterized manifold M. This man-
ifold captures the structure of the inlier distribution.
Compared with existing deep learning methodolo-
gies, BK-AAND identifies outliers by considering
their inlier probability distribution and reconstruction
loss. Moreover, despite its simple design, our ap-
proach has been demonstrated to deliver outperform-
ing results across different metrics, datasets, and pro-
tocols. The outcomes from multiple datasets indicate
that our suggested approach can identify samples out-
side the target class (meaning they’re novel, outliers,
or anomalies), despite the absence of such samples
in the training phase. Through extensive testing, we
found that our method consistently produces reliable
outcomes over numerous training epochs and outper-
forms various state-of-the-art techniques (Almohsen
et al., 2022; Chen et al., 2023; Pidhorskyi et al., 2018;
Sabokrou et al., 2018; Xia et al., 2015; You et al.,
2017; Xu et al., 2010; Moonesinghe and Tan, 2008;
Lerman et al., 2015; Rahmani and Atia, 2017; Liu
et al., 2010; Breunig et al., 2018; Tsakiris and Vi-
dal, 2015; Soltanolkotabi and Candes, 2012), in de-
tecting novelties. Moreover, our model is lightweight
because it has fewer parameters, a simple shallow ar-
chitecture, and low memory needs.
6.2 Future Directions
In future work, we hope to train and evaluate our
method on large scale datasets. We also intend to per-
form a statistical comparison of the execution time to
support the efficiency of our lightweight model.
ACKNOWLEDGEMENTS
This research is conducted with the financial support
of Science Foundation Ireland under Grant number
18/CRT/6223, partnered with Valeo.
REFERENCES
Almohsen, R., Keaton, M. R., Adjeroh, D. A., and Doretto,
G. (2022). Generative probabilistic novelty detection
with isometric adversarial autoencoders. In Proceed-
ings of the IEEE/CVF Conference on Computer Vision
and Pattern Recognition, pages 2003–2013.
Angiulli, F., Basta, S., Lodi, S., and Sartori, C. (2020). Re-
ducing distance computations for distance-based out-
liers. Expert Systems with Applications, 147:113215.
Bergadano, F. (2019). Keyed learning: An adversar-
ial learning framework—formalization, challenges,
and anomaly detection applications. ETRI Journal,
41(5):608–618.
Bodesheim, P., Freytag, A., Rodner, E., Kemmler, M., and
Denzler, J. (2013). Kernel null space methods for
novelty detection. In Proceedings of the IEEE con-
ference on computer vision and pattern recognition,
pages 3374–3381.
Breunig, M. M., Kriegel, H.-P., Ng, R. T., and Sander, J.
(2018). Lof: identifying density-based local outliers.
Beyond the Known: Adversarial Autoencoders in Novelty Detection
263

In Proceedings of the 2000 ACM SIGMOD interna-
tional conference on Management of data, pages 93–
104.
Chen, Y., Cheng, L., Hua, Z., and Yi, S. (2023). Lapla-
cian regularized deep low-rank subspace clustering
network. Applied Intelligence, pages 1–15.
DeVries, T. and Taylor, G. W. (2018). Learning confidence
for out-of-distribution detection in neural networks.
arXiv preprint arXiv:1802.04865.
Gong, D., Liu, L., Le, V., Saha, B., Mansour, M. R.,
Venkatesh, S., and Hengel, A. v. d. (2019). Memoriz-
ing normality to detect anomaly: Memory-augmented
deep autoencoder for unsupervised anomaly detec-
tion. In Proceedings of the IEEE/CVF International
Conference on Computer Vision, pages 1705–1714.
Goodfellow, I., Pouget-Abadie, J., Mirza, M., Xu, B.,
Warde-Farley, D., Ozair, S., Courville, A., and Ben-
gio, Y. (2014). Generative adversarial nets. Advances
in neural information processing systems, 27.
Hasan, M., Choi, J., Neumann, J., Roy-Chowdhury, A. K.,
and Davis, L. S. (2016). Learning temporal regularity
in video sequences. In Proceedings of the IEEE con-
ference on computer vision and pattern recognition,
pages 733–742.
Hinami, R., Mei, T., and Satoh, S. (2017). Joint detection
and recounting of abnormal events by learning deep
generic knowledge. In Proceedings of the IEEE inter-
national conference on computer vision, pages 3619–
3627.
Humbert, P., Le Bars, B., and Minvielle, L. (2022). Robust
kernel density estimation with median-of-means prin-
ciple. In International Conference on Machine Learn-
ing, pages 9444–9465. PMLR.
Ionescu, R. T., Khan, F. S., Georgescu, M.-I., and Shao,
L. (2019). Object-centric auto-encoders and dummy
anomalies for abnormal event detection in video. In
Proceedings of the IEEE/CVF Conference on Com-
puter Vision and Pattern Recognition, pages 7842–
7851.
Jiang, X., Liu, J., Wang, J., Nie, Q., Wu, K., Liu, Y.,
Wang, C., and Zheng, F. (2022). Softpatch: Unsu-
pervised anomaly detection with noisy data. Advances
in Neural Information Processing Systems, 35:15433–
15445.
Kendall, A. and Gal, Y. (2017). What uncertainties do we
need in bayesian deep learning for computer vision?
Advances in neural information processing systems,
30.
Kingma, D. P. and Welling, M. (2013). Auto-encoding vari-
ational bayes. arXiv preprint arXiv:1312.6114.
LeCun, Y. (1998). The mnist database of handwritten digits.
http://yann. lecun. com/exdb/mnist/.
Lerman, G., McCoy, M. B., Tropp, J. A., and Zhang, T.
(2015). Robust computation of linear models by con-
vex relaxation. Foundations of Computational Math-
ematics, 15:363–410.
Li, W., Huang, X., Lu, J., Feng, J., and Zhou, J.
(2021). Learning probabilistic ordinal embeddings for
uncertainty-aware regression. In Proceedings of the
IEEE/CVF conference on computer vision and pattern
recognition, pages 13896–13905.
Liang, S., Li, Y., and Srikant, R. (2017). Enhancing the reli-
ability of out-of-distribution image detection in neural
networks. arXiv preprint arXiv:1706.02690.
Liu, G., Lin, Z., and Yu, Y. (2010). Robust subspace seg-
mentation by low-rank representation. In Proceed-
ings of the 27th international conference on machine
learning (ICML-10), pages 663–670.
Liu, J., Lian, Z., Wang, Y., and Xiao, J. (2017). Incremen-
tal kernel null space discriminant analysis for novelty
detection. In Proceedings of the IEEE Conference on
Computer Vision and Pattern Recognition, pages 792–
800.
Liu, W., Luo, W., Lian, D., and Gao, S. (2018). Fu-
ture frame prediction for anomaly detection–a new
baseline. In Proceedings of the IEEE conference on
computer vision and pattern recognition, pages 6536–
6545.
Liu, Z., Zhou, Y., Xu, Y., and Wang, Z. (2023). Simplenet:
A simple network for image anomaly detection and
localization. In Proceedings of the IEEE/CVF Con-
ference on Computer Vision and Pattern Recognition,
pages 20402–20411.
Luo, W., Liu, W., and Gao, S. (2017). A revisit of sparse
coding based anomaly detection in stacked rnn frame-
work. In Proceedings of the IEEE international con-
ference on computer vision, pages 341–349.
Makhzani, A. and Frey, B. J. (2017). Pixelgan autoen-
coders. Advances in Neural Information Processing
Systems, 30.
Moonesinghe, H. and Tan, P.-N. (2008). Outrank: a graph-
based outlier detection framework using random walk.
International Journal on Artificial Intelligence Tools,
17(01):19–36.
Nene, S. A., Nayar, S. K., Murase, H., et al. (1996).
Columbia object image library (coil-20).
Paszke, A., Gross, S., Chintala, S., Chanan, G., Yang, E.,
DeVito, Z., Lin, Z., Desmaison, A., Antiga, L., and
Lerer, A. (2017). Automatic differentiation in pytorch.
Pidhorskyi, S., Almohsen, R., and Doretto, G. (2018). Gen-
erative probabilistic novelty detection with adversarial
autoencoders. Advances in neural information pro-
cessing systems, 31.
Rahmani, M. and Atia, G. K. (2017). Coherence pur-
suit: Fast, simple, and robust principal component
analysis. IEEE Transactions on Signal Processing,
65(23):6260–6275.
Ravanbakhsh, M., Nabi, M., Mousavi, H., Sangineto, E.,
and Sebe, N. (2018). Plug-and-play cnn for crowd
motion analysis: An application in abnormal event de-
tection. In 2018 IEEE Winter Conference on Applica-
tions of Computer Vision (WACV), pages 1689–1698.
IEEE.
Ravanbakhsh, M., Nabi, M., Sangineto, E., Marcenaro, L.,
Regazzoni, C., and Sebe, N. (2017). Abnormal event
detection in videos using generative adversarial nets.
In 2017 IEEE international conference on image pro-
cessing (ICIP), pages 1577–1581. IEEE.
VISAPP 2024 - 19th International Conference on Computer Vision Theory and Applications
264

Ren, H., Liu, W., Olsen, S. I., Escalera, S., and Moeslund,
T. B. (2015). Unsupervised behavior-specific dictio-
nary learning for abnormal event detection. In British
Machine Vision Conference 2015: Machine Vision of
Animals and their Behaviour, pages 28–1. British Ma-
chine Vision Association.
Rumelhart, D. E., Hinton, G. E., and Williams, R. J. (1986).
Learning representations by back-propagating errors.
nature, 323(6088):533–536.
Russakovsky, O., Deng, J., Su, H., Krause, J., Satheesh, S.,
Ma, S., Huang, Z., Karpathy, A., Khosla, A., Bern-
stein, M., et al. (2015). Imagenet large scale visual
recognition challenge. International journal of com-
puter vision, 115:211–252.
Sabokrou, M., Fayyaz, M., Fathy, M., and Klette, R. (2017).
Deep-cascade: Cascading 3d deep neural networks for
fast anomaly detection and localization in crowded
scenes. IEEE Transactions on Image Processing,
26(4):1992–2004.
Sabokrou, M., Khalooei, M., Fathy, M., and Adeli, E.
(2018). Adversarially learned one-class classifier for
novelty detection. In Proceedings of the IEEE con-
ference on computer vision and pattern recognition,
pages 3379–3388.
Simonyan, K. and Zisserman, A. (2014). Very deep con-
volutional networks for large-scale image recognition.
arXiv preprint arXiv:1409.1556.
Smeureanu, S., Ionescu, R. T., Popescu, M., and Alexe,
B. (2017). Deep appearance features for abnormal
behavior detection in video. In Image Analysis and
Processing-ICIAP 2017: 19th International Confer-
ence, Catania, Italy, September 11-15, 2017, Proceed-
ings, Part II 19, pages 779–789. Springer.
Soltanolkotabi, M. and Candes, E. J. (2012). A geometric
analysis of subspace clustering with outliers.
Sultani, W., Chen, C., and Shah, M. (2018). Real-world
anomaly detection in surveillance videos. In Proceed-
ings of the IEEE conference on computer vision and
pattern recognition, pages 6479–6488.
Tsakiris, M. C. and Vidal, R. (2015). Dual principal com-
ponent pursuit. In Proceedings of the IEEE Inter-
national Conference on Computer Vision Workshops,
pages 10–18.
Wang, H.-g., Li, X., and Zhang, T. (2018). Generative ad-
versarial network based novelty detection usingmini-
mized reconstruction error. Frontiers of Information
Technology & Electronic Engineering, 19:116–125.
Wang, S., Zeng, Y., Yu, G., Cheng, Z., Liu, X., Zhou,
S., Zhu, E., Kloft, M., Yin, J., and Liao, Q. (2022).
E
3
3Outlier: a Self-Supervised Framework for Un-
supervised Deep Outlier Detection. IEEE Transac-
tions on Pattern Analysis and Machine Intelligence,
45(3):2952–2969.
Xia, Y., Cao, X., Wen, F., Hua, G., and Sun, J. (2015).
Learning discriminative reconstructions for unsuper-
vised outlier removal. In Proceedings of the IEEE
international conference on computer vision, pages
1511–1519.
Xiao, H., Rasul, K., and Vollgraf, R. (2017). Fashion-
mnist: a novel image dataset for benchmark-
ing machine learning algorithms. arXiv preprint
arXiv:1708.07747.
Xu, D., Ricci, E., Yan, Y., Song, J., and Sebe, N. (2015).
Learning deep representations of appearance and mo-
tion for anomalous event detection. arXiv preprint
arXiv:1510.01553.
Xu, D., Yan, Y., Ricci, E., and Sebe, N. (2017). Detecting
anomalous events in videos by learning deep represen-
tations of appearance and motion. Computer Vision
and Image Understanding, 156:117–127.
Xu, H., Caramanis, C., and Sanghavi, S. (2010). Robust pca
via outlier pursuit. Advances in neural information
processing systems, 23.
Xu, H., Zhang, L., Li, P., and Zhu, F. (2022). Outlier de-
tection algorithm based on k-nearest neighbors-local
outlier factor. Journal of Algorithms & Computational
Technology, 16:17483026221078111.
Yamanishi, K., Takeuchi, J.-I., Williams, G., and Milne, P.
(2000). On-line unsupervised outlier detection using
finite mixtures with discounting learning algorithms.
In Proceedings of the sixth ACM SIGKDD interna-
tional conference on Knowledge discovery and data
mining, pages 320–324.
You, C., Robinson, D. P., and Vidal, R. (2017). Provable
self-representation based outlier detection in a union
of subspaces. In Proceedings of the IEEE conference
on computer vision and pattern recognition, pages
3395–3404.
Zhang, Y., Lu, H., Zhang, L., Ruan, X., and Sakai, S.
(2016). Video anomaly detection based on locality
sensitive hashing filters. Pattern Recognition, 59:302–
311.
Zhou, J. and Xing, H. J. (2023). Novelty detection method
based on dual autoencoders and transformer network.
Journal of Computer Applications, 43(1):22.
Zhou, Y. (2022). Rethinking reconstruction autoencoder-
based out-of-distribution detection. In Proceedings of
the IEEE/CVF Conference on Computer Vision and
Pattern Recognition, pages 7379–7387.
Beyond the Known: Adversarial Autoencoders in Novelty Detection
265
