
Apnea Hypopnea Index Estimation from Low-Granularity Overnight
Oxymetry Data
Nhung Huyen Hoang
a
and Zilu Liang
b
Ubiquitous and Personal Computing Lab, Kyoto University of Advanced Science (KUAS), Kyoto, Japan
Keywords: Sleep Apnea, AHI Regression, Regression Model.
Abstract: The challenge of detecting sleep disorders from consumer wearable sensors is attracting more and more
researchers in the field. Sleep apnea has been the target of many sleep studies because this disorder has many
health, physical, and mental consequences. Because obstruction in the airway is the direct cause of sleep
apnea, overnight pulse oximetry provides valuable information to simplify the obstructive sleep apnea (OSA)
screening. In this study, we aimed to estimate the apnea-hypopnea index (AHI) from consumer-grade low-
granularity oximetry data. We used 5804 sleep records from the Sleep Heart Health Study (SHHS) dataset for
training and testing six different regression models. The best model achieved an R-square of 0.64 ± 0.019 and
ICC of 0.77 ± 0.015. The estimated AHI was further converted to 4 levels of severity (i.e., normal, mild,
moderate, and severe). The macro F1-score, precision and recall were 0.576 ± 0.044, 65.16 ± 4.58 and 56.28
± 3.42, respectively. Central tendency measure, sample entropy and zero crossing of the oximetry data are the
most important features for AHI estimation. Differences between male and female groups indicate a
promising direction to improve the models' performance.
1 INTRODUCTION
It is reported that nearly 1 billion people aged 30-69
are affected by sleep apnea worldwide (Adam et al.,
2019 Aug). By the definition of the American
Academy of Sleep Medicine (AASM), obstructive
sleep apnea occurs when there are partial reductions
or complete pauses in breathing that last 10 seconds
or more. In most cases, apnea events last between 10
and 30 seconds (Iber, 2007). This pattern can repeat 5
to 30 times or more each hour, all night long.
According to the National Sleep Foundation, up to
20% of people may be affected by sleep apnea, and
85% of those affected by the condition are unaware
of their condition (Eric & Abhinav, July 11, 2023).
The apnea-hypopnea index is a measure to evaluate
the severity of sleep apnea. By definition, this is the
average number of apnea and hypopnea events that
happen per hour of sleep. There are four levels of
severities based on the AHI. The criteria for
categorizing apnea levels are slightly different
a
https://orcid.org/0000-0002-5805-2087
b
https://orcid.org/0000-0002-2328-5016
between children and adults. In grown-up, an
AHI < 5 events per hour is considered normal, for
5 ≤ AHI < 15 is mild apnea, for 15 ≤ AHI < 30 is
moderate apnea, and severe apnea for AHI ≥ 30
events per hour (Deepak & Arjun, 2014).
People with sleep apnea might not be aware of
their interrupted sleep. Sleep apnea symptoms appear
both day and night-time, but most of the obvious
signs occur during sleep when people are
unconscious. A bed partner may notice sleep apnea
more than the sleeper due to loud snoring and the
sudden silence of breathing pauses. Remarkably,
people with obstructive sleep apnea (OSA)—a most
common type of sleep apnea—usually do not have
any breathing problems while awake. The fluctuation
of breathing only happens during the unconscious
periods, which makes diagnosing more difficult.
People with OSA usually suffer from various health
consequences. OSA patients tend to sleep with their
mouth open, waking up with a dry mouth. Severe
apnea events can last for one minute or longer.
716
Hoang, N. and Liang, Z.
Apnea Hypopnea Index Estimation from Low-Granularity Overnight Oxymetry Data.
DOI: 10.5220/0012459200003657
Paper published under CC license (CC BY-NC-ND 4.0)
In Proceedings of the 17th International Joint Conference on Biomedical Engineering Systems and Technologies (BIOSTEC 2024) - Volume 2, pages 716-722
ISBN: 978-989-758-688-0; ISSN: 2184-4305
Proceedings Copyright © 2024 by SCITEPRESS – Science and Technology Publications, Lda.

Undiagnosed sleep apnea is directly tied to an
increased risk of cardiovascular, metabolic, and other
health problems (Nestor et al., 2021 Sep). Although
having apnea in the long term can cause serious health
problems, many patients do not have perceivable
symptoms and thus have no motivation to receive a
diagnostic test.
On the other hand, recent consumer wearable
devices can provide general information about sleep
(e.g., sleep wake cycle, sleep structure, sleep
efficiency) for long-term study (Liang & Chapa-
Martell, 2018, 2021). However, they still need an
algorithm to give more insight into human sleep and
detect sleep disorders. Those devices have embedded
sensors to measure blood oxygen saturation levels
and could provide similar functionality as oximetry.
However, the granularity of the data retrievable from
consumer wearables is lower than that of medical
oximetry, which presents a research challenge to be
tackled. This study aimed to develop an automatic
method for estimating AHI and OSA severity with
low-granularity oximetry data.
2 RELATED WORKS
Many fields use machine learning, including
medicine, computer vision, speech recognition, and
predictive analytics. Due to the robust algorithms in
programs and the effectiveness of the machines,
artificial intelligence offers many advantages.
Various researchers undertook different
investigations on the detection of sleep apnea
occurrences (Lazazzera et al., 2021; Papini et al.,
2020; Wang et al., 2023). At the same time, some of
them adopted deep learning approaches, while others
combined feature engineering with conventional
machine learning techniques. A study conducted in
France used a support vector regressor (SVR) and
linear regression to predict AHI and a support vector
machine (SVM) and random forest (RF) models for
classification using 19 variables extracted from 313
sleep records (Mencar et al., 2019). The regression
results showed a minimum achieved root mean square
error of 22.17, while the classification result for four
classes showed around 42,0 for F1-score, 41.8 for
precision and 44.7 for recall. Another study used at-
home oximetry data to estimate AHI and achieved
high intra-class correlation coefficients within 0.889-
0.924 (Gutiérrez-Tobal et al., 2021). They then
classified apnea severity using three typical AHI
thresholds: 5 events/hour, 15 events/hour, and 30
events/hour, respectively. The potential benefits of
utilizing machine learning techniques in conjunction
with automatically collected information from pulse
oximetry data indicate that SpO2 may be a viable
option for simplifying OSA diagnosis. Previous
studies provided evidence that AHI can be estimated
with acceptable results. However, one of the main
limitations of clinical tests is the lack of ability to
track sleep conditions in the long term.
With the development of wearable technologies,
sleep parameters can now be tracked in a home-based
environment for longer periods. However, in contrast
to clinical equipment, data obtained from wearable
devices are low in frequency and resolution, which
makes it challenging to capture all vital information
for diagnosing OSA. The development and
evaluation of a single model with the ability to reach
high diagnostic performance using consumer trackers
are still pending. In this study, we aimed to develop a
clinically useful tool that can be applied to consumer
devices to estimate OSA severity using blood oxygen
saturation (SpO
2
). We choose to focus on regression
models because of their explainability. Explainability
is an important aspect of ensuring that the model is
reliable and can be integrated into clinical practice.
3 METHODOLOGIES
3.1 Database
To train and test the regression models, we used 5804
sleep records from the SHHS database (Quan et al.,
1997; Zhang et al., 2018). This database contains
subjects who are at least 40 years old and underwent
unattended at-home overnight sleep experiments. As
part of the procedure, SpO2 data were available, as
well as the AHI scored by specialists following the
current recommendations of the American Academy
of Sleep Medicine.
3.2 Preprocessing and Extracting
Features
Unlike medical devices, consumer wearables usually
aggregate data into low granularity to save storage
space in their databases, e.g., the oximetry data
retrievable from Fitbit database is 1/60 Hz.
Apnea Hypopnea Index Estimation from Low-Granularity Overnight Oxymetry Data
717
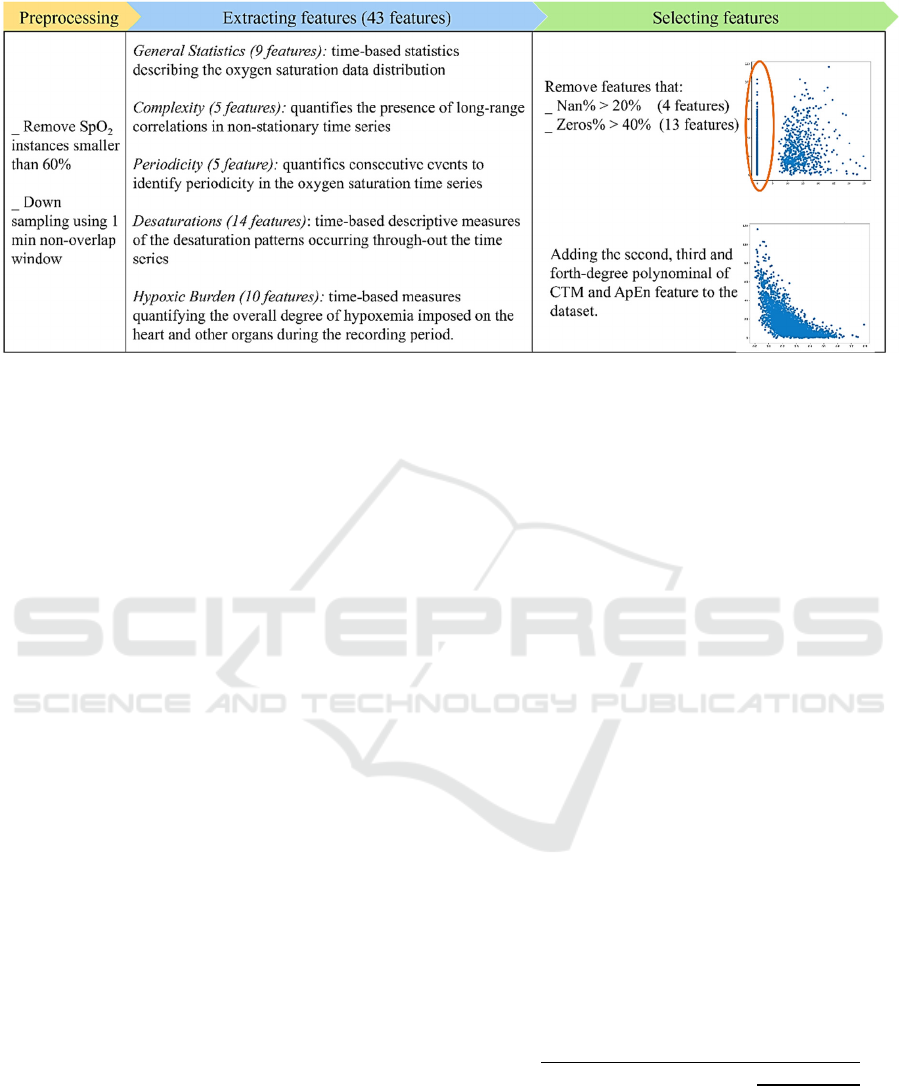
Figure 1: Data preprocessing and features extracting procedure. In most subject, the Desaturation features cannot be
extracted and return 0 (accounted for around 80% of dataset). These features will be excluded because they are not able to
provide valid information.
Therefore, we down-sample the oximetry data from
1Hz to 1/60Hz by using an non-overlapping rolling
window with a size of 60s. The data now match with
the reality of consumer devices. Recordings with
technical faults annotation and total sleep time less
than 4 hours were excluded. After applying the
exclusion criteria, 5675 records (with 2984 records
from female subjects and 2691 records from male
subjects) were used to train and test the regression
models. In addition to the SpO2 signal, two
demographic features were used (i.e., age and Body
Mass Index (BMI)) since population-based and
longitudinal studies have shown that body weight and
aging were the most contributing factors to the risk of
having OSA [9].
Before extracting the feature, any SpO2 value
below 60% was considered as hardware malfunction
and set to nan. Then, SpO2 features were computed
using the open POBM library (Levy et al., 2021). In
total, we had 43 features divided into five categories:
General Statistics, Complexity, Periodicity,
Desaturations and Hypoxic Burden. Extracted
features that were contaminated by nan values (>20%
of total data) or zero values (>40% of total data) were
excluded. While carefully examining selected
features, we noticed that the relation between the
Central Tendency Measure (CTM) and
Approximated Entropy (ApEn) with AHI is non-
linear. A polynomial equation might fit better for
these features. Therefore, we added the 2nd, 3rd and
4th-degree polynomials of each feature in the data as
new features. The final selection of 34 features was
then used for developing regression models. We used
the nrss_ahi_hp3r_aasm15 as a reference to evaluate
the prediction result.
3.3 Regression Models
The SHHS database was split into a 90% training set
and 10% test set. The training set was split into 70%
training and 30% validation for 5-fold cross
validation. Regression models of interest in this study
were LinearRegression (LR), Ridge, Lasso, Random
Forest (RF), XGBoost and CatBoost. The important
parameters of a model were found using the grid
search method, which basically means trying all
possible combinations of the parameters of interest.
To evaluate the regression results, we use Bland-
Altman and correlation plots to analyse the agreement
between the estimated AHI and the ground truth. The
agreement was illustrated by the median difference
between two AHI and the 5
th
and 95
th
percentile of
their differences. Also, the Intraclass Correlation
Coefficient (ICC) was calculated using the equation
below:
𝐼𝐶𝐶
𝑀𝑆
𝑀𝑆
𝑀𝑆
𝑂1𝑀𝑆
𝑂∗
𝑀𝑆
𝑀𝑆
𝑛
(1)
Where O is the number of observers (two, in this
case), MS
I
is the instance mean square, MS
E
is the
mean square error, and MS
O
is the observer mean
square. In addition to ICC, we also use Root Mean
HEALTHINF 2024 - 17th International Conference on Health Informatics
718
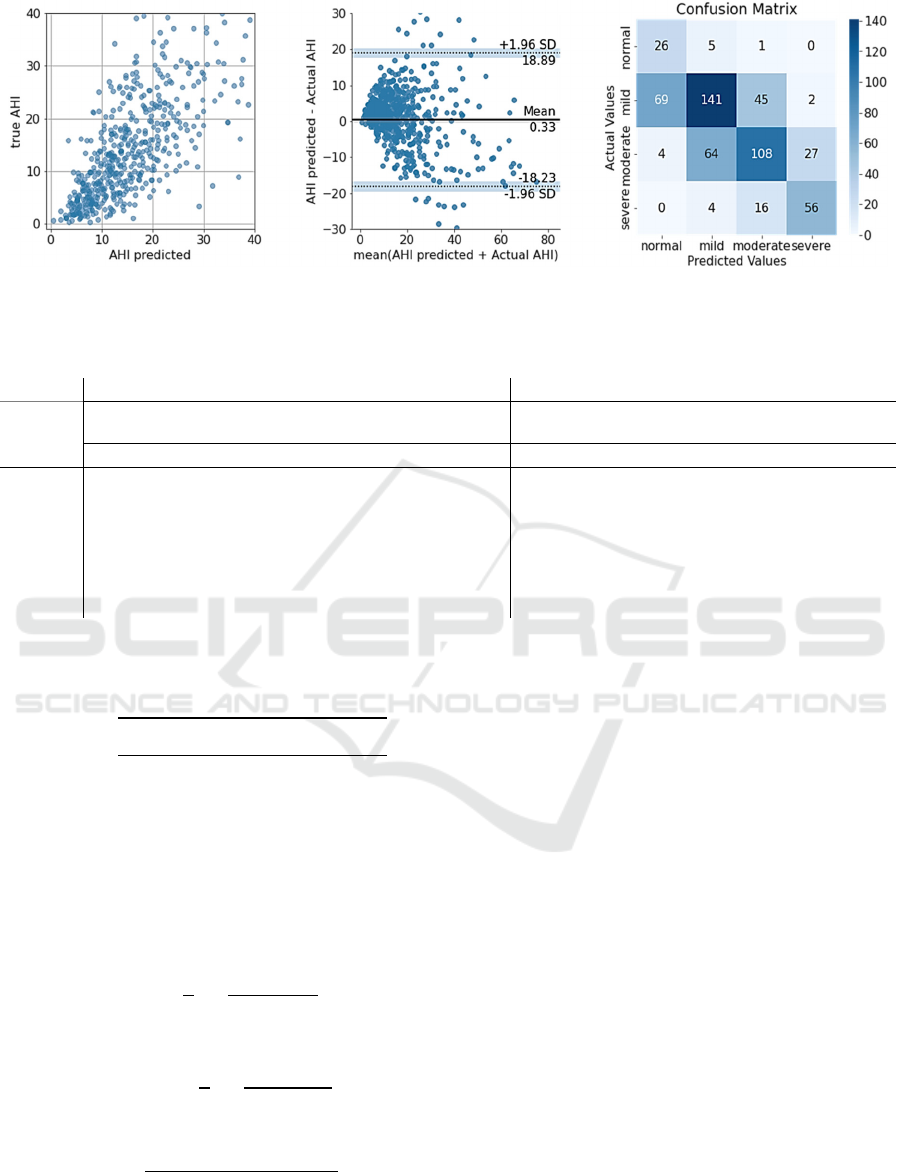
Figure 2: Bland-Altman, correlation plots and confusion matrix for OSA severity estimation. The plot shows a small bias
(mean = 0.31) and fairly good correspond between predicted and actual AHI.
Table 1: Summary of regression and classification results tested with different regression models.
Regression parameters Classification parameters
Regression
model
RMSE ICC Correlation
Coefficient
Recall (%) Precision (%) F1-score
Mean std Mean std Mean std Mean Std Mean std Mean std
Linear
9.642 0.457 0.778 0.019 0.801 0.006 56.56 8.16 65.44 8.58 0.578 0.063
Ridge
9.823 0.130 0.778 0.019 0.801 0.006 56.28 3.42 65.16 4.58 0.576 0.044
Lasso
10.096 0.413 0.761 0.015 0.794 0.011 54.16 3.25 58.80 2.56 0.548 0.036
Random
F
ores
t
9.695 0.661 0.758 0.024 0.787 0.009 52.71 4.35 62.53 3.82 0.533 0.042
XGBoost
10.501 0.278 0.753 0.021 0.755 0.013 56.29 4.12 60.30 3.45 0.572 0.054
CatBoost
9.47 0.231 0.781 0.019 0.799 0.004 55.39 3.11 65.75 3.24 0.567 0.039
Squared Error (RMSE) to measure how concentrated
the data is around the line of best fit.
𝑅𝑀𝑆𝐸
∑
𝐴
𝐻𝐼
𝐴
𝐻𝐼
𝑁
(2)
We also wanted to evaluate the classification of
apnea severity based on estimated AHI. The
estimated AHI was converted to 4 levels of severity,
and the macro precision, recall and F1-score were
reported as the measurement of diagnosis accuracy.
These parameters were computed as follows:
𝑅𝑒𝑐𝑎𝑙𝑙
1
4
𝑇𝑃
𝑇𝑃
𝐹𝑁
(3)
𝑃𝑟𝑒𝑐𝑖𝑠𝑖𝑜𝑛
1
4
𝑇𝑃
𝑇𝑃
𝐹𝑃
(4)
𝐹1
2
𝑃𝑟𝑒𝑐𝑖𝑠𝑖𝑜𝑛
∗ 𝑅𝑒𝑐𝑎𝑙𝑙
𝑃𝑟𝑒𝑐𝑖𝑠𝑖𝑜𝑛
𝑅𝑒𝑐𝑎𝑙𝑙
(5)
Where k is the number of classes (four, in this
case), TP
k
is the number of true positives, FP
k
is the
number of false positives, and FN
k
is the number of
false negatives.
4 RESULTS
4.1 Features Importance
Regression models require pre-defined features as
input. This is a manual process that requires domain
knowledge of the interested data. The advantage of
the handcrafting feature is it allows a deep
understanding of the data, making the model easy to
interpret and convincing. Good features are necessary
to build a good regression model. To evaluate how
each feature contributes to regression results, we used
two methods: (1) calculating Pearson correlation
between each feature and reference AHI and (2)
permutation feature importance. Both methods
Apnea Hypopnea Index Estimation from Low-Granularity Overnight Oxymetry Data
719
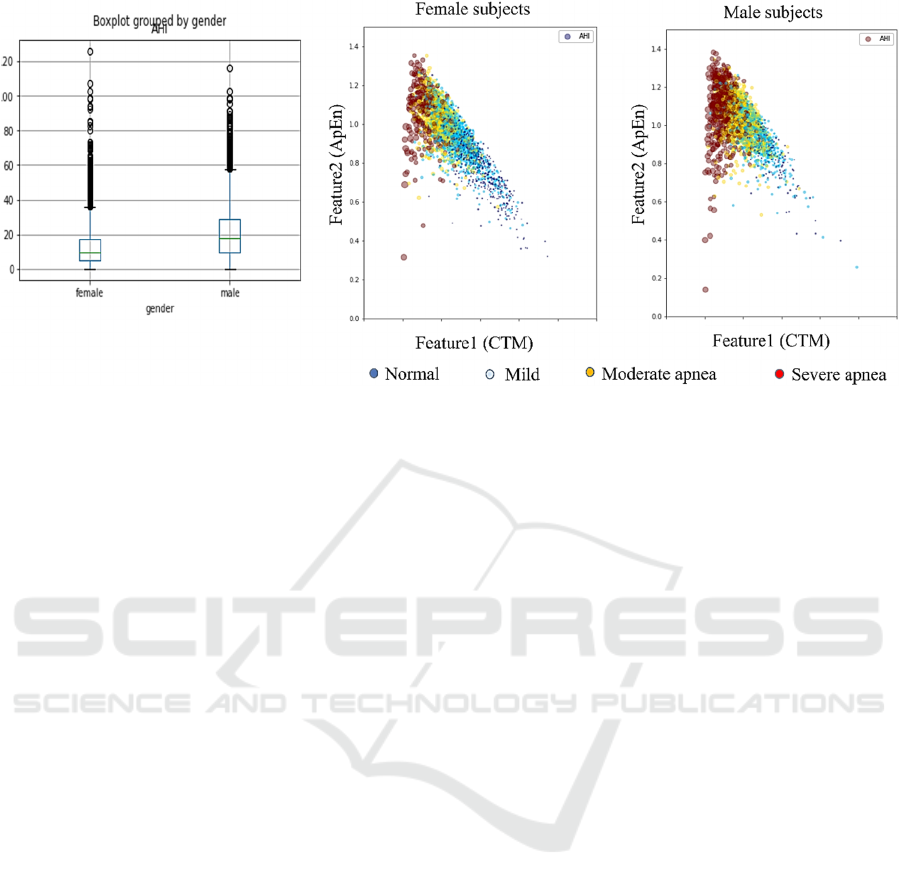
Figure 3: The box plots show that AHI is noticeably lower in female group compared to male group. The scatter plot shows
a possible linear correlation among two features and OSA severity. The side of the dot correspond to AHI values.
showed that CTM, BMI, Zero Crossing (ZC) and
Sample Entropy (SampEn) played a significant effect
on the model performance. The CTM showed a strong
negative correlation (-0.65) with AHI values, whereas
BMI, ZC and SampEn showed a moderate positive
correlation (0.35, 0.28 and 0.56, respectively).
4.2 AHI Regression Result
Overall, there was no significant difference between
the models in predicting AHI values, although the
Ridge model evaluation indices were slightly higher
than the other models. Therefore, for convenience of
illustration, Figure 4 only shows the Bland-Altman
plots and the correlation plots of actual and estimated
AHI of Ridge regression. The full results of the test
set are reported in Table 1 in mean and standard
deviation format. The regression models estimated
AHI with an RMSE of 9.87 (9.47-10.501) and an ICC
of 0.768 (0.753-0.781), which can be interpreted as
good reliability. The Bland-Altman plot shows a
small bias where the mean is around 0.31 (0.25-0.57).
However, the wide 95% confidence interval and the
dispersion of the correlation plot indicate that when
the AHI or apnea severity increases, the error of the
model also increases. This phenomenon was also
pointed out in previous studies. As snoring progresses
with more severe symptoms, signal quality becomes
unstable and is more affected by external factors.
4.3 OSA Severity Based on Estimated
AHI
Assessed parameters include macro recall, macro
precision and macro F1-score. On average, we
achieved recall around 55.23 ± 1.385, precision
around 63.00 ± 2.697, and F1-score around 0.562 ±
0.016. Generally, the models tend to overestimate the
AHI values, therefore increasing the OSA severity.
Around 27.64% of the test set was overestimated, and
14.08% of the test set was underestimated. Only a few
cases were misclassified between normal and
moderate classes, and no cases were misclassified
between normal and severe classes.
5 DISCUSSIONS
We developed and tested a method to estimate AHI at
1-minute resolution and patient severities using a
small set of signals that can be implemented on
devices such as smartwatches and consumer sleep
trackers. The method was tested on the SHHS dataset
containing 5804 sleep records. The obtained results
allowed OSA screening and severity estimation, even
in a population with a high likelihood of
cardiovascular confounding factors and a large
proportion of hypopneas.
This study has three limitations. First, many
subjects were mislabelled from mild to moderate; this
is important as it will affect the medical decision on
HEALTHINF 2024 - 17th International Conference on Health Informatics
720

whether these subjects need medical treatment in the
future. Most models work best when each feature and
the target is loosely Gaussian distributed. Ideally, the
histogram of features and targets should resemble the
familiar bell curve shape (Müller & Guido, 2017).
However, in reality, the distribution of actual AHI is
slightly skewed left. Second, we have not considered
the effect of demographic features on the regression
task although there are evidences showing that factors
like body weight, gender, alcohol consumption,
smoking, cranial facial and aging could contribute to
the risk of having OSA (Dempsey et al., 2002; PE et
al., 2000). An existing study conducted an extensive
experiment over 1024 patients and tested 41 different
regressors, showing a promising method to estimate
OSA severity based on demographic data only
(Rodrigues et al., 2020). In the SHHS dataset, it is
noticed that women have lower AHI values compared
to men, as shown in Figure 3 Boxplots. Furthermore,
the relation between features and AHI is more
distinguished and linear. This is an interesting
direction for future work. Finally, the number of
features used in this study is limited, with only 34
features. Therefore, future assessment of more
effective features would help improve the statistical
power of our results.
6 CONCLUSIONS
Suspected OSA patients would strongly benefit from
a comfortable home diagnosis. Within this context,
the potential of respiratory sensors integrated into a
portable tracker was assessed for sleep monitoring in
suspected OSA patients. Our study aims to develop a
diagnostic tool based on sleep biometrics records in a
user’s natural environment. Based on AHI prediction,
the OSA severity was estimated and achieved
reasonable agreement with the ground truth. This is
useful to assist the clinical decision-making process
in the context of OSA diagnosis.
ACKNOWLEDGEMENTS
This study was supported by the JSPS KAKENHI
Grant Number 21K17670. The author would like to
thank the National Sleep Research Resource for
sharing the SHHS dataset.
REFERENCES
Adam, V. B., Najib, T. A., Peter, R. E., Raphael, H., Mary,
S. M. I., Mary, J. M., . . . Atul, M. (2019 Aug).
Estimation of the global prevalence and burden of
obstructive sleep apnoea: a literature-based analysis.
Lancet Respir Med 7(8), 687-698.
Deepak, T., & Arjun, K. (2014). Bronchial asthma and
obstructive sleep apnea hypopnea syndrome: Another
overlap or mere coincidence Indian J Sleep Med, 9.4,
155-160.
Dempsey, J. A., Skatrud Jb Fau - Jacques, A. J., Jacques Aj
Fau - Ewanowski, S. J., Ewanowski Sj Fau - Woodson,
B. T., Woodson Bt Fau - Hanson, P. R., Hanson Pr Fau
- Goodman, B., & Goodman, B. (2002). Anatomic
determinants of sleep-disordered breathing across the
spectrum of clinical and nonclinical male subjects.
Chest, 122(3)(0012-3692), 840-851. https://doi.org/
10.1378/chest.122.3.840
Eric, S., & Abhinav, S. (July 11, 2023). What it is, its risk
factors, its health impacts, and how it can be treated.
Retrieved July 20 from
Gutiérrez-Tobal, G. C., Álvarez, D., Vaquerizo-Villar, F.,
Crespo, A., Kheirandish-Gozal, L., Gozal, D., . . .
Hornero, R. (2021). Ensemble-learning regression to
estimate sleep apnea severity using at-home oximetry
in adults. Applied Soft Computing, 111, 107827.
https://doi.org/https://doi.org/10.1016/j.asoc.2021.107
827
Iber, C. a. A.-I. S. a. C. A. L. a. Q. S. (2007). The AASM
Manual for the Scoring of Sleep and Associated Events:
Rules, Terminology and Technical Specifications.
Westchester, IL: American Academy of Sleep Medicine.
Lazazzera, R., Deviaene, M., Varon, C., Buyse, B.,
Testelmans, D., Laguna, P., Carrault, G. (2021).
Detection and Classification of Sleep Apnea and
Hypopnea Using PPG and SpO$_2$ Signals. IEEE
Transactions on Biomedical Engineering, 68(5), 1496-
1506. https://doi.org/10.1109/TBME.2020.3028041
Levy, J., Álvarez, D., Rosenberg, A. A., Alexandrovich, A.,
del Campo, F., & Behar, J. A. (2021). Digital oximetry
biomarkers for assessing respiratory function: standards
of measurement, physiological interpretation, and
clinical use. npj Digital Medicine, 4(1), 1.
https://doi.org/10.1038/s41746-020-00373-5
Liang, Z., & Chapa-Martell, M. A. (2018). Validity of
consumer activity wristbands and wearable EEG for
measuring overall sleep parameters and sleep structure
in free-living conditions. Journal of Healthcare
Informatics Research, 1-27.
Liang, Z., & Chapa-Martell, M. A. (2021). A Multi-Level
Classification Approach for Sleep Stage Prediction
With Processed Data Derived From Consumer
Wearable Activity Trackers. Frontiers in Digital
Health, 3, 665946. https://doi.org/ 10.3389/fdgth.20
21.665946
Mencar, C., Gallo, C., Mantero, M., Tarsia, P., Carpagnano,
G. E., Foschino Barbaro, M. P., & Lacedonia, D.
(2019). Application of machine learning to predict
obstructive sleep apnea syndrome severity. Health
Apnea Hypopnea Index Estimation from Low-Granularity Overnight Oxymetry Data
721

Informatics Journal, 26(1), 298-317. https://doi.org/
10.1177/1460458218824725
Müller, A. C., & Guido, S. (2017). Introduction to machine
learning with Python : a guide for data scientists (First
edition ed.). O'Reilly Media, Inc Sebastopol, CA.
Nestor, G., Afsin, S., David, P., Christopher, J., & Eli, G.
(2021 Sep). Transfer learning artificial intelligence for
automated detection of atrial fibrillation in patients
undergoing evaluation for suspected obstructive sleep
apnoea: a feasibility study. Sleep Med, 85, 166-171.
Papini, G. B., Fonseca, P., van Gilst, M. M., Bergmans, J.
W. M., Vullings, R., & Overeem, S. (2020). Wearable
monitoring of sleep-disordered breathing: estimation of
the apnea–hypopnea index using wrist-worn reflective
photoplethysmography. Scientific Reports, 10(1),
13512. https://doi.org/10.1038/s41598-020-69935-7
PE, P., T, Y., M, P., J, D., & J, S. (2000). Longitudinal study
of moderate weight change and sleep-disordered
breathing. JAMA, 284(23), 3015-3021.
Quan, S. F., Howard, B. V., Iber, C., Kiley, J. P., Nieto, F.
J., O'Connor, G. T., Wahl, P. W. (1997). The Sleep
Heart Health Study: design, rationale, and methods.
Sleep, 20(12), 1077–1085.
Rodrigues, J., Pepin, J.-L., Goeuriot, L., & Amer-Yahia, S.
(2020, 2020). An Extensive Investigation of Machine
Learning Techniques for Sleep Apnea Screening CIKM
'20: The 29th ACM International Conference on
Information and Knowledge Management, Virtual
Event Ireland, France. https://hal.science/hal-02972546
Wang, S., Xuan, W., Chen, D., Gu, Y., Liu, F., Chen, J.,
Luo, J. (2023). Machine Learning Assisted Wearable
Wireless Device for Sleep Apnea Syndrome Diagnosis.
Biosensors, 13(4).
Zhang, G.-Q., Cui, L., Mueller, R., Tao, S., Kim, M.,
Rueschman, M., Redline, S. (2018). The National Sleep
Research Resource: towards a sleep data commons. J
Am Med Inform Assoc., 25(10), 1351-1358.
HEALTHINF 2024 - 17th International Conference on Health Informatics
722
