
On Granularity Variation of Air Quality Index Vizualization from
Sentinel-5
Jordan Salas Cuno
1
, Arthur Andrade Bezerra
2
, Aura Conci
1
and Luiz M. G. Gonc¸alves
2
1
Computer Institute, Universidade Federal Fluminense, Niter
´
oi, Brazil
2
Grad. Prog. in Elec. and Comp. Eng., Univ. Fed. do Rio Grande do Norte, Natal, Brazil
Keywords:
Air Quality Index, Sentinel-5 Dataset, Pandemic Dynamics, Data-Driven Prediction.
Abstract:
Air quality has been a hot research topic not only because it is directly related to climate change and the
greenhouse effect, but most because it has been strongly associated to the transmission of respiratory diseases.
Considering that different pollutants affect air quality, a methodology based on satellite data processing is
proposed. The objective is to obtain images and measure the main atmospheric pollutants in Brazil. Using
satellite systems with spectrometers is an alternative technology that has been recently developed for dealing
with such a problem. Sentinel-5 is one of these satellites that works contantly monitoring the earth surface
generating a vast amount of data mainly for climate monitoring, and that is used in this research. The main
contribution of this research is a computational workflow that uses Sentinel-5 data to generate images of Brazil
and its states, in addition to calculating the average value of the main atmospheric pollutants, data that can be
used in the prediction of pollution as well as the identification of most polluted regions.
1 INTRODUCTION
The quality of the air that is breathed by living beings
has been highly affected in recent years. Changes in
the composition of the atmosphere were studied dur-
ing the COVID-19 pandemic, when restrictive mobil-
ity measures were adopted around the world, causing
the sudden change on society’s behavior, and having
an impact on the generation of different atmospheric
pollutants. Given the chronological nature of air pol-
lutants over the years, techniques based on data or ar-
tificial intelligence (AI) have been developed to pre-
dict air quality dynamics (Pereira et al., 2020; Arag
˜
ao
et al., 2022). Particularly, the techniques based on
Long Short Term Memory (LSTM) and Mean Abso-
lute Error (MAE) are known to have general appli-
cability in time series data prediction (Pereira et al.,
2020)
To determine the composition of the air, which
may be suitable or harmful for living beings, the air
quality index (AQI) is used. Each country or environ-
mental regulatory entity has parameters to determine
the AQI level. Different indices of air pollutants are
used to generate a single value that represents the air
quality in a given region. At the same time, it is im-
portant to identify regions with high pollution levels
so that environmental authorities can adopt measures
to protect the population’s health.
In the present work, our focus of study is the gen-
eration of pictures that represent the levels of each at-
mospheric pollutant in Brazil and, average value for
each pollutant. High pollution levels or an imbal-
ance in atmospheric composition may be related to
spreading diseases that can cause respiratory prob-
lems and their worsening. Respiratory infections can
be more widespread with a low AQI (Fermo et al.,
2021; Piscitelli et al., 2022).
It is well known that pollution and other kind of
(even natural) phenomena (as combustion or burning)
provoque particle dispersion having substantially air
quality effect. The consumption of fossil fuels and
the huge amount of fires (natural or provoqued) are
undoubtedly the worst ones. Mainly because of them,
air quality has been substantially degradaded in the
last decades (for instance in USA, with fog almost
going to Manhathan). This lost of quality due to fos-
sil fuels became more evident when the COVID-19
pandemic was declared by World Health Organization
(WHO) in the beginning of 2020. The social isolation
forced a stop of vehicles and fabrics, promoting im-
mediat change in pollutant levels, and improving the
air quality. The decrease of emissions from vehicles,
fabrics, and other activities, increased the air quality.
Thus, showing that the quality of the air presents an
Cuno, J., Bezerra, A., Conci, A. and Gonçalves, L.
On Granularity Variation of Air Quality Index Vizualization from Sentinel-5.
DOI: 10.5220/0012459000003660
Paper published under CC license (CC BY-NC-ND 4.0)
In Proceedings of the 19th International Joint Conference on Computer Vision, Imaging and Computer Graphics Theory and Applications (VISIGRAPP 2024) - Volume 3: VISAPP, pages
711-720
ISBN: 978-989-758-679-8; ISSN: 2184-4321
Proceedings Copyright © 2024 by SCITEPRESS – Science and Technology Publications, Lda.
711

important role, not only in desease countermeasures
but also in other situations such as giving an overview
of its impacts in the climatic global changing, for ex-
ample.
The determination of AQI uses a set of atmo-
spheric parameters that are usually measured in some
way and serve as input for its calculation. Here we
aim to use data coming from the Sentinel-5 satel-
lite. Thanks to this satellite that is contantly tak-
ing all kinds of raster data from the earth’s surface,
this process can be done for different regions of the
planet. We use in the study the Brazilian geographical
area, in order to make the experiment feasible. This
means analysing different atmospheric pollutant from
the satellite data in the geodesic positions of the states
of Brazil. Although, there is a traditional approach to
compute de AQI, a question that arise is how precisely
calculate it from satellite data. Also, other issues ap-
pear such as what is the proper granularity of data that
should be useful and efficient for a country observa-
tion.
This study contributes to a larger project, for
predicting the dynamics of viral epidemics and
infectious contagious diseases with clustered data
analysis from the perspective of artificial intelli-
gence. The project goal is to predict the dy-
namics of the advancing behavior of the COVID-
19 pandemic, using AI methods. Normally, there
are parameters or behaviors do not used (or that
cannot be) in traditional epidemiological mod-
els such as the Susceptible, Infectious, Recov-
ered (SIR), Autoregressive Integrated Moving Aver-
age (ARIMA), and Susceptible-Exposed-Infectious-
Recovered-Deceased (SEIRD), among other predic-
tion models (Pereira et al., 2020). Hence, the advan-
tage of this approach is the incorporation of new as-
pects that influence the behavior of the pandemic for
predictions (as mobility indexes, climatic factors, and
air pollution, being the latter the topic of research of
the current work).
Thus, our main contribution here is the develop-
ment of a technique that can be used to calculate air
pollutant rates within a period of time, with a possibly
finer granularity. As said, the focus is a geographic
area inside Brazil, initially. So, valid characteristics
for the Sentinel-5 satellite and data set are used in-
side this region. As aforementioned, the predictions
given by the data-driven approaches use AQI, and
other variables, and here we have contributed with
the use of Sentinel-5 data for calculating AQI at some
desired level of granularity that is recquired by these
data-driven tools.
2 METHODOLOGY
Calculating the air pollutant indices for a given re-
gion helps evaluate air quality. As mentioned previ-
ously, to estimate the AQI for a given area, it is nec-
essary first to obtain the air pollutant indices; based
on the analysis of the various index, it is possible to
check whether the air in a given location is dangerous
for humans and animals (Arag
˜
ao et al., 2022; Fermo
et al., 2021; Piscitelli et al., 2022). The general find-
ing is that by improving air quality respiratory prob-
lems will be minimized, as well other chronic diseases
that are ssociated with the deaths from Covid-19.
Therefore, next subsections discuss the levels of
atmospheric pollutants, the way in which the data pro-
vided by Sentinel5 is acquired, and the structure of
how all this information is made available.
2.1 Acquiring Pollutant Data
One of the most important atmosferic parameters
from which the Air Quality Index (AQI) can be
most of time straight calculated is particulate matter
(PM), more specifically PM2.5 and PM10. Moreover,
other pollutants as Ozone (O3), Nitrogen Dioxide
(NO
2
), Sulfur Dioxide (SO2), and Carbon Monox-
ide (CO) emissions can also be used in its determi-
nation. Nowadays, there exist ground monitoring sta-
tions for acquiring both PM2.5 and PM10 data, with
a few exceptions where only the PM10 data is avail-
able (Scale, 2022).
As said, these pollutant can be acquired in two dif-
ferrent ways. The first one is by using an in-loco mon-
itoring station, which has the several sensors types
installed inside it. In this case, they can be used to-
gether in a system that captures their specific data, on
the several variables above (Ozone, PM, and so on).
Figure 1 shows some of the existing stations around
the world (Scale, 2022). Notice that a few of them are
located in Brazil, where they are mainly in the cities
of the southern states.
On a second way, it is possible to have these data
acquired and calculated by using data provided by
satellites. They normally capture the radiation of light
from regions on the earth’s surface, from which it is
possible to extract information that can be used to es-
timate the values for the pollutant. This can be done
thanks to air quality scientists that have discovered
that each pollutant has a specific radiation distribu-
tion, which can be used to separate them. Thanks to
this, satellite data is often used nowadays in order to
measure pollution itens, such as the World’s Air Pol-
lution: Real-time Air Quality Index (Scale, 2022), Air
quality index (AQI) and PM2.5 air pollution (Project,
VISAPP 2024 - 19th International Conference on Computer Vision Theory and Applications
712
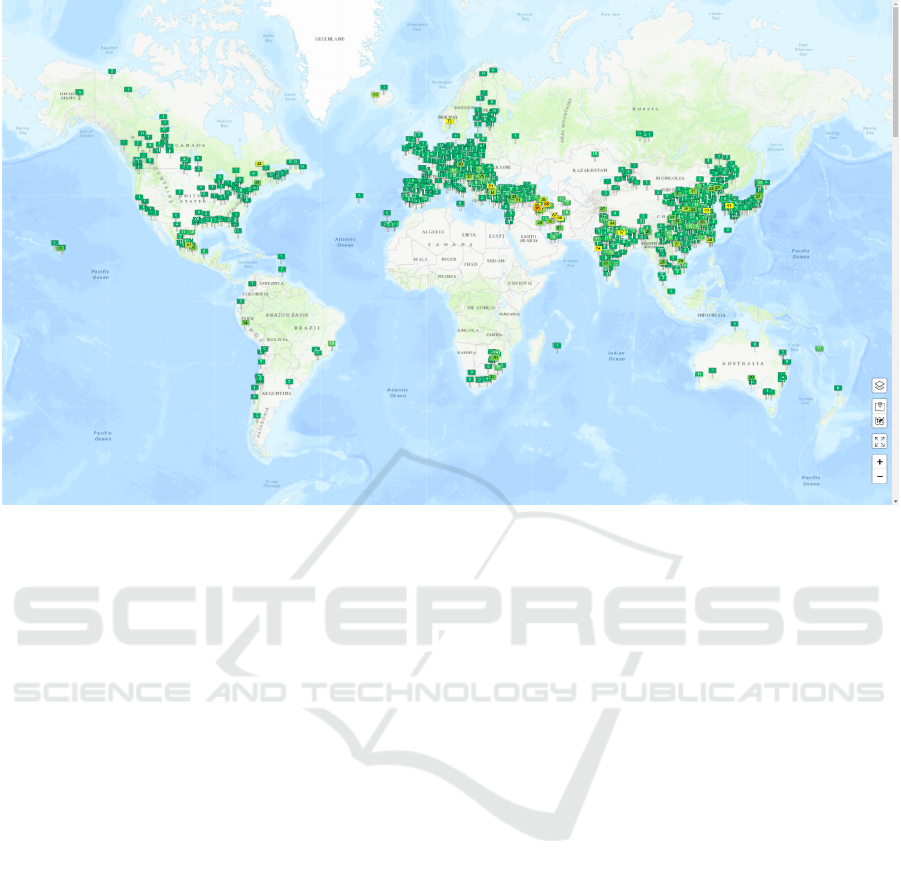
Figure 1: World map of existing AQI stations.
2022b), and Air Pollution: Real-time Air Quality In-
dex (AQI) (Project, 2022a).
Determination of the AQI for a particular places
where it is generally worst is also possible, as for
example the Hanoi AQI and the Vietnam Air Pollu-
tion (Hanoi, 2022). There are web sites as the Health
and Air Quality Data Pathfinder from NASA (NASA,
2022) that provide open access to their data for re-
search scientists. It is said that air pollution is one of
the largest global environmental and health threats.
Actually, their satellites and airborne platforms have
been equiped with instruments that continuouslly ac-
quire new data about these pollutants.
The data Sentinel collects is available through
Copernicus data Space Ecosystem, an open platform
that provides free access to a wide range of data
from the Copernicus Sentinel missions. In January of
2023 Copernicus Data Space Ecosystem, old Coper-
nicus Open Access Hub initial service, allowing the
analysis and exploration of pollutant data freely, al-
lowing the use of data relating to air quality, ozone
layer, and many other data. Here, we use such kind
of data provided by Sentinel-5 (The-European-Space-
Agency, 2022) in order to calculate the index of atmo-
spheric pollutants, which is known as having high-
quality. Besides in the current work we focus only
on data provided by Sentinel-5, we notice that the use
of in-loco (PM, humidity, and temperature) sensors is
also an option.
2.2 Data Preprocessing
The Copernicus Data Space Ecosystem provides vast
information about different atmospheric pollutants, so
it is necessary to select the types of pollutants that will
be used in this work. Sentinel-5 makes data available
in the form of bands around the earth, providing broad
research coverage and collecting diverse information
for each pollutant. All this information downloaded
from the Copernicus Space Ecosystem is of consider-
able size.
As this work aims to measure energy, it is nec-
essary to pre-process the data to work with only the
essential information. The geographic delimitation is
part of the pre-processing since our geographic area
of interest is Brazil. This pre-processing results in
files that are lighter and simpler to manipulate, but
containing the original information that is essential
for our work.
2.3 Pollutant Measurements
The data collected by Sentinel-5 follows a chronolog-
ical order, as explained in greater detail in the next
session. Sentinel-5 orbits around the earth and gen-
erates .NC files that contain all the information. The
geographic extension is expanded in this work by con-
sidering Brazil’s area of interest 2. To obtain atmo-
spheric information that covers the entire Brazilian
territory, 2 to 3 .NC files are required. The generated
On Granularity Variation of Air Quality Index Vizualization from Sentinel-5
713
images use all available .NC files that follow a time-
line. The result is daily images that capture the levels
of atmospheric pollutants across the entire geographic
area of Brazil.
Figure 2: Sentinel-5 scanning orbit.
3 SENTINEL-5 POLLUTANTS
Sentinel-5 is a low-orbit satellite designed to pro-
vide information on air quality and climate composi-
tion, in addition to monitoring the ozone layer (The-
European-Space-Agency, 2022). It is part of the Eu-
ropean Earth Obs.ervation Program (Copernicus) di-
rected by the European Commission (EC). The main
objective is to carry out atmospheric measurements
with high Spatio-temporal resolution, related to air
quality, components of the climate system, ozone and
UV radiation (Veefkind et al., 2012).
3.1 Considered Features
The Sentinel-5 payload consists of a high-resolution
spectrometer system operating in the ultraviolet to
shortwave infrared range, consisting of 7 differ-
ent spectral bands UV-1 (270-300nm), UV-2 (300-
370nm), VIS ( 370-500nm), NIR-1 (685-710nm),
NIR-2 (745-773nm), SWIR-1 (1590-1675nm) and
SWIR-3 (2305-2385nm). The spectral resolution
varies from 1nm in UV1 to 0.25nm in SWIR chan-
nels, with the main climatic components being O
3
,
NO
2
, SO
2
, HCHO, CO, CH
4
. The sweep angle of the
sensor is 108°, considering the height of the satellite
orbit (817km) the corresponding distance of the track
on the ground is 2670km. Figure 4 illustrates how this
is performed, based on the TROPOMI measurement
principle (Veefkind et al., 2012).
3.2 Data Structure
Information provided by the Sentinel-5 is organized
into a three-tiered structure:
• Level-0: Contains information about the satel-
lite’s orientation, this information is saved but not
available to users.
• Level-1B: Contains geolocated and corrected ter-
restrial radiation information.
• Level-2: Contains geophysical information de-
rived from the processing of measured data pro-
vided by Level-1B.
All data used here are obtained from Level-2. At
this level, there are three types of flows to work with
this data. The first is NRT, which is the near real-time
stream available 3 hours after scanning. The other is
the offline stream, where information is available after
a few days. And, the last is the reprocessing stream,
where possible missing information is corrected. Ta-
ble 1 shows an example of the Level 2 products, with
identifier and institution.
Table 1: Level 2 Products.
Product type Parameter
L2 AER AI UV Aerosol Index
L2 CH4 Methane (CH
4
)
L2 CLOUD Cloud fraction
L2 CO Carbon Monoxide (CO)
L2 HCHO Formaldehyde (HCHO)
L2 NO2 Nitrogen Dioxide (NO
2
)
L2 O3 Ozone (O
3
)
L2 SO Sulfur Dioxide (SO
2
)
3.3 Dataset
All this information is available through the Coper-
nicus Open Access Hub website. The data range re-
ferring to a specific date can be downloaded directly
from this website or a script can be used to automate
this process, depending on the amount of data to be
used in the experiments. It is necessary to define pa-
rameters in the request for the data ranges of our in-
terest. Time interval that can be set as days, weeks,
or months. The type of product, in the case of pol-
lutant analysis, must be Level-2. And the geographic
area of interest, it is defined as a georeferenced poly-
gon. The defined period considers the first six days of
January 2019 and the first six days of January 2020,
the selected product of Level-2 is Nitrogen Dioxide
(L2 NO
2
), and the territory of Brazil is the geographic
area of study. The result is a set of files (.NC), each of
which represents a satellite scan range. Information
VISAPP 2024 - 19th International Conference on Computer Vision Theory and Applications
714
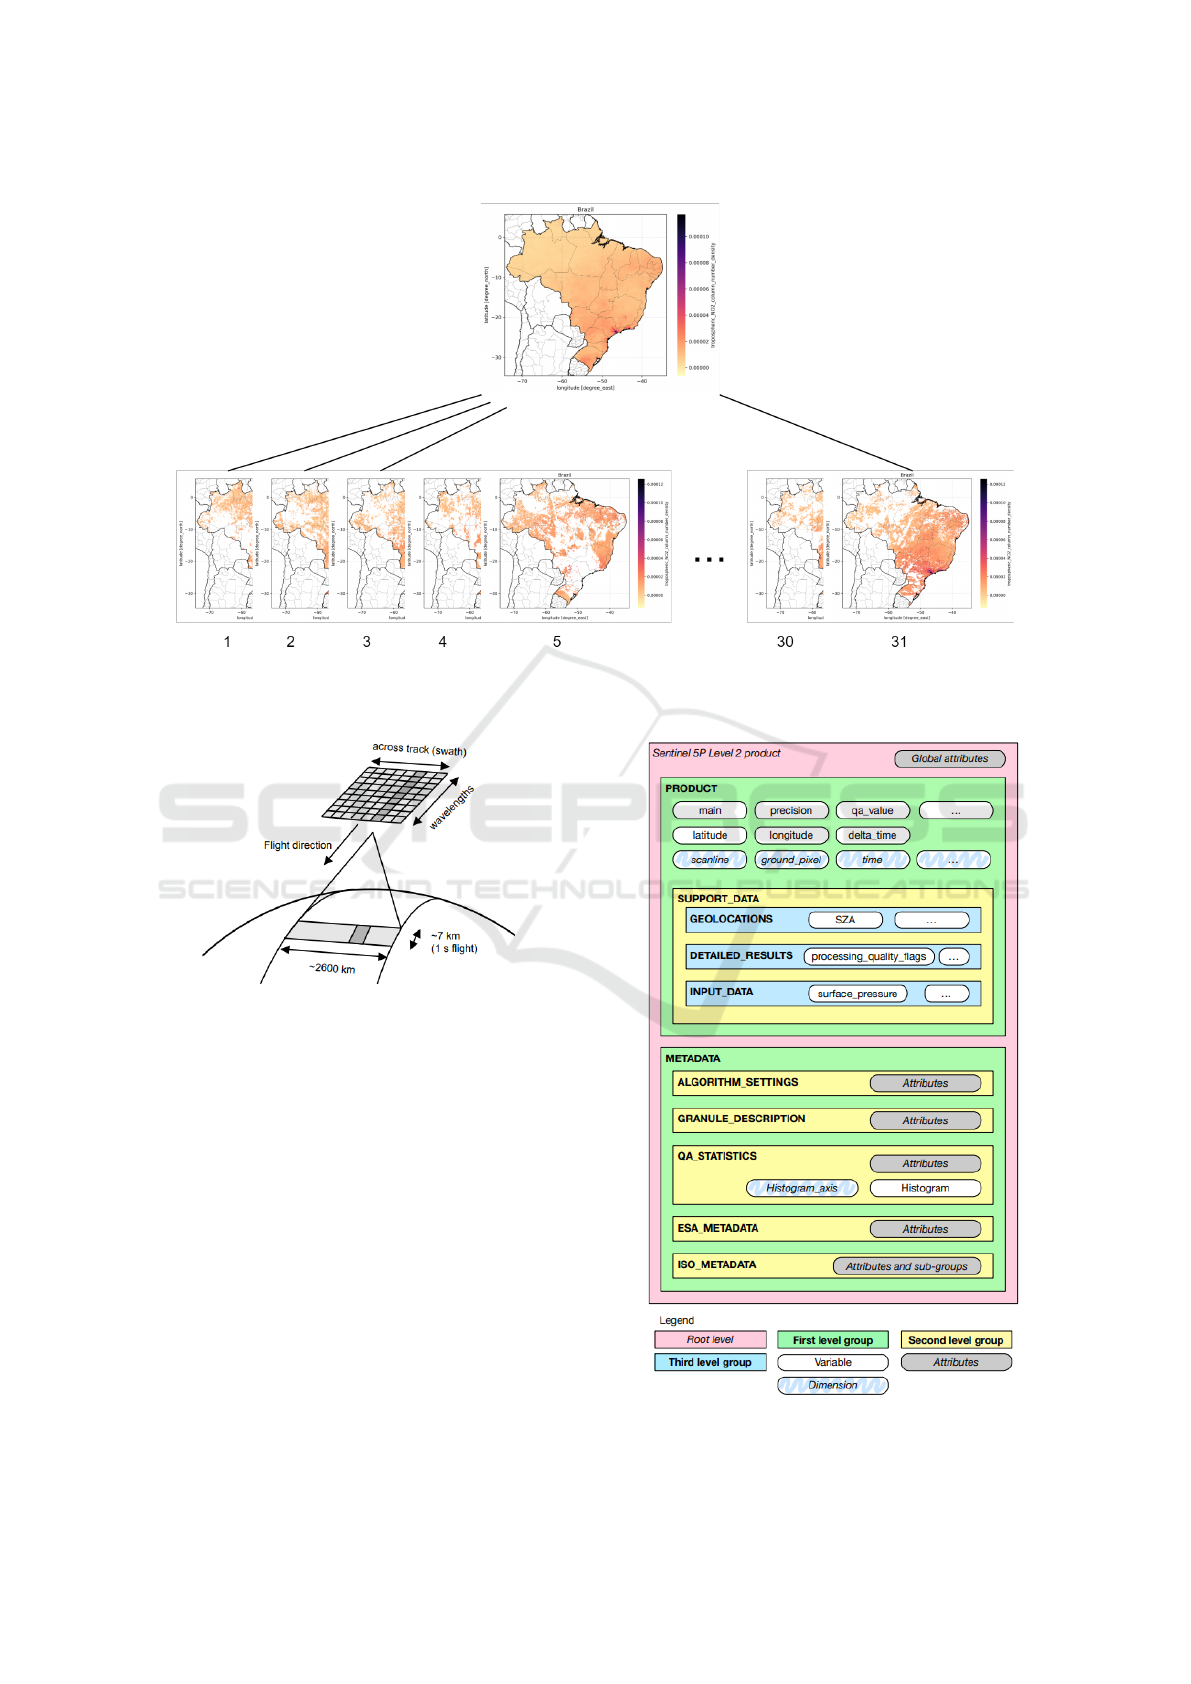
Figure 3: Images ordered chronologically, time interval of 31 days in the month of January, pollutant selected for the graphic
example: NO2.
Figure 4: TROPOMI measurement principle. The dark-
gray ground pixel is imaged on the two-dimensional detec-
tor as a spectrum. All ground pixels in the 2600km wide
swath are simultaneously measured (Veefkind et al., 2012).
within the files has a structure of groups and layers to
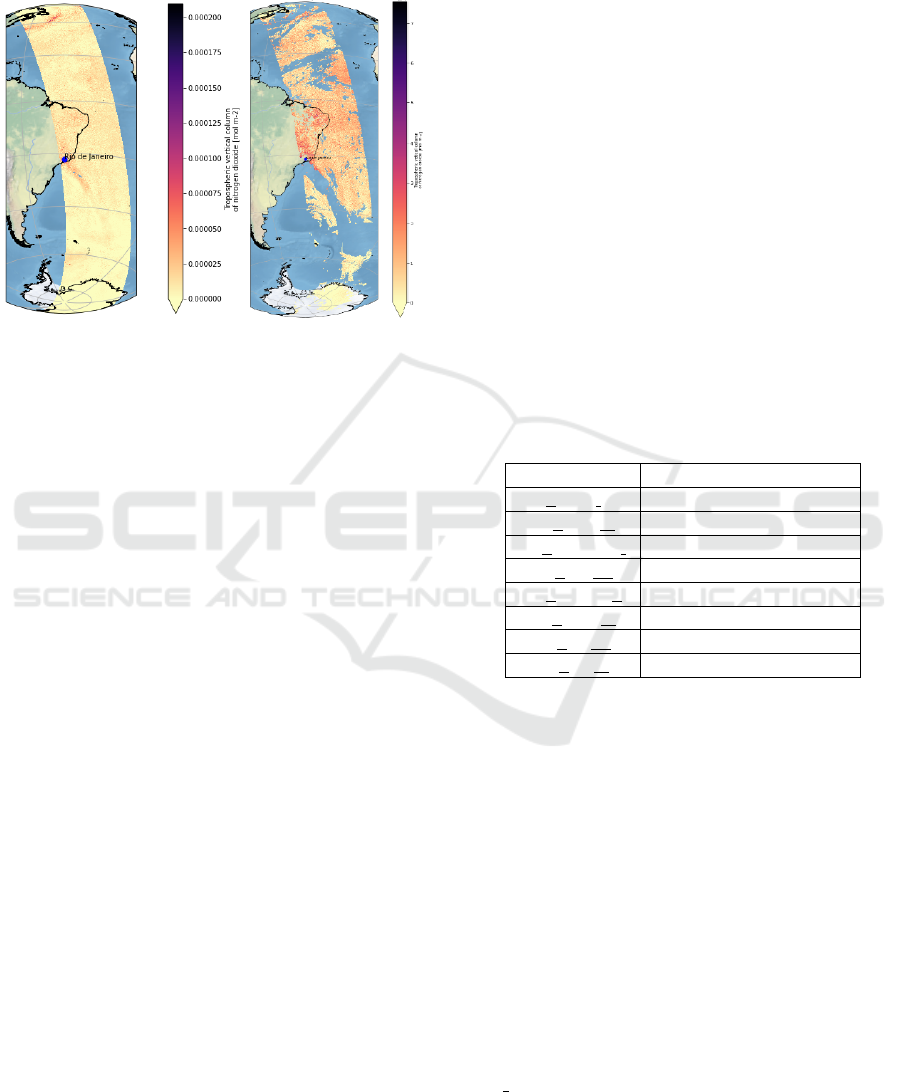
represent the data needed in the experiments. Figure
5 shows a ”.NC” generic file description for a Level-2
file.
3.4 Sentinel-5 Resolution
The main features of Sentinel-5 are a swath width of
2600km and a spatial Sampling of 7x7km, in addi-
tion to the multispectral capability that has already
been mentioned. Considering Brazil with an area of
8.510000 million km
2
as a geographical area of inter-
est, we obtain a two-dimensional matrix that repre-
sents the pollution information over the Brazilian ter-
ritory. This area can be represented visually as an im-
Figure 5: Description of the generic structure of Level-2
files (.nc) (The-European-Space-Agency, 2022).
On Granularity Variation of Air Quality Index Vizualization from Sentinel-5
715
age with an approximate resolution of 810x810 pix-
els, as shown in Figure 6. The resolution obtained
is more than sufficient to determine the indicators of
air pollutants in Brazil as a country as described in
the experiments section. There is the possibility of
carrying out a more detailed analysis of atmospheric
pollutants, that is, no longer considering Brazil as a
single region, if not carrying out a study on smaller
scales, considering each of the states as independent
regions as shown in Figure 7, in this research an anal-
ysis is also carried out using an even smaller scale,
considering all cities in Brazil. At this point in the re-
search, a new question arises: when the interest was
to analyze the pollutant indexes over a given city, the
quality of the indexes could be compromised by the
resolution provided in Figure 8, a graphic example
of the Sentinel-5 resolution considering the cities in
Brazil.
Figure 6: Sentinel-5 Data Resolution.
Figure 7: State of S
˜
ao Paulo.
Figure 8: Sao Paulo City.
4 IMPLEMENTATIONS
Hence, data provided by Sentinel-5 are two-
dimensional matrices. To determine the pollution
levels with high precision, the information from
Sentinel-5 must be geographically delimited and seg-
mented on the cartographic dataset where queries and
geographic information retrieval are essential. When
defining two levels of granularity (country, states), it
is necessary to define a step within the workflow that
can generate polygonal masks for all levels of gran-
ularity. So our basic architecture consists of a three-
step workflow: dataset processing, polygonal mask
generation, and region segmentation as shown in Fig-
ure 9.
4.1 Chronological Database Processing
Each file downloaded from Sentinel-5 has a size be-
tween 300MB and 500MB. Considering that each of
these files represents a range of readings for one day
of Sentinel-5, depending on the geographic area of
interest and the defined time interval, it is essential to
use more than one range to cover the entire area of
interest for one day. As said, our area of interest is
Brazil as a country. Thus, on some specific days it
is necessary to use up to three files to get all the es-
sential data. Then, it is expected that file sizes reach
gigabytes (GB) or terabytes (TB) quickly. An infor-
mation extraction process is carried out together with
temporal processing. The result of this first step is a
set of smaller files, simple to use and with informa-
tion on the selected pollutant in chronological order
as show in Figure 3.
VISAPP 2024 - 19th International Conference on Computer Vision Theory and Applications
716
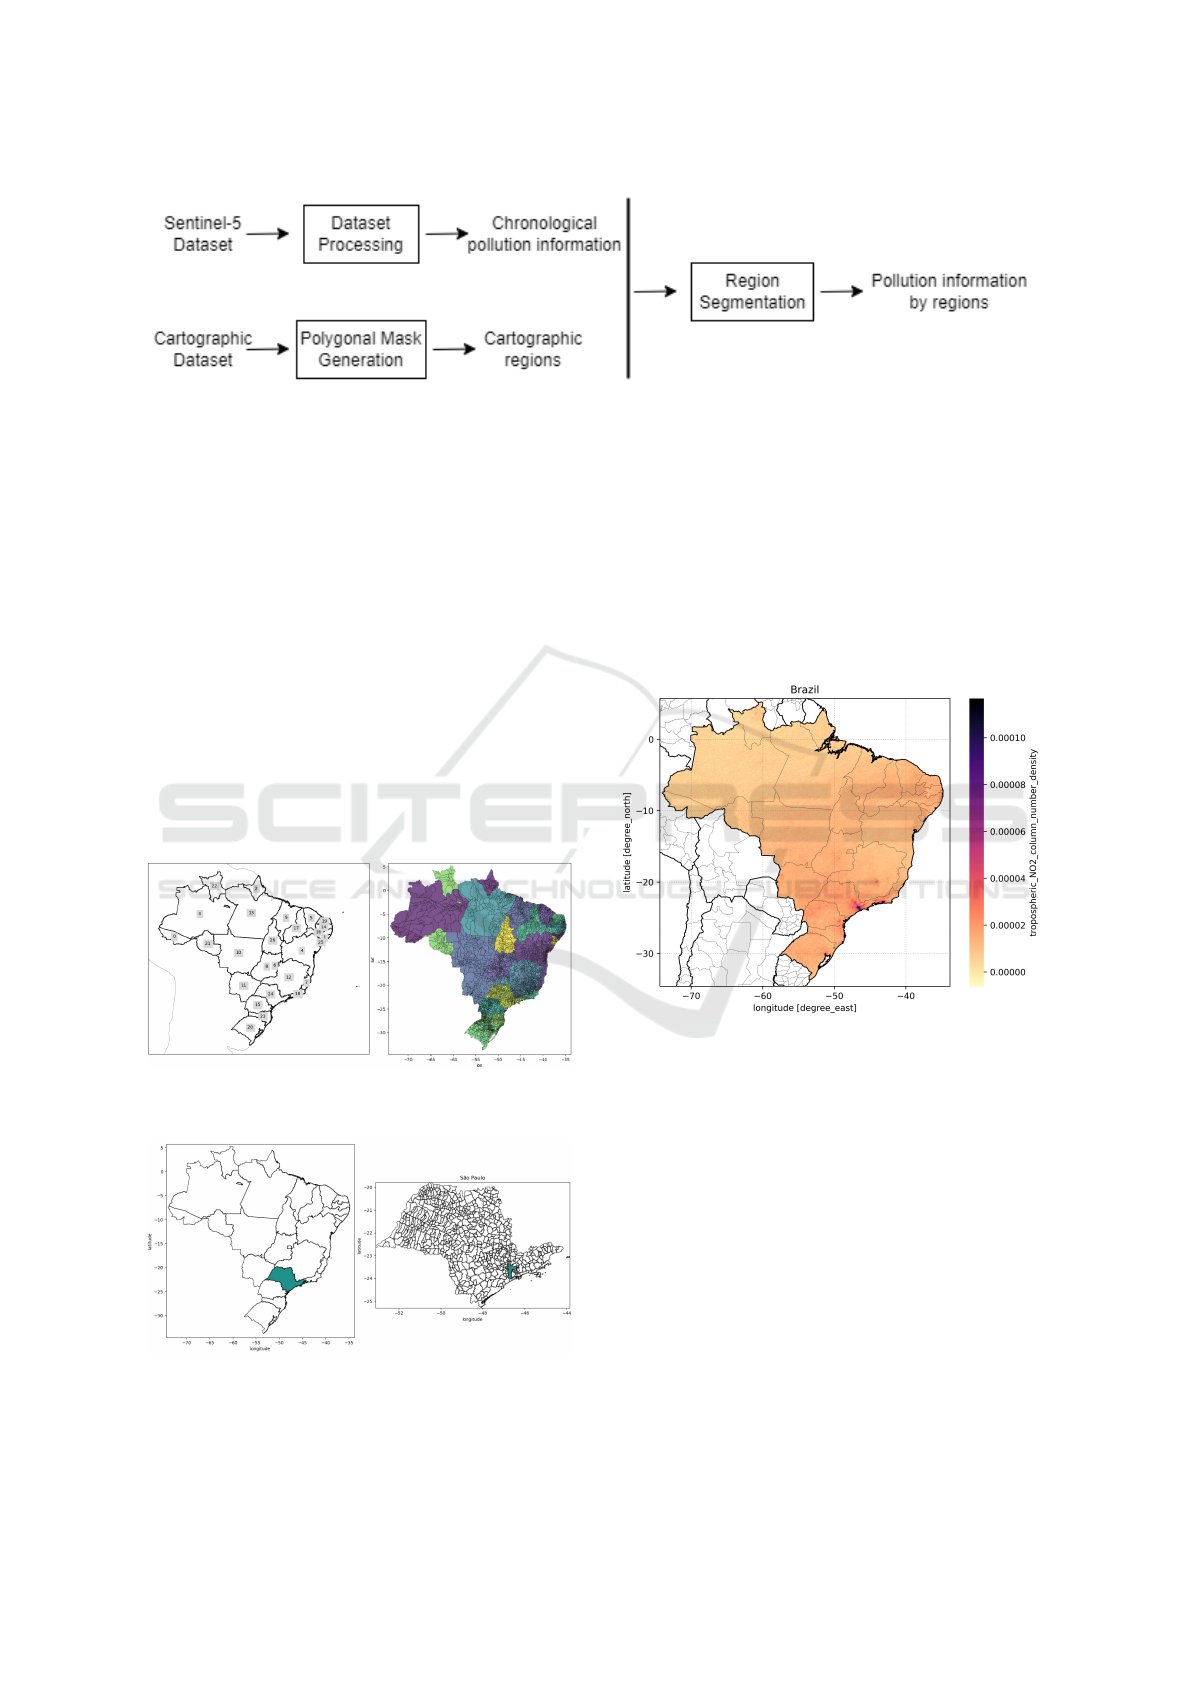
Figure 9: Workflow of our proposed methodology.
4.2 Polygonal Mask Generation
It is necessary to use a cartographic dataset, which
must contain geometric information for all previously
defined granularity levels. It is possible to generate
polygonal masks that will be used in the workflow’s
next step. The polygonal masks have a vital function
in achieving an accurate measurement of the pollutant
indicators. The two-dimensional data matrix is seg-
mented using the polygonal masks, depending on the
level of granularity the size of the data matrix is es-
sential to achieve an accurate delimitation. As an ex-
ample, Brazil’s mask as a country and the mask of the
state of S
˜
ao Paulo is shown in Figure 10. When the fo-
cus is to carry out a more detailed analysis in smaller
geographic areas, it is necessary to define masks with
a lower level of granularity, as an example is shown
in the masks of the city of Sao Paulo in Figure 11.
Figure 10: Granularity levels: states, masks to delimit the
geographic area of interest.
Figure 11: Granularity levels: cities, masks to delimit the
geographic area of interest.
4.3 Region Segmentation
The last step consists of using the results of the two
previous ones as input. The two-dimensional ma-
trix with the pollutant indicators is segmented using
polygonal masks. Each mask will be used depending
on the level of granularity. As an example, the seg-
mentation result is shown in Figure 12 for the country,
in Figure 7 for S
˜
ao Paulo state, and figure 8 for Sao
Paulo city.
Figure 12: Granularity levels: country, masks to delimit the
geographic area of interest.
5 EXPERIMENTS AND RESULTS
We have done a series of experiments in order to test
our proposal. In all of them, the levels of granular-
ity should be first defined. The used cartographic
database provides information for two levels of gran-
ularity. The first level is Brazil as a country and the
second level is the 27 states that compose it. The time
interval is set to 31 days, with intervals between Jan-
uary 1 and 31, of two years: 2019 and 2020. The se-
lected pollutant are AER, CH
4
, CO, NO
2
, O
3
. Where
any pollutant provided by Sentinel-5 in Table 1 can
be used in the workflow defined in Figure 9. As a re-
sult of the flow, we obtain the average pollutant index
On Granularity Variation of Air Quality Index Vizualization from Sentinel-5
717
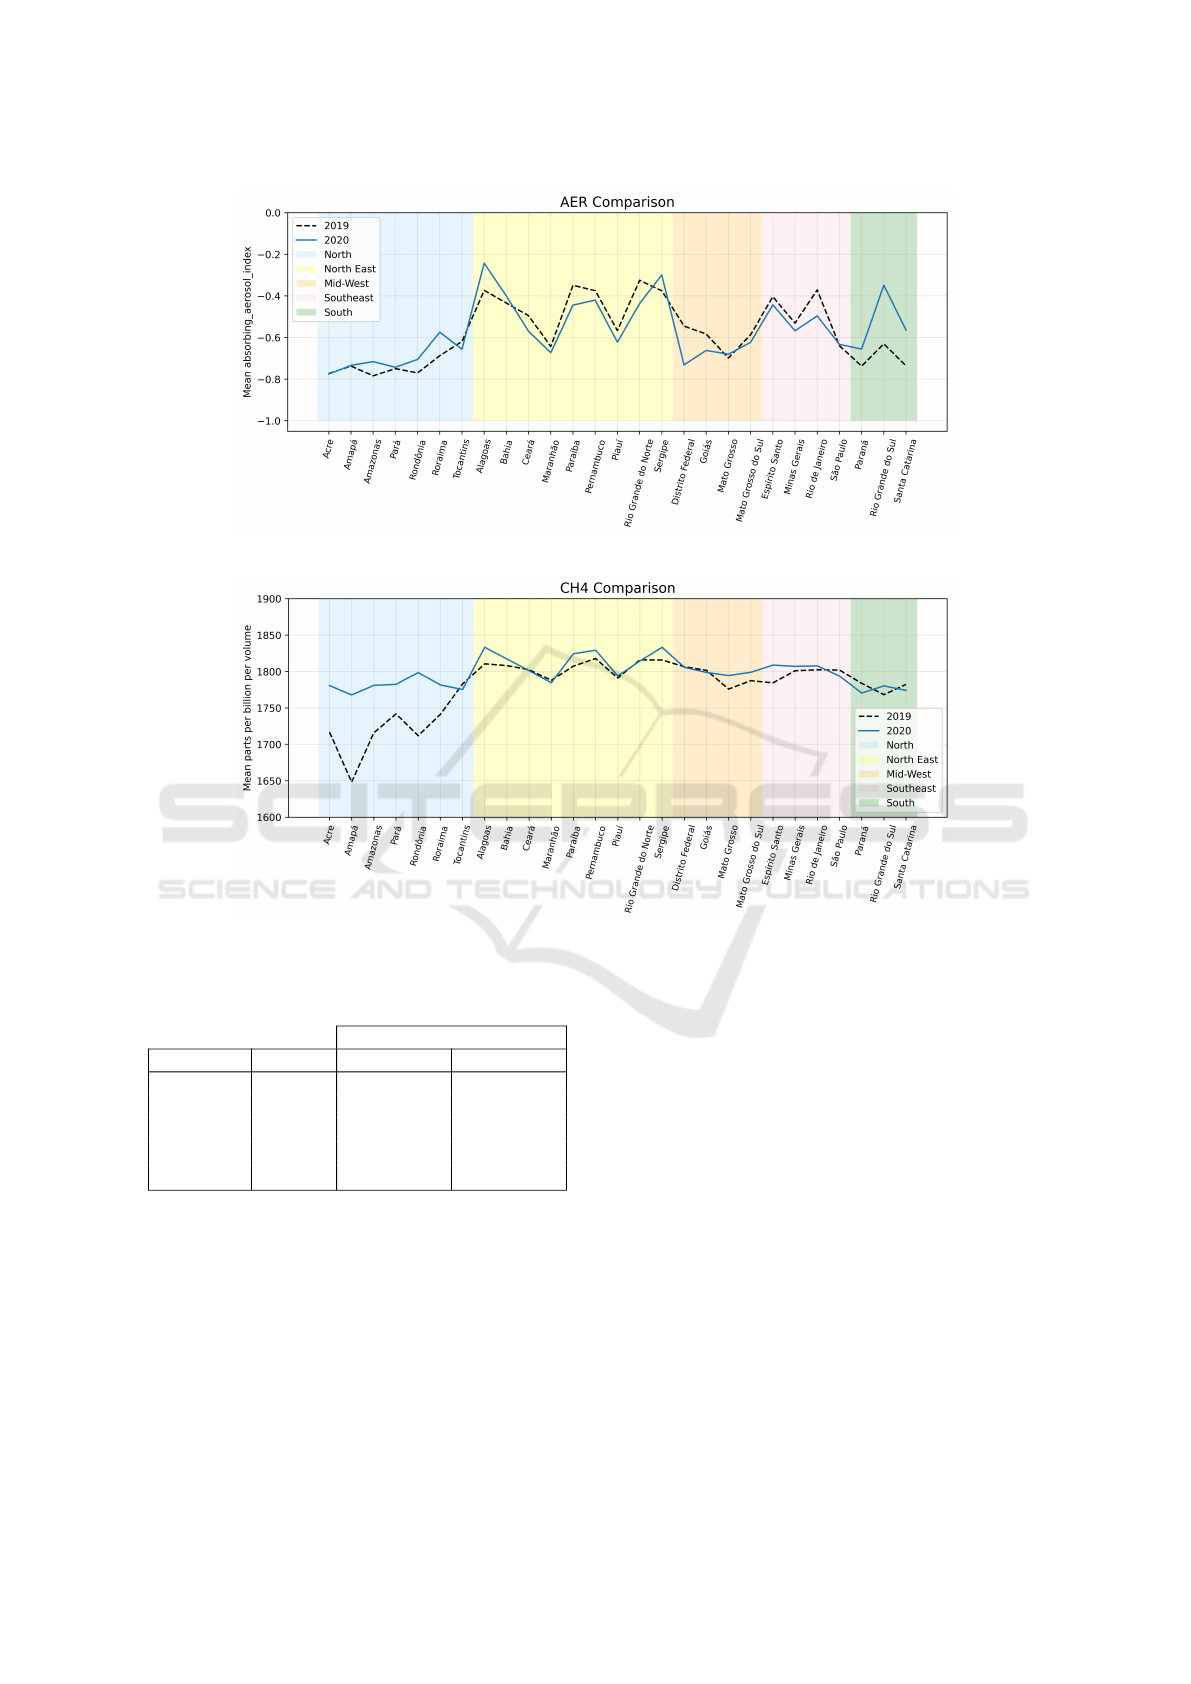
Figure 13: Aerosol index Absorsion in January 2019 and January 2020.
Figure 14: CH
4
column volume mixing ratio dry air comparation in January 2019 and January 2020.
Table 2: Mean value of air pollutant indexes in Brazil.
Brazil
Pollutant Unit 2019 2020
AER no unit -0.6575 -0.6358
CH
4
ppbv 1773.2306 1793.5013
CO mol/m
2
0.0281 0.0300
NO
2
mol/m
2
1.0700e-05 8.9800e-06
O
3
mol/m
2
0.117998 0.115422
for two-time intervals, January of 2019 and January
of 2020.
Based on the time intervals defined for the years
2019 and 2020, Table 2 and Figures 13 to 17 show
the average of AER, CH
4
, CO, NO
2
, O
3
indicators
obtained for the first level of granularity, that is, the
Brazilian country.
6 CONCLUSION
Sentinel-5 undoubtedly provided a significant ad-
vance on Earth data acquisition, making available to
researchers a large amount of information related to
the quality of the atmosphere. All these data can be
used for the analysis of pollutants individually, as it
was done in this research. As well it can be used for
an AQI analysis, by using all pollutant indicators pro-
vided by the Copernicus Data Space Ecosystem. An-
alyzing the results obtained, we can observe that the
resolution of the data is quite enough to determine av-
erage pollutant indicators for countries and states due
to their larger territory. Nevertheless, if an analysis is
necessary considering finer levels of granularity, such
as small cities, the quality of the measurements may
not be enough, and this has not been assessed yet.
Hence, to this end, we have shown how data from
the Sentinel-5 can help to increase reliability in the
VISAPP 2024 - 19th International Conference on Computer Vision Theory and Applications
718
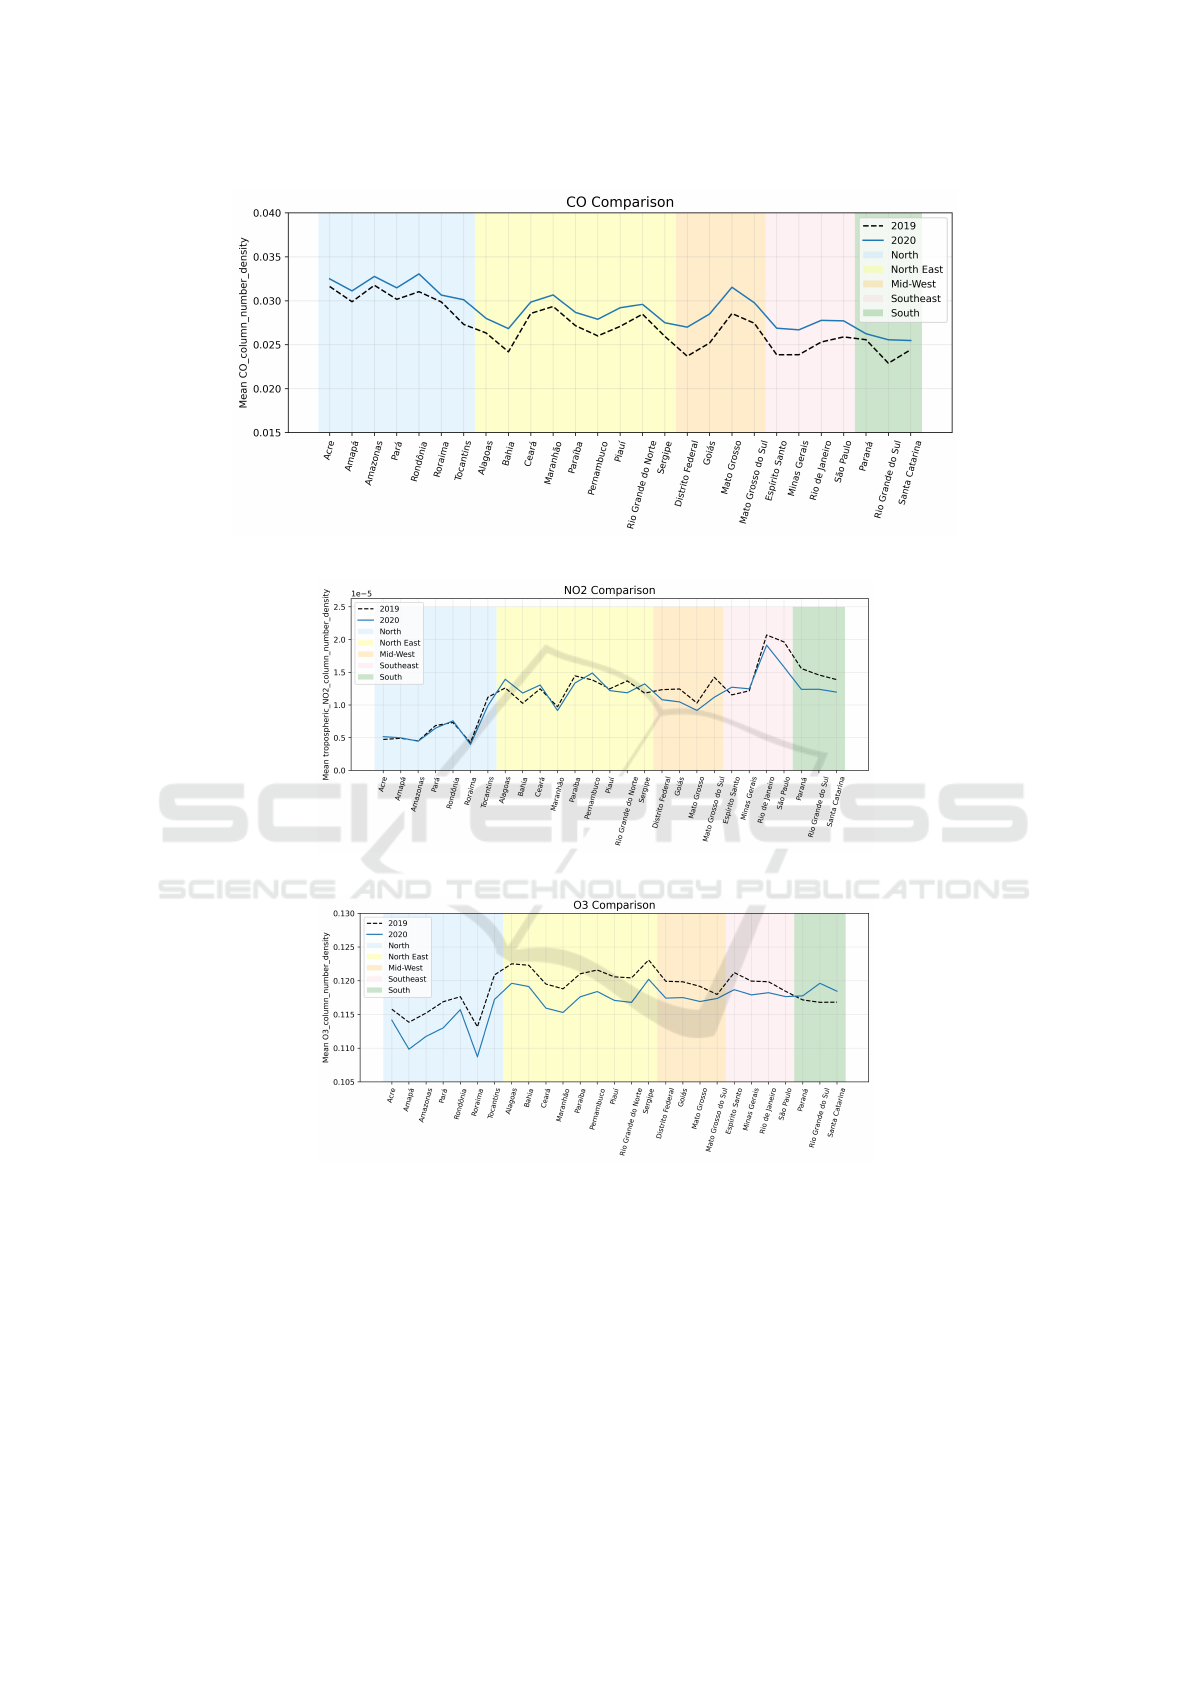
Figure 15: CO column number density in January 2019 and January 2020.
Figure 16: Tropospheric NO
2
column number density in January 2019 and January 2020.
Figure 17: O
3
column numberdensity in January 2019 and January 2020.
data quality, completing it where there is a lack of
more accurate sensor devices. Actually, this parame-
ter has been used by our data scientists for predicting
the dynamics prediction of Covid-19, increasing con-
fidence in their results.
In future work, we intend to study how interpola-
tion and extrapolation techniques can be used in order
to devise a more reliable value when a finer granular-
ity is necessary for these data. We believe that using
splines or other mathematical surfaces could play an
important role in this process. Indeed, the use of deep
learning is another option that will be studied for this.
REFERENCES
Arag
˜
ao, D. P., Oliveira, E. V., Bezerra, A. A., dos Santos,
D. H., da Silva Junior, A. G., Pereira, I. G., Piscitelli,
P., Miani, A., Distante, C., Cuno, J. S., Conci, A., and
Gonc¸alves, L. M. (2022). Multivariate data driven pre-
On Granularity Variation of Air Quality Index Vizualization from Sentinel-5
719

diction of covid-19 dynamics: Towards new results
with temperature, humidity and air quality data. Envi-
ronmental Research, 204:112348.
Fermo, P., Art
´
ı
˜
nano, B., De Gennaro, G., Pantaleo, A. M.,
Parente, A., Battaglia, F., Colicino, E., Di Tanna, G.,
Goncalves da Silva Junior, A., Pereira, I. G., Garcia,
G. S., Garcia Goncalves, L. M., Comite, V., and Mi-
ani, A. (2021). Improving indoor air quality through
an air purifier able to reduce aerosol particulate matter
(pm) and volatile organic compounds (vocs): Experi-
mental results. Environmental Research, 197:111131.
Hanoi, W.-A.-Q.-I. (2022). Hanoi air quality index (aqi)
and vietnam air pollution. Online resource, available
at https://www.iqair.com/, accessed on 08.10.2022.
NASA (2022). Health and air quality data pathfinder - open
access for open science earth data. Online resource,
available at https://www.earthdata.nasa.gov/learn/
pathfinders/health-and-air-quality-data-pathfinder,
accessed on 08.10.2022.
Pereira, I. G., Guerin, J. M., J
´
unior, A. G. S., Garcia, G. S.,
Piscitelli, P., Miani, A., Distante, C., and Gonc¸alves,
L. M. G. (2020). Forecasting covid-19 dynamics in
brazil: A data driven approach. International Journal
of Environmental Research and Public Health, 17:1–
26.
Piscitelli, P., Miani, A., Setti, L., De Gennaro, G., Rodo, X.,
Artinano, B., Vara, E., Rancan, L., Arias, J., Passarini,
F., Barbieri, P., Pallavicini, A., Parente, A., D’Oro,
E. C., De Maio, C., Saladino, F., Borelli, M., Col-
icino, E., Gonc¸alves, L. M. G., Di Tanna, G., Colao,
A., Leonardi, G. S., Baccarelli, A., Dominici, F., Ioan-
nidis, J. P., and Domingo, J. L. (2022). The role of out-
door and indoor air quality in the spread of sars-cov-2:
Overview and recommendations by the research group
on covid-19 and particulate matter (rescop commis-
sion). Environmental Research, 211:113038.
Project, R.-T.-A.-Q.-I. (2022a). Air pollution: Real-time
air quality index (aqi). Online resource, available
at https://aqicn.org/city/vietnam/hanoi/, accessed on
08.10.2022.
Project, W.-A.-P. (2022b). Air quality index (aqi) and
pm2.5 air pollution. Online resource, available at
https://www.iqair.com/, accessed on 08.10.2022.
Scale, A. Q. (2022). World’s air pollution: Real-time air
quality index. Online resource, available at https://
waqi.info/, accessed on 08.10.2022.
The-European-Space-Agency (2022). Sentinel-5. On-
line resource, available at https://sentinel.esa.int/web/
sentinel/missions/sentinel-5, accessed on 08.10.2022.
Veefkind, J., Aben, I., McMullan, K., F
¨
orster, H., de Vries,
J., Otter, G., Claas, J., Eskes, H., de Haan, J., and Lev-
elt, P. (2012). Tropomi on the esa sentinel-5 precursor:
A gmes mission for global observations of the atmo-
spheric composition for climate, air quality and ozone
layer applications. Remote Sensing of Environment,
120:70–83. The Sentinel Missions - New Opportuni-
ties for Science.
VISAPP 2024 - 19th International Conference on Computer Vision Theory and Applications
720
