
Machine Learning-Based Optimization of E-Commerce
Advertising Campaigns
Arti Jha
a
, Pratyut Sharma, Ritik Upmanyu, Yashvardhan Sharma and Kamlesh Tiwari
Dept. of Computer Science and Information System, Birla Institute of Technology and Science, Pilani, India
Keywords:
Machine Learning-Based ad Optimizer, Ad Campaign Optimization, ACOS Analysis, K-Means Clustering,
Probabilistic ACOS, Profitability, Performance Forecasting.
Abstract:
E-commerce platforms facilitate the generation of advertisement campaigns by retailers for the purpose of pro-
moting their products. Marketers need to generate demand for their products by means of online advertising
(ad). Game theoretic and continuous experimentation feedback-based advertising optimization is imperative
to enable efficient and effective advertising at scale. To address this, we propose a solution that utilizes ma-
chine learning and statistical techniques to optimize e-commerce ad campaigns, intending to create an optimal
and targeted ad campaign strategy. The dataset utilized here is Amazon’s e-commerce dataset obtained from a
prominent e-commerce firm. The proposed work examines these key approaches: For predicting profitability
and campaign impressions, we implemented a model using the first approach, blending statistical techniques
with machine-learning algorithms. The results provide a comparison between the algorithms, offering in-
sights into the observed outcomes. In the second approach, we leverage the k-means clustering algorithm
and Bayesian Information Criterion (BIC) technique to establish a correlation between keyword performance,
campaign profitability, and bidding strategies. In the concluding approach, we introduce an innovative model
that uses Joint Probability Distribution and Gaussian functions to determine the profitability of ad campaigns.
This model generates multivariate-density graphs, enabling a comprehensive exploration to better compre-
hend and predict profitability, specifically in terms of Return on Ad Spend (ROAS). For example, we can now
answer questions like: How do the profitability (ROAS) and awareness (%impression share) of a campaign
change with variations in the budget? How do the profitability (ROAS) and awareness (%impression share) of
a keyword change with different bid values? These insights provide valuable information for optimizing cam-
paign performance and making informed decisions regarding budget allocation, bid adjustments, and overall
campaign structure. The results offer practical insights for optimizing an ad campaign’s performance through
developing effective and targeted strategies.
1 INTRODUCTION
E-commerce growth has exploded over the last
decade, and advertising has become ever so compet-
itive, real-time, and microscopic. The products are
increasing rapidly, there’s a constant flux of new cus-
tomers, and the behavior of old customers is also
changing. In this experiment, we are researching
and analyzing Amazon’s e-commerce data to make
real-world changes in the algorithms to optimize their
campaigns by applying Machine Learning and statis-
tics on the real-time e-commerce data from Ama-
zon and ultimately make an automated system that
can enable goal-oriented, semi-supervised advertising
across channels at scale. Table 1 shows the phases and
a
https://orcid.org/0009-0003-5868-2200
model requirements during the initial product devel-
opment planning. Each phase below acts as a step-
ping stone to unlocking the subsequent phase. The
first phase would unlock value even for existing data
and will help build confidence for optimization ef-
forts next. The current scope would include a part
of phase 1 i.e. Identifying and explaining the im-
pact of changing input variables on the output metrics
[ %impression share, ACOS - Advertisement Cost
of Spend/ ROAS - return on adspend] across cam-
paigns. We have used ACOS predominantly to mea-
sure the performance of a campaign, which is com-
plimentary to ROAS, along with other metrics like
Click-through Rate (CTR) and Impressions (Aware-
ness). There are many parts of this big umbrella
problem of building a campaign optimizer. The ex-
Jha, A., Sharma, P., Upmanyu, R., Sharma, Y. and Tiwari, K.
Machine Learning-Based Optimization of E-Commerce Advertising Campaigns.
DOI: 10.5220/0012456700003636
Paper published under CC license (CC BY-NC-ND 4.0)
In Proceedings of the 16th International Conference on Agents and Artificial Intelligence (ICAART 2024) - Volume 2, pages 531-541
ISBN: 978-989-758-680-4; ISSN: 2184-433X
Proceedings Copyright © 2024 by SCITEPRESS – Science and Technology Publications, Lda.
531

Phases Abilities Aspects
Identify,
Explain, and
test the un-
derstanding
Identity,
explain, ex-
periment, and
measure
Causality and
attribution;
Modeling;
A/B testing;
Measurement
Build con-
fidence and
decision
framework
Model, con-
fidence,
impact to
enable semi-
supervised
execution
Constraint
aware op-
timization;
Risk-averse
and acting
only where
confident
Figure 1: Phases and model requirements.
pected output was to make Joint probability curves
at the keyword/campaign level, having multi-variate
density graphs for easier understanding and explain-
ability. The probability analysis allows us to under-
stand the relationship between input metrics (such as
bids and budgets) and output metrics (such as ROAS,
%impression share, and ACOS) at the campaign and
keyword level. We started off with profitability pre-
diction using machine learning algorithms like Linear
Regression, Random Forrest, and Support Vector Re-
gressor and applied Depp learning methods such as
Long short-term memory (LSTM) and Gated Recur-
rent Unit (GRU) in order to understand the change
in output variable, with change in input variable. On
the same line, we also clustered similar campaigns
based on their ACOS values and analyzed the other
Key Performance Indicators in such campaigns. Ulti-
mately, keeping our objective in mind, we utilized the
Gaussian function to create joint probability curves.
By leveraging the joint probability curves and multi-
variate density graphs, we were able to visualize and
explain how changes in input metrics impact the out-
put metrics.
1.1 Objective and Main Contribution
In this ever-competitive world, taking the help of Ar-
tificial Intelligence and Machine learning is not an
option but a necessity. Game theoretic and continu-
ous experimentation feedback-based advertising opti-
mization is imperative to enable efficient and effec-
tive advertising at scale. We aim to build a machine
learning-based model to analyze and improve the ef-
ficiency of a brand’s Amazon-based Ad campaigns.
To identify and explain the impact of changing input
variables on the output metrics across campaigns. Ul-
timately, the goal is to build a machine learning-based
model that can analyze and improve the efficiency of
Amazon’s ad campaigns while ensuring constraint-
aware optimization and risk-averse decision-making.
From the research point of view, this project offers
several areas of investigation, such as Algorithmic op-
timization; Auditing and accountability; Experimen-
tal design and evaluation; Business and marketing im-
plications; and Explainability.
2 BACKGROUND
2.1 Amazon Campaigns
Amazon, as an e-commerce platform, provides a
bidding-based advertising model for advertisers to
reach out to their potential audience. Advertisers
can launch various types of advertisement campaigns
through the Amazon advertising portal and analyze
relevant metrics through the same portal. The flow
of advertisements varies throughout e-commerce plat-
forms. One could comprehend their advertising en-
vironment by looking at the extremely intricate pro-
cesses used by platforms such as Amazon. The fol-
lowing are some sources that helped make sense of
Amazon’s ad campaign ecosystem (Amazon, 2022a),
(Amazon, 2022b), (Amazon, 2022c).
• Types of Campaigns:
1. Sponsored product advertisements can closely
mimic organic listings and can be found on
product listing and search results pages. 66%
of sellers utilize this kind of Amazon PPC ad-
vertisement, making it the most popular.
2. Sponsored Brand ads are cost-per-click adver-
tisements for brands that show up in shop-
ping results with a personalized headline, logo,
and many products. Sellers can simultaneously
raise awareness of many products with spon-
sored brand advertisements.
3. Sponsored Display advertising lets sellers re-
target customers who have visited their product
detail pages on and off Amazon. They can be
found on Amazon’s associate websites, such as
Google, Facebook, Netflix, and mobile apps, in
contrast to Sponsored Products and Sponsored
brand ads.
3 RELATED WORK
The optimization of advertisement content is the pri-
mary focus of some solutions, whereas the optimiza-
tion of advertisement spending and channel target-
ing is the primary focus of other solutions. Research
ICAART 2024 - 16th International Conference on Agents and Artificial Intelligence
532

has been conducted for budget optimization and dis-
tribution in online advertising (Aronowich et al., )
to formulate a stochastic version of the budget op-
timization problem. (Muthukrishnan et al., 2007)
tried to encapsulate machine learning techniques with
second price auction theory to determine “the cor-
rect price to ensure that the right message is deliv-
ered to the right person, at the right time”. (Perlich
et al., 2012) focussed their research on bid optimiza-
tion while developing an online approach to optimize
the key performance metrics and satisfy the smooth
delivery constraint for each campaign. In the paper
(Akande and Haq, ), They have employed the su-
pervised learning method, which involves learning a
function that converts an input (xi) to an output (yi).
Binary or multi-class supervised learning is also pos-
sible. For managing categorical data, they directly
one-hot-encoded the feature value into a numeric vec-
tor. An approach based on logistic regression: One of
the earliest attempts to train models to predict user
reaction from input categorical variables was logis-
tic regression, given an input dataset containing ‘d’
instances of (xi,yi), where xi, 0, and yi, 1 is an n-
dimensional feature vector. This approach predicts
the binary output value using a linear combination of
coefficient values and the sparse binary input feature
vector. The Sigmoid Function is used in many pa-
pers to estimate the anticipated probability of class
membership. (
ˇ
Solt
´
es et al., 2020) focus on optimizing
online ad campaigns using logistic regression. Two
statistical methods, namely logistic regression and
degree-2 polynomial, have been utilized in the adver-
tising click-through rate prediction literature, such as
in (Yan et al., 2021) (Richardson et al., 2007), (Ling
et al., 2017), (Juan et al., 2016). These methods have
been used to investigate a variety of factors that in-
fluence users’ response behaviors toward advertising
(e.g., clicks). An approach based on an ensemble of
machine learning models has been suggested by cer-
tain studies that demonstrate the potential for subpar
outcomes when using a single machine learning tech-
nique. (Rafieian and Yoganarasimhan, 2021) imple-
mented an Xgboost model based on user behavioral
patterns. Generally, the design of ensemble models
can be divided into four sections: Bagging and Boost-
ing, Stacked, Generalization, and Cascading. The av-
erage click-through rate increased by 66.80% using
their targeting policy method compared to the contex-
tual system. The goal is to accurately forecast user
reaction using user behavior to estimate the click-
through rate. (Jha et al., 2023) presents a biblio-
metric analysis of CTR techniques used in the last
decade. Spatio-temporal models to estimate click-
through rates in the context of content recommenda-
tion were proposed by (Agarwal et al., 2009). The
XGBDeepFM model for the same was applied by (An
et al., 2020). The efficiency of XGBDeepFM outper-
forms most deep neural network models. This work
(Chan et al., 2018) shows that embedding feature vec-
tors with different sequences provides useful infor-
mation for CNN-based CTR prediction. In this pa-
per (Chen et al., 2016b), they show that it is possible
to derive an end-to-end learning model that empha-
sizes both low- and high-order feature interactions.
(Avila Clemenshia and Vijaya, 2016), (Chen et al.,
2016a), (Chen et al., 2019), (Xiao et al., 2020), (Zhou
et al., 2018), (Huang et al., 2019), (Chapelle et al.,
2014) worked on predicting CTR and conversion rates
in a similar manner using different machine learn-
ing models trying to improve efficiency. (Qin et al.,
2020) store and retrieve user behaviors using a stan-
dard search engine strategy. Apart from the literature
reviews from published papers, there were several ar-
ticles and newsletters that really helped in understand-
ing the working of many methods, which were oth-
erwise not easily grasped (Amazon, 2022a)(Vidhya,
2023)(Kumari and Toshniwal, 2021)
4 PROPOSED TECHNIQUES AND
ALGORITHMS
In the context of Amazon campaigns, profitability is
a measure of advertisement sales relative to the cost.
Several metrics can be used to quantify profitability,
like Return on Ads-Spend(ROAS) or Advertisement
Cost of Sales(ACOS). For this research, we will use
ACOS to measure profitability.
ACOS =
Cost O f Ad
Sales T hrough Ad
∗ 100 (1)
Here, we divided the profitability prediction into three
experiments. The first two utilize several benchmark
machine learning algorithmic techniques, while the
third one optimizes ad campaigns using probabilistic
techniques, something which we have proposed. The
models used in the first experiment include:
• Recurrent Neural Network (RNN): Neural net-
works with RNNs are made to handle sequen-
tial data. When processing and forecasting time-
series data, like the e-commerce advertising cam-
paigns, it is especially helpful.
• Long Short-Term Memory (LSTM): As a kind of
RNN, it has the ability to learn long-term depen-
dencies, which makes it a good fit for e-commerce
advertising campaigns that aim to forecast impor-
Machine Learning-Based Optimization of E-Commerce Advertising Campaigns
533

tant campaign metrics like Impressions, CTR, and
ACOS.
• Gated Recurrent Unit (GRU): is another type of
RNN that is similar to LSTM but is simpler and
faster to train. GRU networks are designed to han-
dle sequential data and can learn long-term depen-
dencies.
• Linear Regression (LR): LR is a simple and
widely used algorithm for regression problems.
It is particularly useful for predicting continuous
variables, such as ACOS, CTR, and Impressions
• Gradient Boosting (GB): Regression and classi-
fication issues are addressed by it. In order to
produce a strong model, it combines several weak
models.
• Random Forrest (RF): RF is an algorithm that
makes use of learning from multiple decision trees
and then ensembles them into a single decision
model. It is an ensemble-based learning algo-
rithm. It works really well when compared to
many benchmark models too.
Why LSTM, GRU, RNN?
RNNs are a family of artificial neural networks in
which node-to-node connections can produce a cycle,
allowing the output of one node to influence the input
of another node later on. It lets it display temporally
dynamic behavior as a result. GRUs are an improved
version of standard recurrent neural networks. What
makes them unique is their ability to be trained to re-
tain long historical data without erasing it after a cer-
tain time and it doesn’t eliminate data that is unrelated
to the forecast. LSTM is also very similar to GRU
but a little more complex and more preferred for large
datasets. RNNs are designed to work with sequential
data. Sequential data (can be time series) can be in the
form of text, audio, video, etc. RNNs face short-term
memory problems, also known as the vanishing gra-
dient problem. As RNN processes more steps, it suf-
fers from vanishing gradients more than other neural
network architectures. To overcome this, two special-
ized versions of RNN were created. They are GRU
and LSTM. The rationale for using these models is
that they have been shown to be effective in forecast-
ing measures such as ACOS, CTR, and Impressions,
which are important KPIs for e-commerce advertis-
ing campaigns. For the second experiment, we used
the campaign Optimization using the Clustering ap-
proach. In this experiment, we establish a correlation
between keyword performance, profitability of a cam-
paign, and bidding strategies. The methods used in
this experiment include:
• Hopkins Statistic: This test was used to evaluate
the tendency of the data after its suitability for
clustering was determined.
• Bayesian Information Criterion (BIC): This
method is used to determine the optimal number
of clusters. The BIC evaluates the fit of various
clustering models while penalizing model com-
plexity.
• K-means clustering: This algorithm is used to
cluster the campaigns based on their ACOS val-
ues. Campaigns with similar ACOS values are
clustered together, which makes it easier to ana-
lyze such campaigns based on other KPIs as well.
Finally, we focused on the relationship between
ACOS and CPC of these selected campaigns. For
the third experiment, We classified the campaign key-
word combination into different CPC bands based on
their past CPCs. For each of these CPC bands, we
made a frequency histogram of ACOS values. From
this histogram, we identified the probability of certain
ACOS or lower. The Gaussian probability method
was used to achieve this. In conclusion, we found the
third experiment to be the most feasible and reliable,
keeping explainability as an important aspect. These
experiments have been defined and explained in detail
in the below section.
5 EXPERIMENTAL DETAILS
We begin with the experimental setup, dataset de-
scription, and some analysis followed by detailed ex-
periments.
5.1 Experimental Setup
The project utilized Python programming language,
Jupyter Notebook, and Google Colab for code devel-
opment and data analysis. TensorFlow and PyTorch
were used as deep learning frameworks to train and
build machine learning models. Including GPUs fur-
ther accelerated the training process, enhancing the
efficiency of the project.
5.2 Dataset Description
Raw Data. This experiment uses retail data obtained
from a prominent e-commerce corporation as its data
source. The data consists of 2 million rows and com-
prises seven tables. Both numerical and categorical
types of data are present. We have used multiple
product datasets for brands like ‘Colgate’, ‘Nature’s
Bounty’, and ‘Spinmaster’. For this experiment’s pur-
pose, we used these attributes: Keyword ID (Iden-
tifier), Keyword Text, Match Type (Exact, Broad,
ICAART 2024 - 16th International Conference on Agents and Artificial Intelligence
534
Phrase), Keyword Bid (Bid we place on a particu-
lar keyword text), Keyword Status (Enabled, Paused),
Campaign ID (identifier), Campaign Name, Cam-
paign Budget, Campaign Status (Paused, enabled),
Clicks, Impressions (Number of views generated, on
keyword as well as campaign level), Conversions (To-
tal consumers who became a customer), Sales (in var-
ious ways like Attributed sales within 7 days, 14 days,
and 21 days, which denotes the time frame within
which an item was sold after it was clicked by a user).
5.2.1 Exploratory Data Analysis (EDA)
EDA was performed on the dataset, and table 1 shows
the data description for some attributes.
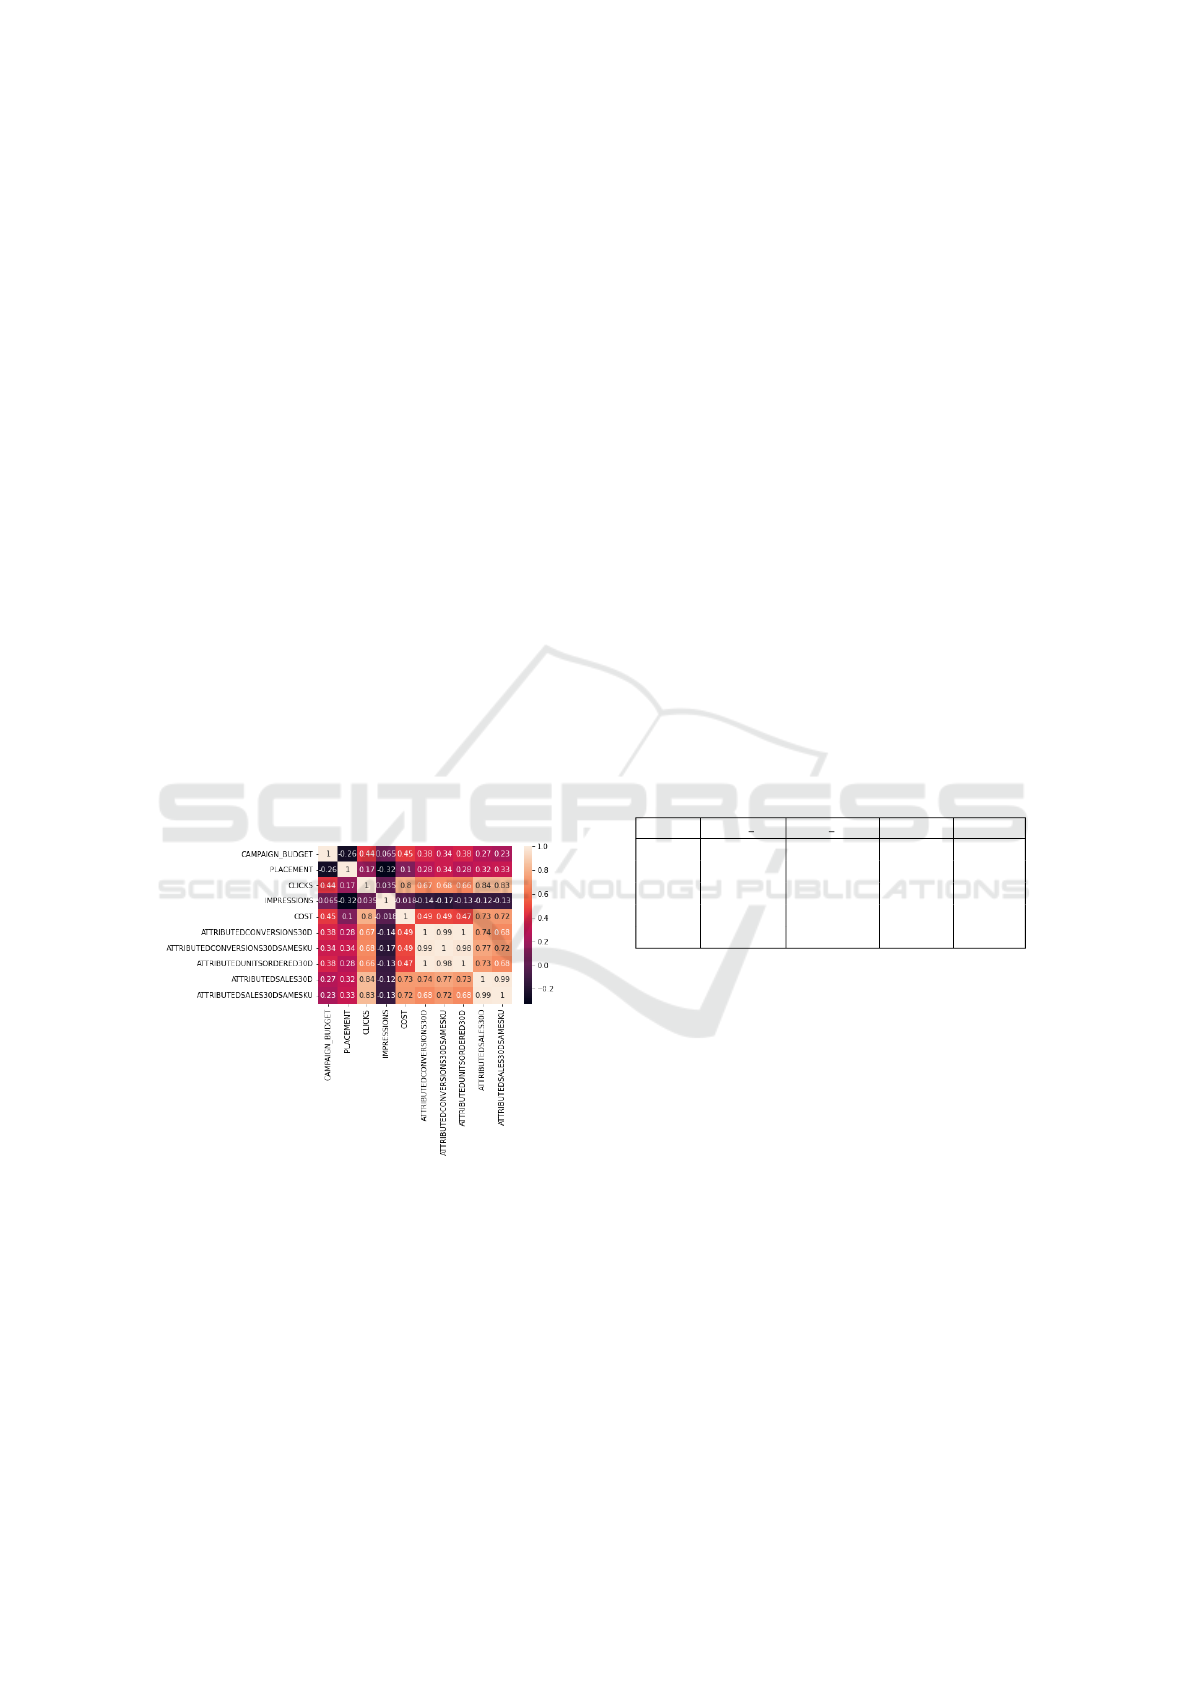
The correlation matrix is shown in the figure (2)
between attributes of the dataset that we use in our ex-
periments predominantly. After getting the data into
the desired format for the initial experiments, we had
90k rows of data, but after further cleaning and pre-
processing, we had only 56k rows remaining. Be-
cause the missing values only account for a small part
of the total data, the rows that have missing data were
deleted. Following this, the data is grouped on key-
word level and divided into a quarter of a year. Key-
word Status for all these campaigns was kept enabled.
The match type for keywords was chosen to be “Ex-
act” for this experiment’s purpose.
Figure 2: Correlation matrix representing the relationship
between important attributes.
5.3 Experiment 1: Profitability
Prediction Using Machine Learning
The first case study uses machine learning algorithms
to forecast important indicators in e-commerce adver-
tising campaigns. After a thorough literature review,
we found out that after testing for correlation, some
deep learning models like LSTM, GRU, and RNN
can help predict profitability. However, the results
of those models were not easily explainable, and the
data required was quite large. Hence, we resorted to
first using simpler ML models like linear regression
and SVM to classify the profitability into some prede-
fined classes (this simplifies our problem into a clas-
sification problem). We then also tried the aforemen-
tioned DL models to compare the results. We used
keyword-level data with the following parameters-
Impressions, Clicks, Cost Per Click (CPC), Sin, and
cos of day, week, month, and quarter of the year were
considered, given their cyclical nature. In total, we
had 56k rows of data but after cleaning it up, we had
only 29k rows remaining. The correlation analysis of
past impressions with our output variable (ACOS) has
been presented in figure 3. Taking logs of both CPC
as well as ACOS shows some relationship (it might
be due to heteroskedasticity as variance seems to be
increasing). As we found out, the correlation coeffi-
cient between the log of past impressions and the log
of ACOS is significant; thus, it is proved that more
past impressions result in more ACOS. This can be
directly used in the decision-making process of the
company for bidding higher on the campaign keyword
combination, which has more past impressions.
Table 1: Exploratory Data Analysis on Important At-
tributes.
Cam ID Avg Cost Sales ACOS
count 3 ×10
3
3934 3934 3934
mean 1 × 10
17
0.31 0.62 0.31
std 5 × 10
13
4.08 5.77 2.00
min 1 × 10
17
0.00 0.00 0.00
max 1× 10
17
136.45 189.40 74.01
5.3.1 Error Analysis
• For analyzing the results of Prediction Models, ta-
ble 2, I have chosen R-squared and mean absolute
error and root mean squared error for models like
GRU, RNN, and LSTM.
• For Classification models like regression and de-
cision trees, I have chosen an accuracy score for
error analysis.
• It is important to acknowledge that the attributes
utilized in these models are a specific sort of regu-
lated factor. Aspects of seasonality and trend have
not been considered for now.
When it comes to classification, the Gradient
Boosting model has an accuracy score of 0.749, while
the SVM-linear model gets an accuracy score of
0.751. CTR (Click-Through Rate) is analyzed over
time. It appears that the CTR initially increases at a
lag period of 1 (perhaps after an event or change), but
Machine Learning-Based Optimization of E-Commerce Advertising Campaigns
535
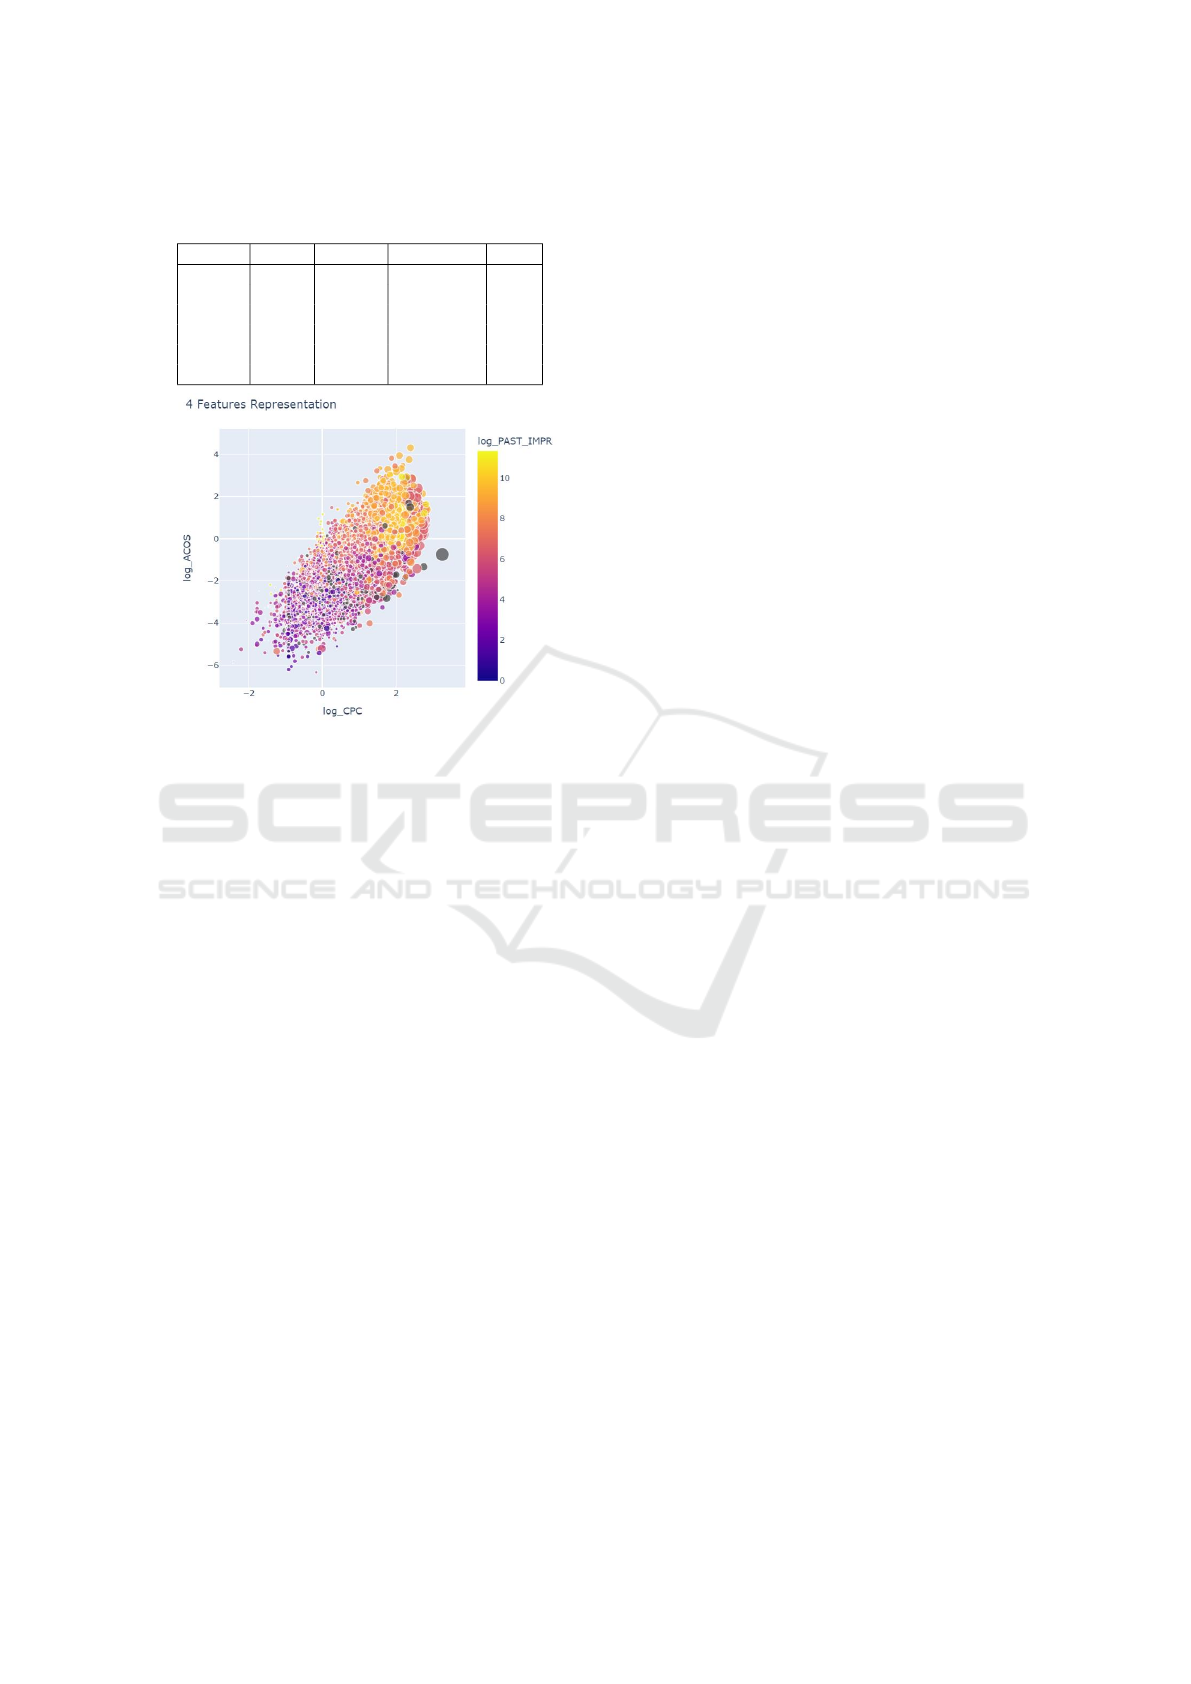
Table 2: Performance of models in predicting ACOS; CA
here is Classification Accuracy.
Model MAE RMSE R-squared CA
LSTM 0.31 0.53 0.56 -
GRU 0.32 0.52 0.57 -
RNN 0.39 0.69 0.56 -
LR 0.33 0.54 0.74 -
GB - - - 0.74
SVM 0.24 - - 0.86
Figure 3: Correlation analysis of impressions with ACOS.
then it gradually declines. This behavior might indi-
cate a short-term equilibrium in the data. The predic-
tive models were used to forecast CTR for the next
seven periods. The accuracy of these predictions is
evaluated by comparing them to the actual (observed)
values, and the results indicate that the predictions
closely match the actual data with over 80% accu-
racy. One plausible reason for not achieving signif-
icantly higher accuracy for ACOS could be attributed
to the presence of equilibrium in the dataset, result-
ing in a substantial reduction in accuracy in this sce-
nario. However, the visualizations generated do pro-
vide good insights into understanding the relation-
ship between input and output variables. The results
demonstrate the efficacy of various machine learning
algorithms for predicting key metrics and optimiz-
ing e-commerce advertising campaigns. The identi-
fied relationship between keyword performance, prof-
itability, and bid strategies provides marketers and ad-
vertisers with actionable insights for maximizing the
efficacy of their campaigns through the development
of targeted strategies.
5.4 Experiment 2: Campaign
Clustering
For the second case study, we determine the relation-
ship that exists between the performance of keywords
and the profitability of advertising campaigns. Ap-
plied the following steps:
1. Profitability, aka ACOS values, are divided into
classes, and a threshold value is determined for
the ACOS of high-performing keywords, and their
Click-through Rate (CTR) and Impressions are
evaluated to determine their performance.
2. The Hopkins Statistic was used to determine the
clustering tendency of the data, and then we used
the Bayesian Information Criterion (BIC) to de-
termine the optimal number of clusters.
3. For each quarter (of the year), K-means clustering
is used to group the campaigns based on the num-
ber of profitable keywords or the average prof-
itability of keywords. Clustered campaigns- Key-
word instances at daily and weekly level granular-
ity based on their past performance values.
4. Used 80% of the dataset to train using a Decision
Tree Classifier and predicted the values of ROAS
depending on the input Keyword bids. It yielded
an accuracy of 87.98%.
5. Further, we updated the Hypothesis testing code
to include data only for the top 20 percentile with
respect to how expensive the keyword bid is. It
yielded an improved accuracy of 90.92%, increas-
ing by approximately 3%.
Also, we discovered a relationship between the
two important metrics that would drive profitability,
namely, CPC and Impressions. We found a posi-
tive relationship between CPC and average impres-
sions. The results indicated that campaigns with high-
performing keywords, as identified by clustering and
thresholding, result in greater profitability and im-
proved performance metrics when bids are increased
on those keywords. Apart from that, the results of the
ACOS analysis reveal that, in subsequent quarters, the
ACOS values tend to remain relatively stable. The
ACOS class shows minimal changes, either remain-
ing the same or changing by the least. This stability in
ACOS suggests a consistent performance trend across
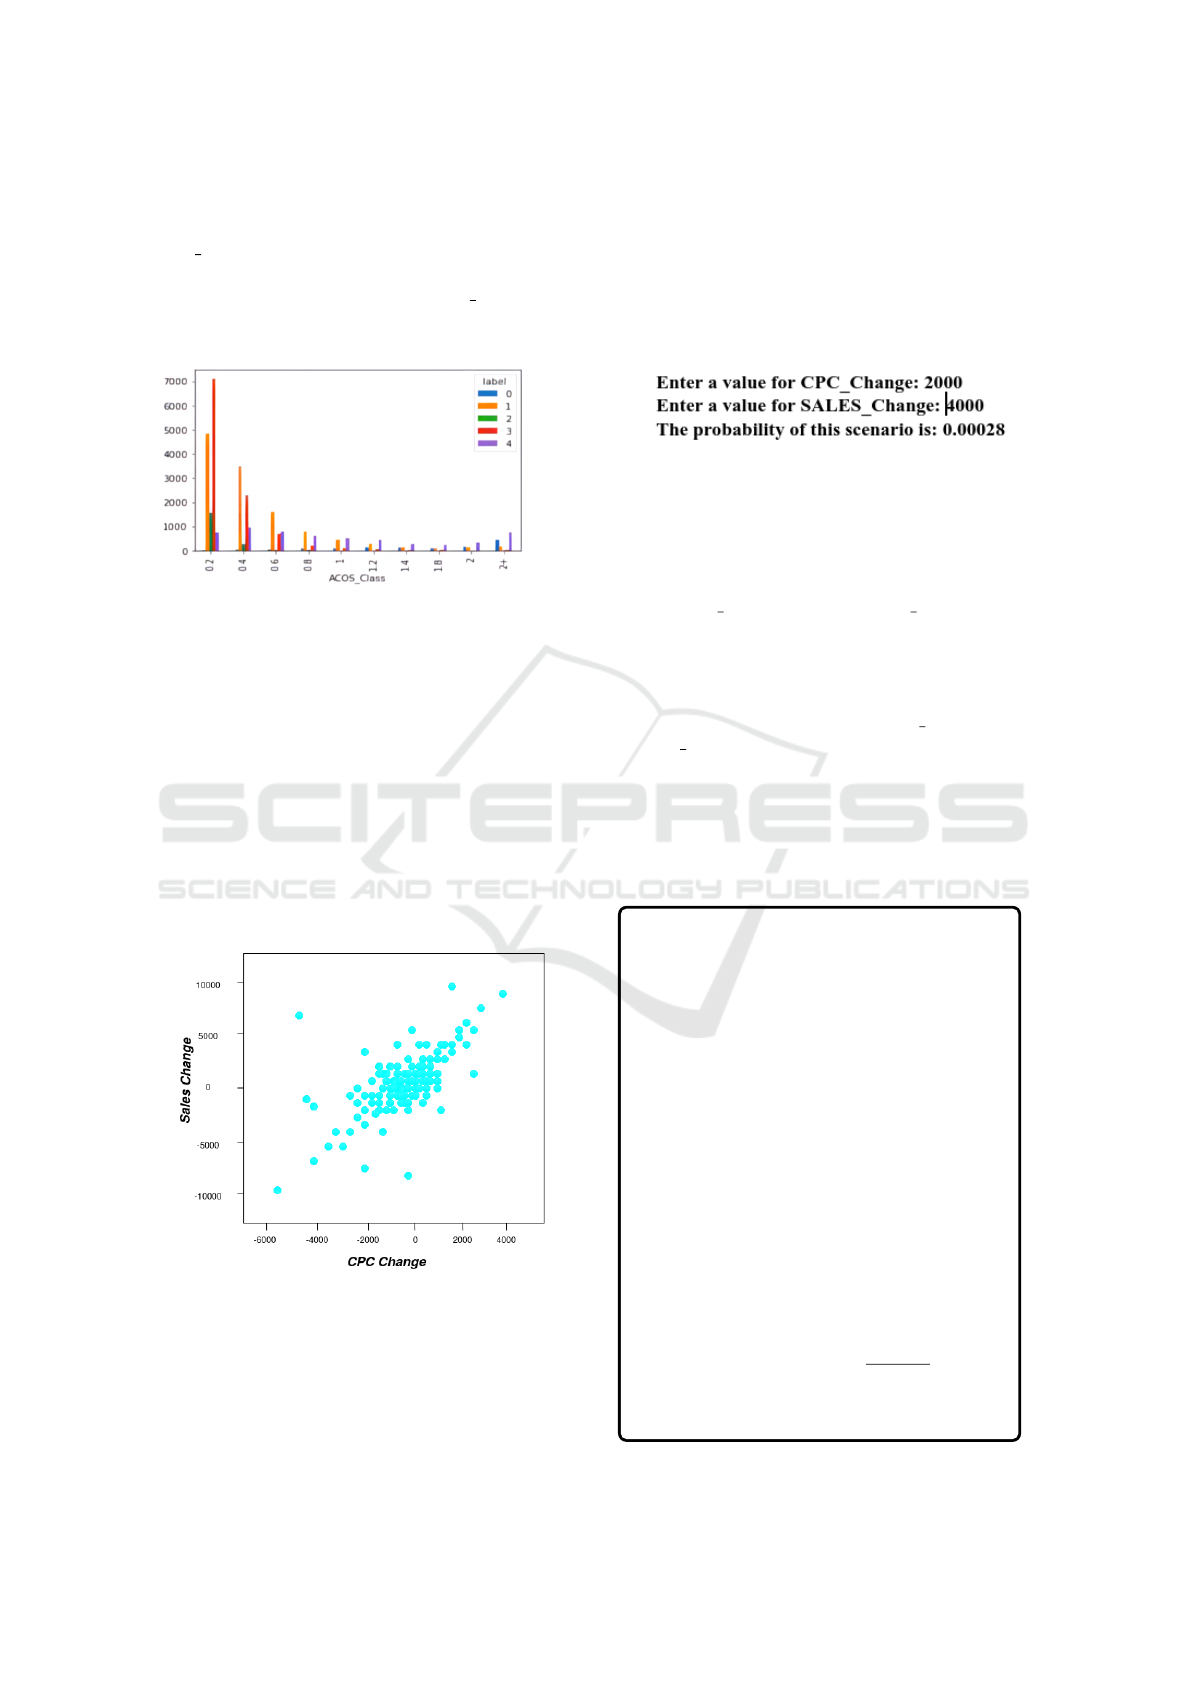
campaigns over time. Figure 4 shows the distribution
of Campaign-Keyword instances we got as a result of
clustering.
5.5 Experiment 3: Profitability
Prediction Using Joint Probability
Distribution
We analyzed campaign performance data from
the AMS (Amazon Marketing Services) platform.
Specifically, we queried the database for information
on campaign ID, report date, cost, clicks, and at-
tributed sales over 14 days. We excluded any records
ICAART 2024 - 16th International Conference on Agents and Artificial Intelligence
536
where cost or clicks were equal to zero, as these
are likely to be errors. We created a new column,
“CPC CHANGE”, in our dataset, which calculates
the difference in cost for each campaign’s daily CPC.
Then, created a new column, “SALES CHANGE”,
that calculates the corresponding change in sales for
each campaign.
Figure 4: Distribution of instances into clusters.
5.5.1 Probability Analysis of Change in CPC
Based on Change in Sales
Here, a scatter plot (5) of the daily changes in CPC
against the corresponding changes in attributed sales
is presented. The resulting plot helps us to visu-
ally inspect whether there is a relationship between
changes in CPC and attributed sales. We can observe
that there appears to be a positive correlation between
these variables, as indicated by the clustering of data
points towards the top right of the plot. However, we
must perform further analysis to confirm whether this
relationship is statistically significant.
Figure 5: Scatter Plot of Sales Change vs. CPC Change.
To explore this relationship further, we fit a Gaus-
sian function to the data and calculate the area un-
der the curve for different values of CPC and sales
change. To calculate the area under the curve, we
computed a double integral. Specifically, we inte-
grated the Gaussian function over the region defined
by the x and y values in our dataset. To visualize the
resulting data, we plotted a 3D surface using the mat-
plotlib toolkit Axes3D. The resulting plot showed a
relatively narrow peak at a particular value of CPC
change and sales change, indicating a high degree
of correlation between these two variables. Over-
Figure 6: Demo of the product for finding out Probability.
all, our analysis provides insights into the relation-
ship between changes in CPC and sales for adver-
tising campaigns, which may help optimize future
campaigns. We prompt the user to input a value
for the CPC CHANGE and SALES CHANGE vari-
ables and then calculate the probability of that sce-
nario occurring. We use the pre-calculated values
for the 2D histogram and the Gaussian fit to calcu-
late the probability. We first prompt the user to en-
ter values for the two variables, CPC CHANGE and
SALES CHANGE, then initialize the probability to 0
and iterate through the 2D histogram to calculate the
probability for the entered values. We break out of the
loops once we reach the bin that contains the entered
values, and then we add the corresponding probabil-
ity value to the running total. We then normalize the
probability and print out the result 6.
Gaussian curve fitting, also known as Gaus-
sian function fitting or Gaussian distribu-
tion fitting, is a statistical method that is
used for estimating the parameters of a
Gaussian distribution from a set of data
points. A Gaussian distribution, also called
a normal distribution, is a probability dis-
tribution that is symmetric and bell-shaped.
The goal of Gaussian curve fitting is to find
the values of the mean and standard devia-
tion that best fit the data. This is done by
minimizing the sum of the squared errors
between the data and the predicted values
of the Gaussian function. Here are the steps
involved in Gaussian curve fitting:
• Define the Gaussian function: The
Gaussian function is defined as follows:
f (x) = A · exp
−
(x − µ)
2
2σ
2
where A is the amplitude, µ is the mean,
Machine Learning-Based Optimization of E-Commerce Advertising Campaigns
537
σ is the standard deviation, and exp() is
the exponential function.
• Collect the data: Collect a set of points
you want to fit into the Gaussian func-
tion.
• Calculate the initial guesses for the pa-
rameters: Use some initial values for
the parameters, such as the mean and
standard deviation of the data, as initial
guesses for the parameters of the Gaus-
sian function.
• Define the error function: The error
function is the sum of the squared dif-
ferences between the data and the pre-
dicted values of the Gaussian function.
It is given by
E =
∑
[y − f (x)]
2
where
∑
is the sum of all data points, y
is the observed value, and f (x ) is the
predicted value of the Gaussian func-
tion.
• Use an optimization algorithm to min-
imize the error function: Several op-
timization algorithms can be used to
minimize the error function, such as the
least-squares method or the maximum
likelihood method. These algorithms
iteratively adjust the parameter values
of the Gaussian function until the error
function is minimized.
• Evaluate the goodness of fit: After the
optimization algorithm has converged,
evaluate the goodness of fit by calcu-
lating the R-squared value, which mea-
sures how well the Gaussian function
fits the data.
• Interpret the results: The final parame-
ter values for the Gaussian function can
be interpreted as the mean and standard
deviation of the distribution. The am-
plitude of the Gaussian function is pro-
portional to the area under the curve
and does not have a direct interpreta-
tion.
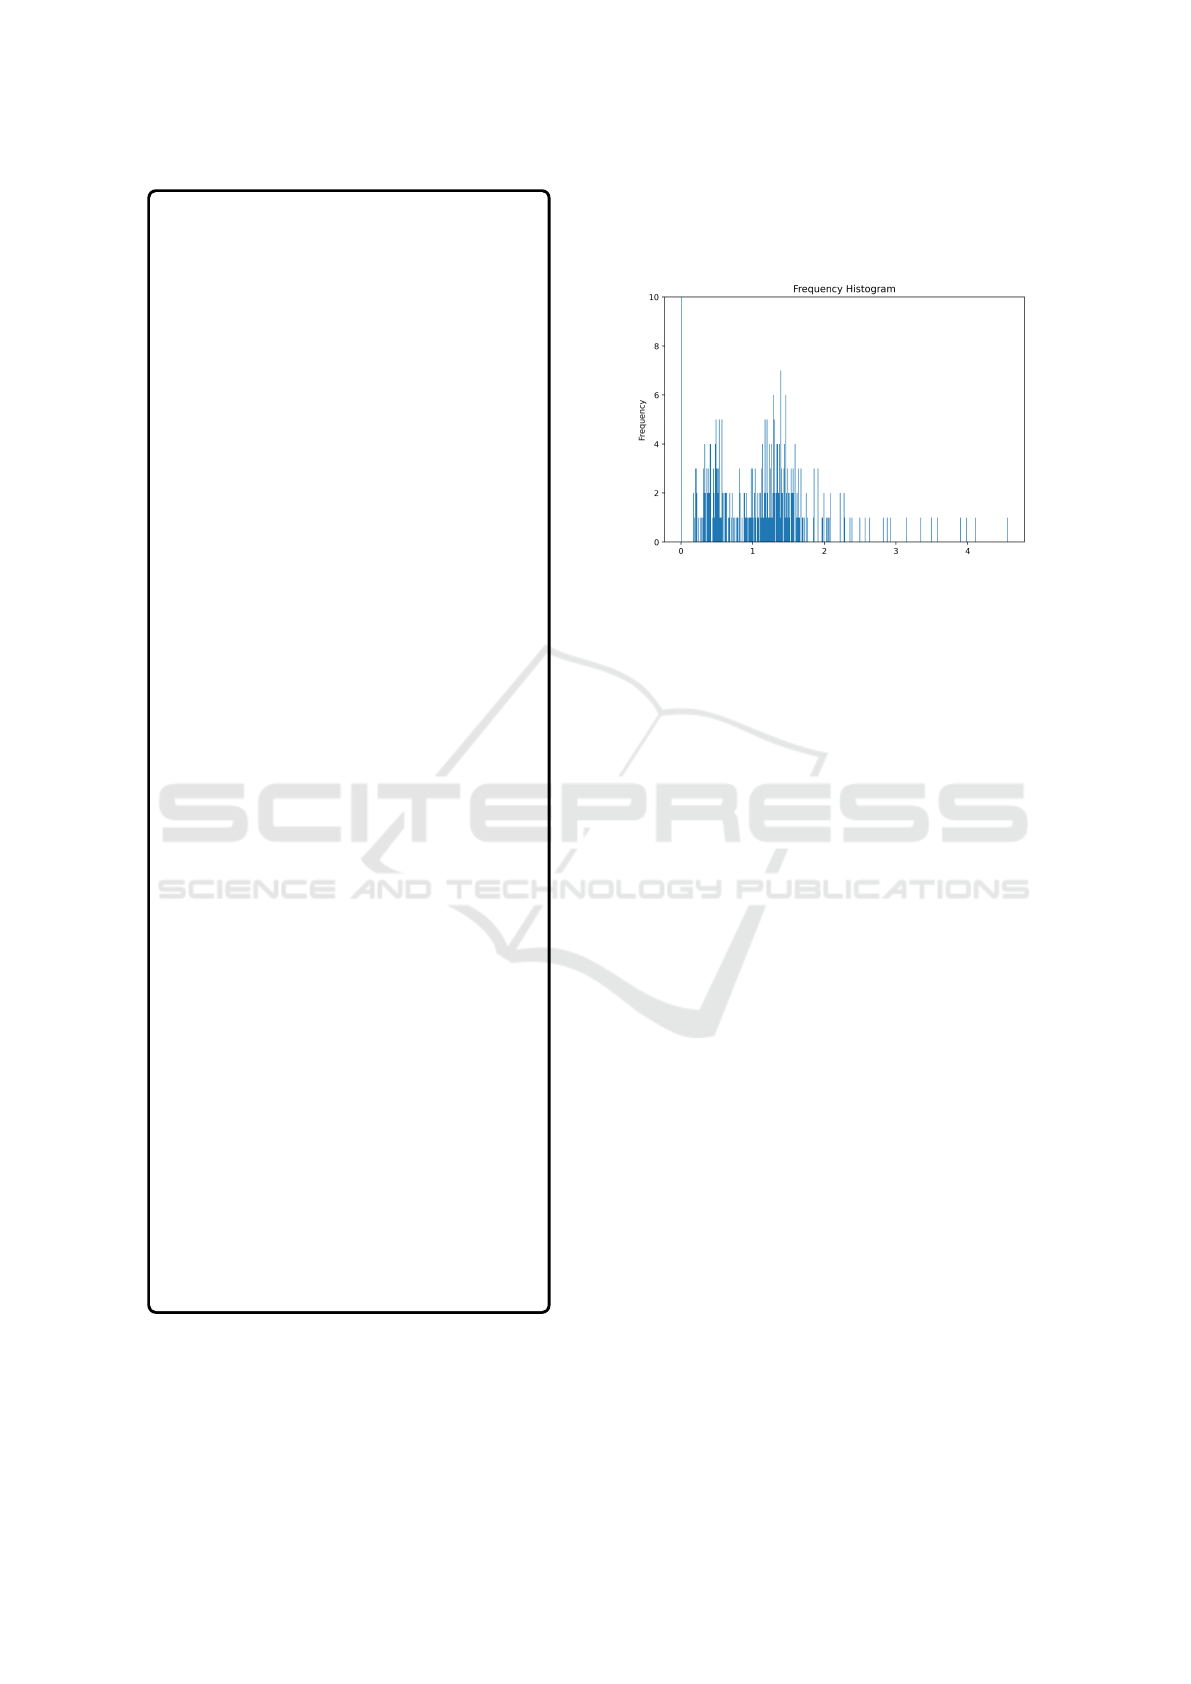
5.5.2 Probabilistic Prediction of ROAS
We classified the campaign keyword combination into
different CPC bands based on their past CPCs. Con-
sider a simple model,
ROAS = f unction(CPC) (2)
Figure 7: Example of Frequency Histogram with X axis
having ROAS values.
For each of these CPC bands, we made a fre-
quency histogram of ROAS values. From this
histogram, we identified the probability of certain
ROAS. Trying to predict the probability distribution
for three different bands of CPC for a single cam-
paign.
• Low : CPC<1.25
• Mid : 1.25>=CPC<1.5
• High : CPC>=1.5
For these bands, we will try to predict the proba-
bility of a ROAS Class. We will also be able to predict
the ROAS Class given the CPC Band and Probabil-
ity. From this graph 7, we can find out the probability
for each ROAS as well as the ROAS for each Prob-
ability. To use this analysis for a specific campaign
keyword combination, we can classify the campaign
into those CPC bands based on counting the number
of CPC classes of daily data; for example- if for a
certain campaign-keyword combination, the values of
CPC are under
• High CPC occurrence- 321/875
• Mid CPC occurrence- 289/875
• Low CPC occurrence- 265/875
Then for a particular CPC band, we predict the
ROAS at a given probability by taking the Gaussian
curve and truncating the distant, skewed entries as
noise. Inputted a CPC band and gave an option of
fetching ROAS value based on probability according
to high/mid/low CPC band. Updated such that instead
of using the input value of bid, we can give CPC as
input and it gives output according to the appropriate
CPC band.
ICAART 2024 - 16th International Conference on Agents and Artificial Intelligence
538

Figure 8: High CPC class selection for probability predic-
tion giving ROAS as input.
Figure 9: High CPC class selection for ROAS prediction
giving probability as input.
1. Statistics on profitable v/s non-profitable cam-
paigns
• In order to distinguish between the profitable
and the non-profitable campaigns, we set a cut-
off point for ROAS; above that level, we de-
fine the campaign as profitable, otherwise non-
profitable.
• Maintained a 1.5 threshold limit for ROAS for
the campaign to be set as profitable. This limit
was set keeping in mind that the initial invest-
ment in advertising cost has to be broken even
and then gain at least 50% above it.
• This analysis was first applied to a single cam-
paign. Figure 10 shows the profitable and non-
profitable campaign division among different
CPC bands (Low, Mid, High). The profitable
percentage for:
– Low CPC: 83.01%
– Mid CPC: 84.25%
– High CPC: 77.51%
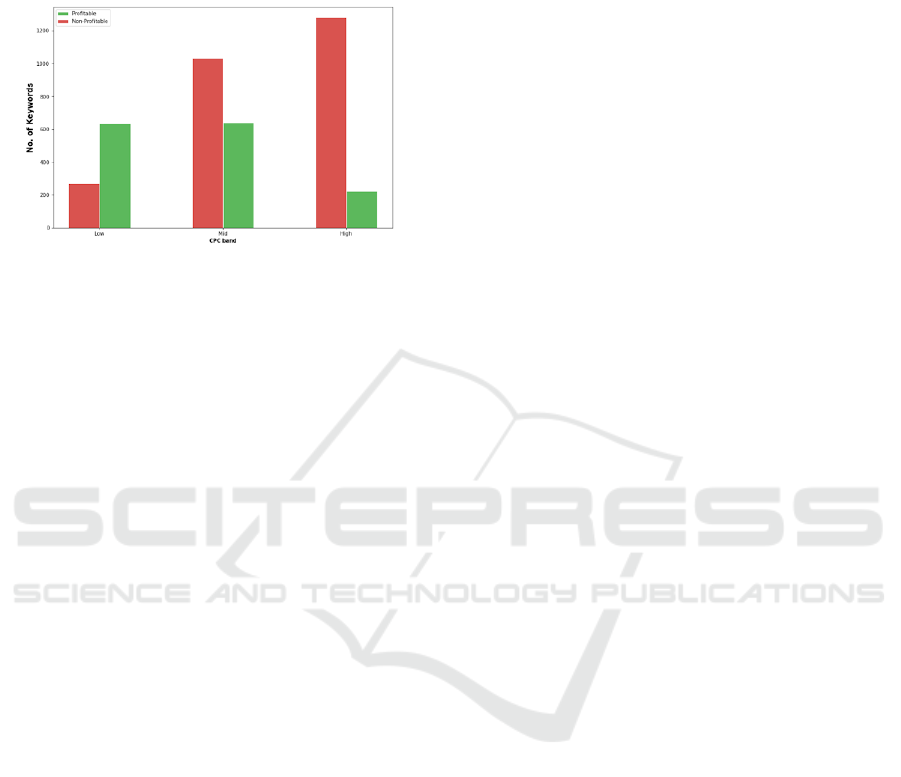
2. Generalizing analysis for all campaigns
• In order to make a viable solution we extended
the above analysis to every possible campaign
and keyword pair.
Figure 10: Profitable and Non-Profitable keyword division
into CPC bands - single campaign.
• Analyzed a total of 14082 distinct campaign-
keyword pairs for determining the profitable v/s
non-profitable statistics.
• The number of profitable (campaign-keyword)
pairs in low, mid, and high CPC classes are
6340, 6390, and 2230 out of a total 9040,
16730, and 15050 combinations, respectively.
• Inferred that low CPC keywords achieve a
higher proportion of profitability across all
campaigns (figure 11). The profitable percent-
age for:
– Low CPC: 70.13%
– Mid CPC: 38.19%
– High CPC: 14.82%
6 OBSERVATIONS AND RESULTS
With the probability analysis, we made significant
progress toward achieving our research objectives. It
allows us to understand the relationship between input
(such as bids and budgets) and output (ROAS, %im-
pression share, and ACOS) at the campaign keyword
level. For example, we can now answer questions
like: How do the profitability (ROAS) and aware-
ness (%impression share) of a campaign change with
variations in the budget? How do the profitability
(ROAS) and awareness (%impression share) of a key-
word change with different bid values? These in-
sights provide information for optimizing campaign
performance and making informed decisions regard-
ing budget allocation, bid adjustments, and overall
campaign strategy. By understanding the joint prob-
ability distributions, we can identify optimal ranges
of input metrics that result in desirable output met-
ric outcomes. Additionally, the probability analy-
sis allows us to transform the probabilistic distribu-
tions into actionable decision trees. These decision
trees provide clear guidelines and recommendations
for campaign changes based on the identified rela-
Machine Learning-Based Optimization of E-Commerce Advertising Campaigns
539
tionships between input and output metrics. Business
users can refer to these decision trees to guide their
campaign adjustments and maximize the desired out-
comes, such as ROAS and %impression share.
Figure 11: Profitable and Non-Profitable keyword division
into CPC bands - multiple campaigns.
7 FUTURE WORK
Moving forward, we will continue expanding the cov-
erage of insights by applying the probability analy-
sis to at least 30% of the ad spend and 30% of the
campaigns. Within each campaign, we aim to cover
at least 60% of the keyword spend or keywords un-
der the insights. By involving business users and en-
gagement managers, we will validate the insights and
ensure their value and usability in driving campaign
changes. Furthermore, we aim to do a more specific
analysis if we understand the seasonality and trend
components of the data, as currently, we are only clas-
sifying based on CPC. If we understand trends and
seasonality, we can classify them more precisely and
give a more accurate probability analysis.
8 CONCLUSIONS
The probability analysis conducted here has signif-
icantly contributed to achieving our research objec-
tives by providing valuable insights into the relation-
ship between input variables, such as bids and bud-
gets, and output metrics, including ROAS, %impres-
sion share, and ACOS at the campaign keyword level.
The utilization of multi-variate density graphs and
joint probability curves has allowed us to visualize
and explain how changes in input metrics impact the
output metrics, thereby offering actionable informa-
tion for optimizing campaign performance and facili-
tating informed decision-making regarding budget al-
location, bid adjustments, and overall campaign struc-
ture. The insights provided in this context facilitate
ad campaign planning through the utilization of pre-
dictive analytics for forecasting profitability and im-
pressions. Additionally, clustering techniques are ap-
plied to gain a deeper understanding of market dy-
namics and consumer preferences. Moreover, prob-
abilistic decision trees are utilized to derive action-
able insights. These decision trees serve as valuable
tools for guiding campaign adjustments and maximiz-
ing desired outcomes, such as ROAS and %impres-
sion share.
REFERENCES
Agarwal, D., Chen, B.-C., and Elango, P. (2009). Spatio-
temporal models for estimating click-through rate. In
Proceedings of the 18th international conference on
World wide web, pages 21–30.
Akande, T. D. and Haq, M. I. U. Role of machine learning
in online advertising.
Amazon (2022a). Amazon introductory courses.
Amazon (2022b). Amazon introductory courses.
Amazon (2022c). Amazon introductory courses.
An, H., Ren, J., et al. (2020). Xgbdeepfm for ctr predic-
tions in mobile advertising benefits from ad context.
Mathematical Problems in Engineering, 2020.
Aronowich, M., Benis, A., Yanai, R., and Vind, G. Jun.
25 2014. budget distribution in online advertising. US
Patent App, 14(314,151).
Avila Clemenshia, P. and Vijaya, M. (2016). Click through
rate prediction for display advertisement. Interna-
tional Journal of Computer Applications, 975:8887.
Chan, P. P., Hu, X., Zhao, L., Yeung, D. S., Liu, D., and
Xiao, L. (2018). Convolutional neural networks based
click-through rate prediction with multiple feature se-
quences. In IJCAI, pages 2007–2013.
Chapelle, O., Manavoglu, E., and Rosales, R. (2014). Sim-
ple and scalable response prediction for display adver-
tising. ACM Transactions on Intelligent Systems and
Technology (TIST), 5(4):1–34.
Chen, J., Sun, B., Li, H., Lu, H., and Hua, X.-S. (2016a).
Deep ctr prediction in display advertising. In Pro-
ceedings of the 24th ACM international conference on
Multimedia, pages 811–820.
Chen, Q.-H., Yu, S.-M., Guo, Z.-X., and Jia, Y.-B. (2016b).
Estimating ads’ click through rate with recurrent neu-
ral network. In ITM web of conferences, volume 7,
page 04001. EDP Sciences.
Chen, W., Zhan, L., Ci, Y., Yang, M., Lin, C., and Liu, D.
(2019). Flen: leveraging field for scalable ctr predic-
tion. arXiv preprint arXiv:1911.04690.
Huang, T., Zhang, Z., and Zhang, J. (2019). Fibinet: com-
bining feature importance and bilinear feature interac-
tion for click-through rate prediction. In Proceedings
of the 13th ACM Conference on Recommender Sys-
tems, pages 169–177.
Jha, A., Sharma, Y., and Chanda, U. (2023). Ctr pre-
diction: A bibliometric review of scientific literature.
ICAART 2024 - 16th International Conference on Agents and Artificial Intelligence
540

Handbook of Evidence Based Management Practices
in Business, page 453.
Juan, Y., Zhuang, Y., Chin, W.-S., and Lin, C.-J. (2016).
Field-aware factorization machines for ctr prediction.
In Proceedings of the 10th ACM conference on recom-
mender systems, pages 43–50.
Kumari, P. and Toshniwal, D. (2021). Long short term
memory–convolutional neural network based deep hy-
brid approach for solar irradiance forecasting. Applied
Energy, 295:117061.
Ling, X., Deng, W., Gu, C., Zhou, H., Li, C., and Sun,
F. (2017). Model ensemble for click prediction in
bing search ads. In Proceedings of the 26th inter-
national conference on world wide web companion,
pages 689–698.
Muthukrishnan, S., Pal, M., and Svitkina, Z. (2007).
Stochastic models for budget optimization in search-
based advertising. In Internet and Network Eco-
nomics: Third International Workshop, WINE 2007,
San Diego, CA, USA, December 12-14, 2007. Pro-
ceedings 3, pages 131–142. Springer.
Perlich, C., Dalessandro, B., Hook, R., Stitelman, O.,
Raeder, T., and Provost, F. (2012). Bid optimizing and
inventory scoring in targeted online advertising. In
Proceedings of the 18th ACM SIGKDD international
conference on Knowledge discovery and data mining,
pages 804–812.
Qin, J., Zhang, W., Wu, X., Jin, J., Fang, Y., and Yu, Y.
(2020). User behavior retrieval for click-through rate
prediction. In Proceedings of the 43rd International
ACM SIGIR Conference on Research and Develop-
ment in Information Retrieval, pages 2347–2356.
Rafieian, O. and Yoganarasimhan, H. (2021). Targeting
and privacy in mobile advertising. Marketing Science,
40(2):193–218.
Richardson, M., Dominowska, E., and Ragno, R. (2007).
Predicting clicks: estimating the click-through rate for
new ads. In Proceedings of the 16th international con-
ference on World Wide Web, pages 521–530.
ˇ
Solt
´
es, E., T
´
aboreck
´
a-Petrovi
ˇ
cov
´
a, J., and
ˇ
Sipoldov
´
a, R.
(2020). Targeting of online advertising using logistic
regression.
Vidhya, A. (2023). Rnn vs gru vs lstm.
Xiao, Z., Yang, L., Jiang, W., Wei, Y., Hu, Y., and Wang, H.
(2020). Deep multi-interest network for click-through
rate prediction. In Proceedings of the 29th ACM In-
ternational Conference on Information & Knowledge
Management, pages 2265–2268.
Yan, C., Chen, Y., Wan, Y., and Wang, P. (2021). Modeling
low-and high-order feature interactions with fm and
self-attention network. Applied Intelligence, 51:3189–
3201.
Zhou, G., Zhu, X., Song, C., Fan, Y., Zhu, H., Ma, X., Yan,
Y., Jin, J., Li, H., and Gai, K. (2018). Deep interest
network for click-through rate prediction. In Proceed-
ings of the 24th ACM SIGKDD international confer-
ence on knowledge discovery & data mining, pages
1059–1068.
APPENDIX
Table 3 shows the effect of varied probability on
ACOS change as an output variable, keeping CPC as
a constant parameter for a single campaign.
Table 3: CPC v/s ACOS change with variations in Proba-
bility.
CPC Change Probability ACOS Change
+- 5 > 10.0% 0.178
+- 5 > 20.0% 0.178
+- 5 > 30.0% 0.178
+- 5 > 40.0% 0.178
+- 5 > 50.0% 0.178
+- 5 > 60.0% 0.783
+- 5 > 70.0% 0.783
+- 5 > 80.0% 0.783
+- 5 > 90.0% 0.783
Machine Learning-Based Optimization of E-Commerce Advertising Campaigns
541
