
Exploring the Impact of Competing Narratives on Financial Markets II:
An Opinionated Trader Agent-Based Model with Dynamic Feedback
Arwa Bokhari
1,2 a
1
Department of Computer Science, University of Bristol, Bristol BS8 1UB, U.K.
2
Information Technology Department, College of Computers and Information Technology, Taif University, Saudi Arabia
Keywords:
Agent-Based Models, Narrative Economics, Opinion Dynamics, Financial Markets.
Abstract:
Employing an agent-based trading model integrated with opinion dynamics, we conduct a systematic explo-
ration of the factors potentially contributing to financial market frenzies. Applying our previously established
testbed described in detail in a companion paper (part I), we examine the influence of two competing narratives
on three hypotheses: self-reinforcement; herding; and an additive response to inputs. Utilizing a real-world
dataset, we investigate these dynamics. Our findings reveal that although all three hypotheses affect price
movements, herding behavior has the most substantial impact. The source code for these simulations is avail-
able on Github, allowing researchers to replicate and extend our work.
1 INTRODUCTION
In financial markets, frenzies are characterized by un-
usually high trading volumes, significant price volatil-
ity, and, often, divergent opinions about asset valua-
tions. With the advent of instantaneous information
dissemination, narratives can play an important role
in precipitating these frenzies (Shiller, 2019; Hirsh-
leifer, 2020).
The field of narrative economics, which explores
the power of prevalent stories to affect economic de-
cisions, has been notably advanced by Robert Shiller
(Shiller, 2017; Shiller, 2019). These narratives do
more than reflect collective sentiment; they are ac-
tive agents in the marketplace, entwining truth and
fiction in ways that can create ambiguity and diver-
gent interpretations. As such, they play a critical role
in investment decisions, acknowledged by experts and
institutional investors alike (Kim et al., 2023). The
propagation of these narratives can be substantially
amplified through social media, which, in conjunc-
tion with trading platforms like Robinhood, can con-
tribute to driving stock prices to extremes, as seen in
the GameStop price surge in January 2021 (Kim et al.,
2023; Jakab, 2022; Aliber et al., 2015).
It is not just the narrative’s existence that makes it
powerful but also its interaction with other narratives,
sometimes opposing ones. Tesla’s valuation surge in
a
https://orcid.org/0000-0003-2987-4601
2013, underscored by the promise of a sustainable
electric future, faced skepticism through a counter-
point questioning its financial valuation (Liu, 2021).
Similarly, Bitcoin’s dramatic rise in 2017, supported
by the decentralized currency narrative, encountered
opposition, highlighting its potential for misuse and
inherent volatility. Instances like the 2021 GameStop
frenzy and the FTX collapse in November 2022 fur-
ther illustrate the intricate interplay between compet-
ing narratives and their tangible effects on market
movements.
In this study, we investigate the dynamics of con-
flicting narratives and assess how each of the three
factors—self-reinforcement, herding, and additive re-
sponse to inputs, which will be discussed in the fol-
lowing section—impacts their capacity to shape the
intensity and orientation of market frenzies. Insight
into these dynamics is pivotal for devising informed
regulatory interventions aimed at controlling specula-
tive activities and maintaining market stability.
1.1 Self-Reinforcement, Herding, and
Additive Response Among Traders
In this paper, we extend my previous work (A, 2024)
by incorporating market mood as a determinant of
market dynamics in the presence of conflicting nar-
ratives. Using my agent-based model, we analyze
the role of positive feedback loops in narrative re-
inforcement, herding behavior’s effect on collective
138
Bokhari, A.
Exploring the Impact of Competing Narratives on Financial Markets II: An Opinionated Trader Agent-Based Model with Dynamic Feedback.
DOI: 10.5220/0012456500003636
Paper published under CC license (CC BY-NC-ND 4.0)
In Proceedings of the 16th International Conference on Agents and Artificial Intelligence (ICAART 2024) - Volume 1, pages 138-148
ISBN: 978-989-758-680-4; ISSN: 2184-433X
Proceedings Copyright © 2024 by SCITEPRESS – Science and Technology Publications, Lda.

decision-making, and the influence of external in-
puts on group behavior. By systematically compar-
ing these dynamics—positive feedback (Hypothesis
A), herding (Hypothesis B), and external influence
(Hypothesis C)—my model explains their distinct and
combined effects on market behavior under the con-
text of bullish and bearish trader groups.
• Self-Reinforcement: Narratives within closed
groups lead to stronger, more entrenched opinions
over time. This is exemplified by digital “echo
chambers,” where the absence of opposing views
strengthens beliefs through a feedback loop. Sim-
ilarly, in financial markets, self-reinforcement is
seen as trends gain momentum and influence in-
vestor behavior, thus reinforcing the prevailing
market direction. This phenomenon demonstrates
its impact in both digital and economic spheres.
• Herding Behavior: Herd behavior in finan-
cial markets is the propensity of individuals to
mimic the actions or beliefs of their peers, in-
fluenced more by collective dynamics than in-
dividual decision-making (Kameda et al., 2014).
This phenomenon is exemplified in the GameStop
short squeeze event. Key figures such as Keith
Gill, a financial advisor, played significant roles
(Anand and Pathak, 2021). Gill’s bullish view on
GameStop, recognizing its high short interest, led
many to follow his investment strategy, resulting
in a feedback loop that significantly inflated the
stock’s price. This behavior, driven by a fear of
missing out rather than a deep understanding of
market fundamentals, led to a substantial increase
in the stock price, especially as institutions that
had shorted the stock were compelled to buy back
at higher prices. This case underscores how herd
behavior can lead to rational bubbles in the mar-
ket, diverging from the “wisdom of crowds” prin-
ciple, which relies on diverse, independent think-
ing (Surowiecki, 2004; Kim et al., 2023; Andreev
et al., 2022).
• Additive Response: In financial contexts, this
refers to investors’ reactions based solely on ex-
ternal stimuli, independent of market data or col-
lective sentiment. The GameStop frenzy provides
a clear example of this. Influencer Keith Gill’s
decision to hold his stocks, despite significant un-
realized profits, served as an external stimulus
for many investors, who then mirrored his stance.
This reaction was not based on market fundamen-
tals but rather on additive stimuli like rallying
phrases such as “diamond hands” and “YOLO”,
demonstrating the impact of such external signals
in driving investor behavior contrary to standard
market practices.
1.2 Structure of the Paper
This paper, the second in a two-part series, builds on
the agent-based model (ABM) introduced in its pre-
decessor (A, 2024). While the first paper provides a
comprehensive detail of the ABM, this one extends
the model and applies it to real-world data. For co-
herence and completeness, aspects of model design
are reiterated here, mirroring the inclusion of illustra-
tive results in (A, 2024). The structure of this paper is
as follows: Section 2 reviews the related background;
Section 3 describes the ABM’s design and operation;
Section 4 displays the results; and finally, Section 5
concludes the paper.
2 BACKGROUND
In the dynamic field of financial economics, a pro-
found paradigm shift is unfolding, profoundly alter-
ing our comprehension of market mechanics. The Ef-
ficient Market Hypothesis (EMH), long revered as the
foundational pillar in this domain, asserts that market
prices are comprehensive reflections of all relevant in-
formation about an asset’s intrinsic value. However,
this hypothesis encounters substantial difficulties in
accounting for certain anomalies within financial mar-
kets, notably the unpredictable behaviors observed in
cryptocurrency markets, a challenge highlighted in
Shiller’s 2017 analysis of Narrative Economics.
At the forefront of this intellectual evolution
is the emergence of narrative economics, a theory
that posits a paradigmatic shift from the conven-
tional reliance on empirical, quantifiable data, propos-
ing instead that the narratives and stories pervading
amongst market participants wield a formidable influ-
ence on economic trajectories (Shiller, 2017). In this
context, narratives are not mere anecdotes but potent,
contagious entities that disseminate through the intri-
cacies of social networks, molding public sentiment
in a manner akin to biological epidemics (Shiller,
2019). Grasping the essence and flow of these nar-
ratives is crucial for decoding the underlying currents
driving market movements, particularly in instances
where traditional economic theories offer inadequate
explanations.
Parallel to this narrative-centric approach is the
rapidly developing field of Opinion Dynamics (OD),
a discipline dedicated to unraveling the formation and
propagation of opinions within societal constructs.
The first application to the domain of financial mar-
kets (Lomas and Cliff, 2021), OD elucidates the
intricate nexus between socio-behavioral dynamics
and economic phenomena, offering a nuanced lens
Exploring the Impact of Competing Narratives on Financial Markets II: An Opinionated Trader Agent-Based Model with Dynamic Feedback
139

through which market behaviors can be interpreted.
The integration of OD principles with agent-based
modeling in financial markets heralds a new era in
economic analysis, elucidating how shifts in the per-
ceptions and stances of trader-agents can manifest in
tangible market price movements (Lomas and Cliff,
2021).
3 MODEL
3.1 BFL-PRDE Trader Model
In the evolution of trading strategies, PRZI
(Parameterised-Response Zero Intelligence), as
introduced in (Cliff, 2023), laid the groundwork
for adaptive zero-intellegence (ZI) traders, paving
the way for its successor, PRDE (Parameterized-
Response Differential Evolution) (Cliff, 2022). ZI
traders have a long tradition of productive use as
minimal models of human traders: see for example
(Farmer et al., 2005) (Ladley, 2012), and (Axtell and
Farmer, 2018).
While PRDE equipped traders with means for
adapting to market fluctuations, it inherently lacked
the capability to anticipate market trends. Traders,
operating within the PRDE domain draw upon their
specific strategies to determine quote prices. The dy-
namic nature of these strategies stems from a dual
interaction: intrinsic strategy values and the prevail-
ing strategies of peer traders in the market. Bokhari
and Cliff (Bokhari and Cliff, 2022) extend the PRDE
framework by incorporating a real-valued opinion
variable, utilizing the opinion dynamics model pro-
posed by Bizyaeva, Franci, and Leonard (BFL). This
integration yields a more sophisticated trading model
called (BFL-PRDE) where buyers and sellers, in-
formed by their opinions, demonstrate contrasting
market behaviors. Under a bullish consensus, BFL-
PRDE buyers, a hybrid of the ZI-trader strategies
GVWY (Cliff, 2012; Cliff, 2018) and ZIC(Gode and
Sunder, 1993), manifest heightened urgency, influ-
encing their quote prices. Conversely, sellers lean to-
wards a more relaxed position in the form of a hy-
brid between the ZI trader strategies ZIC and SHVR
(Cliff, 2012; Cliff, 2018), especially when bearish
sentiments dominate.
This development requires a mapping function,
translating trader opinion into its PRDE trading strat-
egy. Elaborating on the intrinsic mechanics, as de-
tailed in (Cliff, 2022), Each PRDE trader holds a pri-
vate local set of potential strategy-values with a pop-
ulation size NP ≥ 4. For trader i, this set can be de-
noted as s
i,1
, s
i,2
, ..., s
i,NP
. Given that PRDE traders
rely solely on a singular real scalar value to charac-
terize their bargaining approach, every individual in
the differential evolution population is represented by
a single value. Thus, the traditional differential evo-
lution mechanism of crossover (i.e., selecting genes
from a pair of parents, one gene for each genome
dimension) isn’t relevant: PRDE creates a genome
exclusively based on the base vector. In its present
version, PRDE uses the standard “vanilla” DE/rand/1.
After evaluating a strategy s
i,x
, three distinct s-values
are chosen at random from the population: s
i,a
, s
i,b
,
and s
i,c
ensuring x ̸= a ̸= b ̸= c. This results in the
generation of a new candidate strategy s
i,y
defined as
s
i,y
= max(min(s
i,a
+ F
i
(s
i,b
− s
i,c
), +1), −1), where
F
i
symbolizes the trader’s differential weight coeffi-
cient (in the outlined experiments, F
i
= 0.8; ∀i). Uti-
lizing the min and max functions, the candidate strat-
egy’s range is limited between [−1.0, +1.0]. Within
BFL-PRDE, the trader’s opinion s
i,o
emerges as an
additional candidate strategy. The performances of
s
i,y
and s
i,o
are then compared; the superior strategy
becomes the new parent strategy s
i,x
. If not, it’s re-
placed with the subsequent strategy s
i,x+1
.
3.2 BFL Opinion Dynamics Model
We use a social network model to represent com-
peting narratives. In this model, traders are catego-
rized into two communities: those with positive opin-
ions and those with negative ones. Negative traders
will uniformly share one narrative, whereas posi-
tive traders will promote a contrasting narrative(Long
et al., 2023). Consider a network of N
a
trading agents
forming opinions x
1
, . . . , x
N
a
∈ R about the price of
a tradable asset. Let x
i
be the opinion state of agent
i. This real-valued scalar opinion variable indicates
that a negative x
i
indicates an expected decline in
prices, while a positive x
i
implies an anticipated in-
crease. The vector X = (x
1
, ..., x
N
a
) represents the
opinion state of the agent network. Agent i is neu-
tral if x
i
= 0. The origin X = 0 is called the network’s
neutral state. Agent i is unopinionated if its opinion
state is small, i.e., |x
i
| ≤ ϑ for a fixed threshold ϑ ≈ 0.
Agent i is opinionated if |x
i
| ≥ ϑ. Agents can agree
and disagree. When two agents have the same qual-
itative opinion state (e.g., they both favor the same
option), they agree. When they have qualitatively dif-
ferent opinions, they disagree.
We utilize the BFL opinion dynamics from (Franci
et al., 2019), which are simplified to the dynamics of
N
c
clusters or communities, as described in (Bizyaeva
et al., 2020). Each cluster, indexed by q = 1, ..., N
c
,
comprises N
q
agents out of a total of N
a
, such that
∑
N
c
q=1
N
q
= N
a
. These agents form opinions collec-
ICAART 2024 - 16th International Conference on Agents and Artificial Intelligence
140

tively.
Consider two clusters, p and n, representing com-
munities of positive (bullish) and negative (bearish)
traders, respectively. For a given cluster q, let the
set of all agent indices in that cluster be denoted by
I
q
. With q ∈
{
p, n
}
, p ̸= n, then, each agent i ∈ I
q
has an opinion that evolves according to the dynam-
ics presented in(Bizyaeva et al., 2020), which can be
mathematically captured by the following differential
equation:
˙x
i
= −d
i
x
i
+ u
i
(
ˆ
S
1
(α ˆx
p
+ γ
i
ˆx
n
) −
ˆ
S
2
(β ˆx
p
+ δ
i
ˆx
n
)) + b
q
(1)
where ˆx
q
is the average opinion of cluster q:
ˆx
q
=
1
N
q
∑
i∈I
q
x
i
(2)
and
ˆ
S
z
(x), z ∈
{
1, 2
}
are saturation functions de-
fined as
ˆ
S
z
(x) =
1
2
(S
z
(x) − S
z
(−x)), where S
z
are odd sigmoids.
(3)
The model in (1) is suitable for testing the afore-
mentioned hypotheses by considering the parameters
as follows:
• d > 0 is a resistance parameter that drives the
rate of change ˙x
i
towards the neutral point over
time. Intuitively, a larger value of d implies the
agent is less inclined to change its opinion. Within
the context of social sciences, this parameter can
symbolize an individual’s level of “stubbornness”.
• u ≥ 0 is an attention parameter; it affects how ˙x
i
changes in response to social interactions. Intu-
itively, a larger value of u indicates greater atten-
tion or sensitivity of the agent to other agents’
opinions. Thus, the two parameters d and u
weigh the relative influence of the linear damp-
ing term and the opinion exchange term, respec-
tively; when the influence of d outweighs that
of u, the agent pays minimal attention to others.
Conversely, if u dominates d, the agent becomes
more attentive to others’ opinions. The dynamics
governing the evolution of the agent’s attention
parameter, as detailed in (Bizyaeva et al., 2020),
are given by:
τ
u
˙u
i
= −u
i
+ S
u
(
N
a
∑
l=1
( ¯a
il
x
l
)
2
) (4)
let the feedback weight be
¯
A
i
= ¯a
i j
∈
{
0, 1
}
. If
¯a
i j
= 1, it indicates that agent i is influenced by
the status of agent j. The matrix
¯
A can either cor-
respond to a predefined social network or be de-
termined independently. The saturation function
S
u
is then decomposed as:
S
u
(y) = u
f
(F (g (y − y
m
)) − F(−gy
m
)) (5)
S
u
is defined with F(x) =
1
1+e
−x
.
• α ≥ 0 is the self-reinforcement of the cluster’s
averaged opinions ˆx
q
. This parameter quantifies
the degree of dependency of an agent’s tempo-
ral evolution in opinion on the average of its en-
compassing cluster. For an elevated α, there’s a
pronounced amplification of the intrinsic histori-
cal or mean consensus of the cluster, potentially
driving the system towards a state of reduced ex-
ternal influence and susceptibility to becoming an
echo chamber. Conversely, a diminished α results
in a diminished anchoring to past consensus, ren-
dering the system more susceptible to external in-
fluences.
• β is the intra-agent interaction weight, repre-
senting how an agent processes and weights op-
posing opinions within its own decision-making
paradigm. This becomes particularly relevant
when an agent is faced with multiple choices,
such as when formulating opinions on a variety
of tradable assets like different stocks, in this
case the state of its opinion would be a vector
ˆ
X
p
. However, given that there’s only one object
for decision-making in my system, this parameter
will take a value opposite to α as the second term
of the dynamics in 1 is subtracted from the first,
making the opinion more emphasized by ˆx
p
.
• γ and δ are the inter-agent interaction weights,
which determine whether cluster p and cluster n
form a consensus γ − δ > 0 or a dissensus γ− δ <
0. The state feedback dynamics of these parame-
ters take the form of a leaky nonlinear integrator
(Bizyaeva et al., 2020):
τ
γ
˙
γ
i
= −γ
i
+ σ
q
S
γ
( ˆx
p
ˆx
n
) (6)
τ
δ
˙
δ
i
= −δ
i
− σ
q
S
δ
( ˆx
p
ˆx
n
) (7)
where σ
q
∈
{
1, −1
}
is the design parameter
and τ
γ
, τ
δ
> 0 are time scales, and the saturation
function is
S
c
(y) = c
f
tanh (g
c
y) c ∈
{
γ, δ
}
(8)
where c
f
, g
c
> 0. In any configuration of opin-
ions where the product ˆx
p
ˆx
n
is notably non-neutral
and significantly large, it prompts γ
i
to gravi-
tate towards σγ
f
and δ
i
to move towards −σδ
f
(Bizyaeva et al., 2020).
• b is the input parameter, potentially derived from
environmental factors, such as market fluctua-
tions, or it could signify inherent biases. For
Exploring the Impact of Competing Narratives on Financial Markets II: An Opinionated Trader Agent-Based Model with Dynamic Feedback
141

traders with a bearish (or negative) opinion, we
designate b
n
≤ 0 to convey a predominant senti-
ment predicting a price decrease. Conversely, for
those holding bullish (or positive) opinions, we
assign b
p
≥ 0 to signify an expectant bias towards
a price ascent.
For non-negative α and β, the terms α ˆx
p
and β ˆx
p
in Equation 1 exemplify the self-reinforcement mech-
anism within cluster p. Similarly, the dynamics of
cluster n can be described by interchanging ˆx
p
with
ˆx
n
in the same equation, indicating analogous self-
reinforcement. To understand the dynamics in the
context of opposing narratives, consider that ˆx
p
> 0
and ˆx
n
< 0. In this situation, α ˆx
p
> 0 and β ˆx
p
> 0
will reinforce cluster p to adopt a more positive view,
while α ˆx
n
< 0 and β ˆx
n
< 0 will push cluster n towards
a more negative direction. Such parameterization ef-
fectively captures self-reinforcement’s role in shaping
opposing perspectives.
Herding behavior is modeled by embedding feed-
back mechanisms into the social influence parameters
γ and δ. The system’s tendency—towards consensus
or dissensus—is dictated by the sign of the parameter
σ in the dynamics of Equations (6) and (7). A rever-
sal in σ’s sign triggers a shift between consensus and
dissensus states: σ = 1 aligns both clusters towards
consensus, whereas σ = −1 drives them to dissensus.
In the case where α = β = γ = δ = 0, the dynam-
ics in 1 are linear. Then, ˙x
i
responds additively to
b
q
, where b
q
is interpreted as an environmental sig-
nal. We can model additive response by setting the
value of b
q
.
3.3 Market Mood Input
The influence of aggregate market mood MM, as ex-
pressed through social media posts, on the market
frenzy is profound. This assertion requires an under-
standing of the dynamics between social media senti-
ments and market behavior. With billions of users, so-
cial media platforms have become a crucial source of
real-time collective sentiment on various subjects, in-
cluding financial markets. When a substantial number
of users express either positive or negative sentiments
about a particular stock or the market as a whole, it
creates an overarching market mood. This mood can
either result from genuine financial news or a byprod-
uct of widespread speculative opinions. Moreover,
traders nowadays often turn to social media as a quick
pulse-check on prevailing market sentiments before
making decisions. If the aggregate sentiment is over-
whelmingly positive, it can lead to heightened buy-
ing activity, potentially causing asset prices to surge.
Conversely, a negative mood can lead to mass selling,
driving prices down. This cascading effect, where so-
cial media sentiments bolster or dampen market ac-
tivity, can trigger market frenzies.
The model of opinion dynamics is seeded with
a market mood indicator that in turn can influence
the three potential drivers of market frenzy. This is
achieved by converting the MM(t) into market mood
inputs specific for two groups, I
p
(t) and I
n
(t), through
the following generic nonlinearity (Leonard et al.,
2021).
I
p
(t) = f(MM(t) + I
0
), (9)
I
n
(t) = f(−MM(t) − I
0
), (10)
where f is a function such that f (0) = 0 and I
0
> 0
is the basal opinion drive.
In this model adopted from (Leonard et al., 2021),
the sentiment or opinion influence of the two distinct
trader types at any given time t is derived from the
market mood MM(t). The model in (9) represents the
bullish or positive trader’s sentiment influence, I
p
(t),
which is a function, f , of the market mood plus a
constant basal opinion drive, I
0
. The equation in (10)
captures the sentiment influence of the bearish or neg-
ative trader, I
n
(t). This is described by the function,
f , of the negative of the market mood subtracted from
the negative of the basal opinion drive. The function
f is such that its output for an input of zero is zero,
ensuring a mean-neutral interpretation. The term I
0
represents a fundamental, inherent sentiment bias that
is greater than zero, highlighting an intrinsic opinion
drive irrespective of prevailing market conditions. To-
gether, these equations offer a dynamic representation
of how different trader groups might respond to fluc-
tuations in market sentiment, while also accounting
for a foundational bias in their opinion formation.
Traders tend to be inattentive to minor fluctua-
tions in market mood, preferring more pronounced
alterations. To capture this nuanced behavior, the
model incorporates a “dead zone”. This can be con-
ceptualized as a threshold region where trivial mar-
ket mood fluctuations remain largely ineffective at al-
tering trader sentiments. The primary objective is to
identify the precise boundaries where trader respon-
siveness becomes paramount. By introducing the con-
ceptual “dead zone”. The function f is defined as a
nonlinear function (Leonard et al., 2021) given by:
f (x;U, L) =
x −U, if x ≥ U
0, if − L < x < U
x + L, if x ≤ −L
(11)
Where U and L are the upper and lower sensitiv-
ity thresholds, both of which are non-negative. To
ICAART 2024 - 16th International Conference on Agents and Artificial Intelligence
142

account for different types of traders, we denote U
p
and L
p
as sensitivity thresholds for bullish traders,
and U
n
and L
n
for bearish traders. Hence, the market
sentiment input for bullish traders, I
n
(t), incorporates
f (x;U
p
, L
p
) and for bearish traders, I
p
(t) is defined
using f (x;U
n
, L
n
).
3.3.1 Market Mood Drives Trader
Self-Reinforcement Dynamics
We first explore the first hypothesis. To incorpo-
rate the adaptive behavior of traders to the prevail-
ing market mood, we let the market mood inputs I
n
(t)
and I
p
(t) influence trader dynamics through the self-
reinforcing levels α
n
and α
p
. traders do not respond
instantaneously to shifts in the market mood. Their
reactions either involve adapting their strategies to
resonate with the current mood or re-evaluating their
investment portfolio. Both of these approaches ne-
cessitate time, making their responsiveness typically
gradual.
To encapsulate the overall sensitivity of trader dy-
namics to the market mood, the rates of change of α
n
and α
p
are proportional to the market mood inputs
with a common proportionality constant k
α
(Leonard
et al., 2021):
dα
p
dt
= k
α
I
p
(t) (12)
dα
n
dt
= k
α
I
n
(t) (13)
Building upon the foundational arguments pre-
sented in (Kim et al., 2023; Hirshleifer, 2020), it
is evident that market narratives often commence as
weak and heavily skewed to individual biases. Yet,
through iterative community exchanges and continu-
ous dissemination, these narratives intensify, evolving
into increasing, self-reinforcing mechanisms that pro-
foundly influence trader opinions.
The core proposition of this modeling framework
is that a strong bullish sentiment in the market [rep-
resented by MM(t) > 0] leads to an intensification
of self-reinforcing strategies among bullish traders
when MM(t) +I
0
≥ U
p
, and a diminution of the same
among bearish traders when MM(t) − I
0
≤ L
n
. Con-
versely, a pronounced bearish sentiment [indicated by
MM(t) < 0] spurs an increase in the bullish traders’
self-reinforcement when −(MM(t) − I
0
) ≥ U
n
and
a decrease in the bearish traders’ strategies when
−(MM(t) + I
0
) > L
p
. These dynamics can culminate
in an amplification of the prevailing market sentiment.
3.3.2 Market Mood Drives: Trader Herding
Dynamics
To evaluate the second hypothesis, my attention is
redirected to herding behavior, governed by the pa-
rameters γ and δ. In this context, we employ I
p
(t) and
I
n
(t) as the driving forces behind dynamic alterations
in σ, operating under the constraints α
p
= α
n
= 0 and
the magnitudes |b
p
| and |b
n
| being minimal.
The tendency to herd, characterized by a param-
eter σ, is modulated based on the prevailing market
mood. The parameter σ is introduced to influence and
control herding behavior amongst the agents in the
simulation. Given the market mood MM(t), which
ranges from −1 (representing extreme fear) to 1 (rep-
resenting extreme greed), To ensure that σ approaches
the value of +1 during extreme market moods (either
positive or negative), we can model its rate of change
as
Given:
f (x; U, L) =
1
1+e
−x
x ∈ [−U, −L] ∪ [L, U]
−
1
1+e
−x
x ∈ (−L, L)
0 otherwise
Then evolution of σ
p
and σ
n
are given by:
dσ
p
dt
= K
σ
· f (I
p
)
dσ
n
dt
= K
σ
· f (I
n
)
Subject to:
−1 ≤ σ
p
, σ
n
≤ 1
This definition ensures that herding occurs at ex-
tremes of market sentiment, capturing periods when
the market is either extremely fearful or extremely
greedy.
3.3.3 Market Mood Drives Additive Response
Dynamics
For the third hypothesis, we explore the application
of the additive responses to the signals b
p
and b
n
. We
utilize I
p
(t) and I
n
(t) to influence the dynamics of |b
p
|
and |b
n
|, in a manner similar to (12 and 13), with the
constraints α
p
= α
n
= γ
p
= γ
n
= 0.
db
p
dt
= K
b
I
p
(t) (14)
db
n
dt
= K
b
I
n
(t) (15)
Exploring the Impact of Competing Narratives on Financial Markets II: An Opinionated Trader Agent-Based Model with Dynamic Feedback
143

4 RESULTS
In this study, we employ the open-source BSE plat-
form (Cliff, 2012) for simulating a financial market,
specifically focusing on a market with a single com-
modity and 50 participants. These participants are
split equally into 25 buyers and 25 sellers, with their
roles being fixed throughout the experiment. Their
trading strategy involves the BFL-PRDE method with
a parameter setting of NP = 5. Participants’ decisions
revolve around setting their offer prices within a price
range of $60 to $250, influenced by symmetrically
shaped supply and demand curves. The BSE plat-
form utilizes a discrete approach to simulate continu-
ous trading, with a time-step of ∆t =
1
N
, guaranteeing
at least one transaction per trader per second.
In Figure 1, the market mood’s temporal variation
is depicted as two complete sine wave cycles over a
seven-day period, with hourly intervals. Mood val-
ues are quantified on a spectrum from −1 (“Extreme
Fear”) to +1 (“Extreme Greed”), with intermediate
values classified into “Fear” (−0.5 to 0), “Neutral”
(0), and “Greed” (0 to 0.5). This quantification con-
verts market sentiment into a measurable and struc-
tured format for analysis. The sine wave was chosen
for its natural symmetry, ensuring an unbiased aver-
age mood value of zero. It portrays the mood’s oscil-
lation between extreme points and neutrality, as ex-
pressed by the function MM(t) within the range of
0 to 4π, thereby encapsulating the complete mood
dynamics within the depicted time frame. Please
note that there is no suggestion here that mood in
real markets follows nice, clean sinusoidal curves;
rather, we are using these sine-wave mood functions
to give maximum clarity in explaining /exploring the
behaviour of my model.
Figure 1: Market Mood. This time series forms two perfect
cycles, transitioning through neutral, greed, extreme greed,
back to neutral, followed by fear, and then extreme fear.
Figure 2 shows the results of the three hypotheses
of driving market frenzy, using the market mood as
the influence for each controlling parameter. The re-
sults illustrate how market mood dynamics influence
the market dynamics.
In Figure 2 A, to produce α values using Equation
(13) and (12), we set α(t
0
) = 0.9 and k
α
p
= k
α
n
= 0.9.
When the self-reinforcement parameter is applied, it
is evident that when α
p
> α
n
, the positive group’s
opinions are stronger, leading to higher prices. Con-
versely, when α
p
< α
n
, the negative group is more
self-reinforcing, resulting in decreasing prices. This
is highly correlated with the underlying market mood.
In Figure 2 B, when the market mood indicates
extreme greed (σ = 1), both groups exhibit herding
behavior. This is influenced by the opinion distribu-
tion and updates, as the γ and δ dynamics are highly
dependent on the product ˆx
p
ˆx
n
. Transaction prices are
highest when both groups are herding between days
two and four and between days five and seven, which
is indeed highly correlated with the market mood.
In Figure 2 C, we observe the opinion distribu-
tion when both groups receive additive inputs from
an external source. Using Equation (14) and (13),
we set b(t
0
) = 1.0 and k
p
= k
n
= 1.0. The negative
group receives its input as a negative value. When
|b
p
| > |b
n
|, the positive group receives greater input,
resulting in stronger opinions and increasing transac-
tion prices. On the other hand, when |b
p
| < |b
n
|, the
negative group receives greater input, leading to a de-
crease in transaction prices.
4.1 Null Hypothesis Testing
We consider and reject the null hypothesis as all three
hypotheses do cause price fluctuations. In my analy-
sis of transaction prices under Hypotheses A, B, and
C, we observe distinct patterns essential in evaluat-
ing these prices’ volatility. Both the mean and me-
dian values across the hypotheses exhibit a degree of
similarity, suggesting comparable central tendencies.
However, notable differences emerge in measures of
dispersion. Hypothesis B is particularly prominent,
displaying the highest variance (227.33) and stan-
dard deviation (15.04), indicative of more significant
price fluctuations compared to Hypotheses A and C.
This finding is further reinforced by the largest range
(81.03) and the greatest number of outliers (12.02)
in Hypothesis B, suggesting more extreme variations
in price changes. Conversely, Hypotheses A and C
present lower levels of variance (110.76 for A) and
standard deviation (10.50 for A), with Hypothesis A
being relatively less volatile.
To statistically confirm these differences in price
fluctuations, we conducted the Kruskal-Wallis H test.
The results of this test showed a statistic of 5155.54
and a p-value of 0.0. The exceedingly low p-value,
effectively below the computational precision thresh-
old, provides robust evidence against the null hypoth-
esis, suggesting significant differences in the distribu-
ICAART 2024 - 16th International Conference on Agents and Artificial Intelligence
144
Hypothesis A Hypothesis B Hypothesis C
Figure 2: This figure demonstrates the comparative model dynamics as defined in equation (1) for three distinct hypotheses
regarding competing narratives, in conjunction with the syntactic market mood in Figure 1. The data is depicted as a tem-
poral function spanning a full week. Each column, labelled A, B, and C, showcases the results derived from implementing
Hypotheses A, B, and C, in that order. The top row displays the opinion dynamics distributions, with ˆx
p
(blue) and ˆx
n
(red)
representing the contrasting market sentiments. The second row captures the unique dynamics inherent to each hypothesis.
The last row visualizes the transaction prices—(black dots, with the market’s theoretical equilibrium price indicated by a
dashed red line and the polynomial trendline is plotted as a yellow line)— originating from 50 IID experiments, which are
overlaid with a 24-hour moving average and span an uninterrupted seven-day trading interval.
tion of transaction prices among the three hypotheses.
These results corroborate my initial observations de-
rived from descriptive statistics, especially highlight-
ing the distinct behavior of Hypothesis B in terms of
price fluctuations as compared to Hypotheses A and
C. This supports the notion that herding behavior, as
represented by Hypothesis B, is likely to cause the
most pronounced price fluctuations.
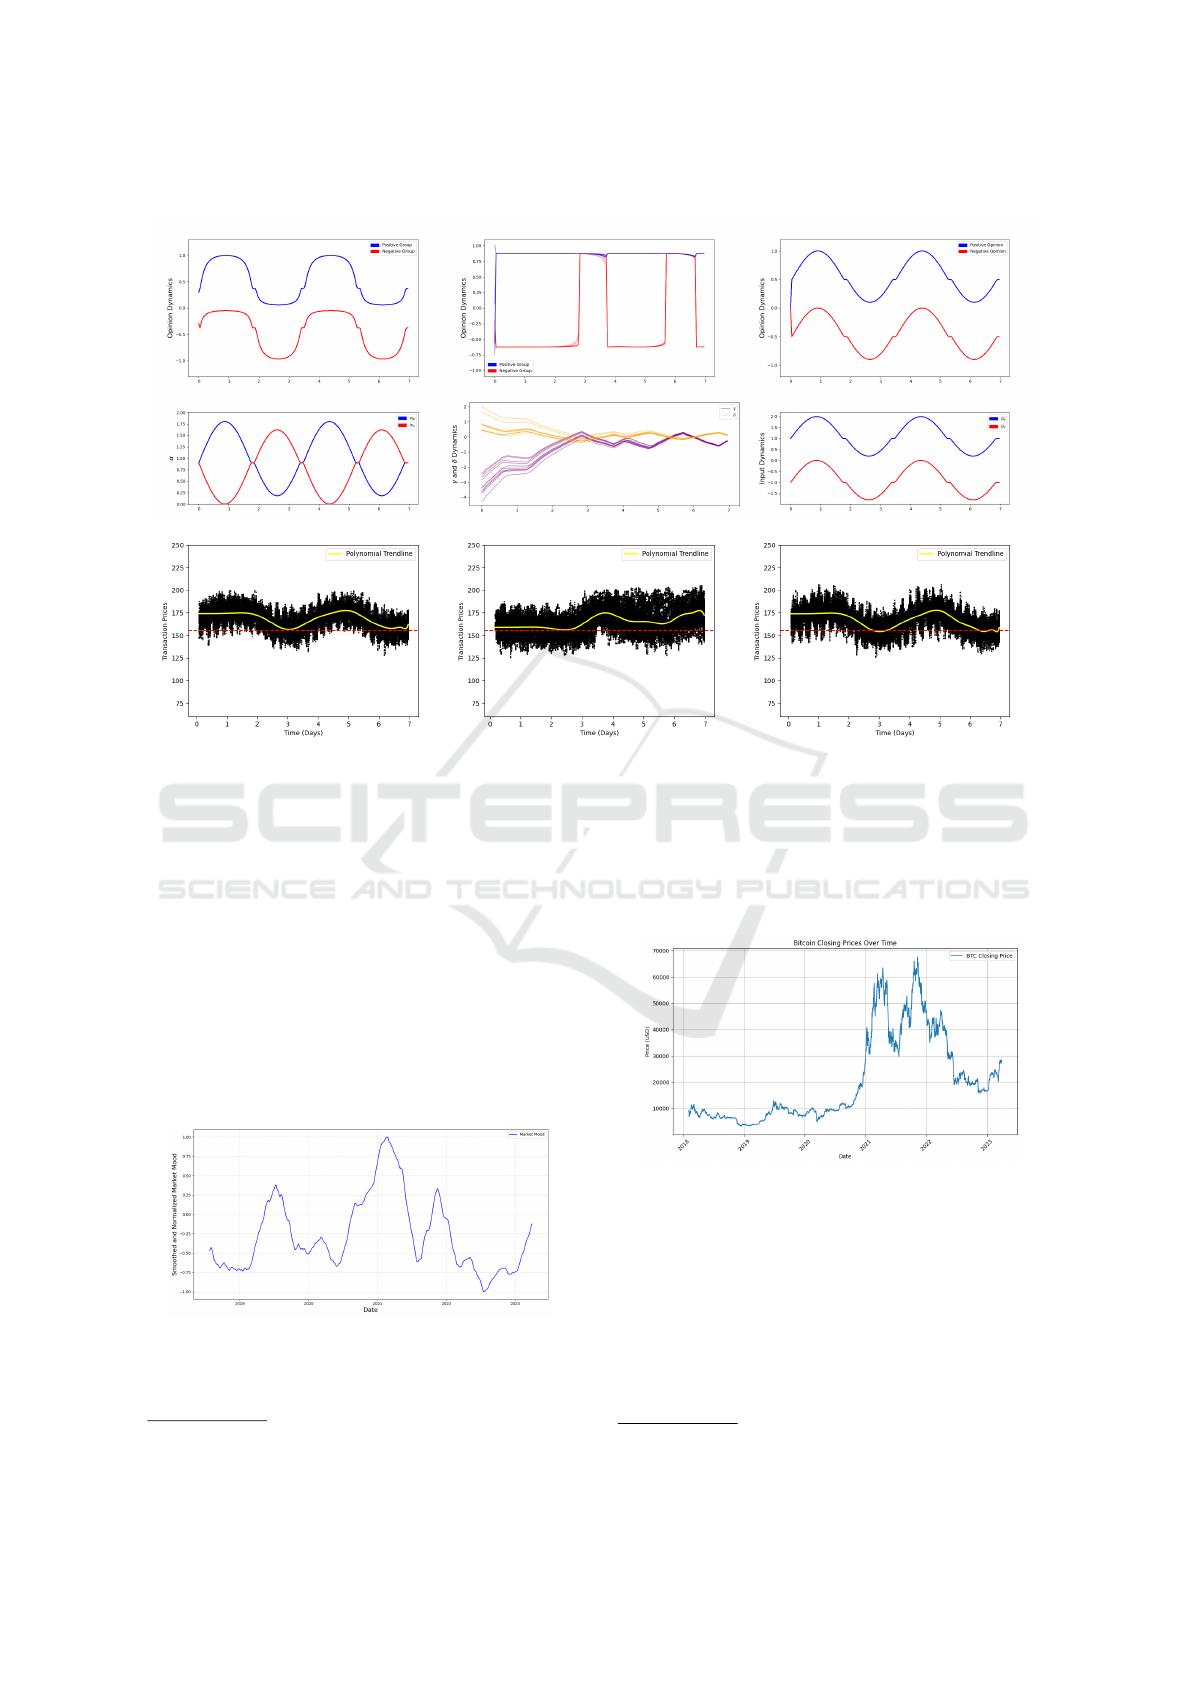
Figure 3: Real-world Market Mood. This time series is
smoothed and normalized in [−1, +1].
The dataset, sourced from
2
, depicts market mood
2
https://www.kaggle.com/datasets/adilbhatti/
Figure 4: Real-world Transaction prices.
over time as shown in Figure 3, presenting market
mood fluctuations. Each record includes a date and
a corresponding value indicating market sentiment.
For preprocessing, a simple moving average with a
window size of 100 was applied to the data, effec-
tively smoothing out short-term fluctuations and high-
lighting longer-term trends. Further normalization ad-
justed the smoothed values to fall within a range of -1
bitcoin-and-fear-and-greed
Exploring the Impact of Competing Narratives on Financial Markets II: An Opinionated Trader Agent-Based Model with Dynamic Feedback
145

to 1, rendering the dataset apt for comparative analy-
sis and interpretation of market mood dynamics. Fig-
ure 4 displays the corresponding closing prices, high-
lighting a significant spike between the years 2021
and 2022
Figure 5 displays the outcomes for three hypothe-
ses underlying market frenzy, with market mood act-
ing as the influencing factor for the controlling param-
eters. These outcomes depict the impact of market
mood on market dynamics.
In subfigure A of Figure 5, we compute α values
using Equations (13) and (12) with initial conditions
α(t
0
) = 0.9 and k
α
p
= k
α
n
= 0.9. The application of
the self-reinforcement parameter reveals that a domi-
nant α
p
over α
n
strengthens the positive group’s opin-
ions, resulting in rising prices during these periods,
while a dominant α
n
enhances the negative group’s
influence, leading to decreasing prices. As shown in
α dynamics, the largest difference between α
p
and
α
n
is during the period from year 2021 to 2022. The
transaction prices are showing the maximum increase
during the same period.
Subfigure B in Figure 5 illustrates herding behav-
ior in both groups under extreme greed conditions
(σ = 1), shaped by the opinion distribution and up-
dates, with γ and δ dynamics being highly respon-
sive to the product ˆx
p
ˆx
n
. It can be seen that when
both groups are herding toward the positive because
we assume a basis toward the positive when the mar-
ket mood reports an increased positive sentiment b
p
=
b
n
= 0.5, a significant spike in transaction prices ac-
crues during the period from year 2021 to 2022.
In subfigure C of Figure 5, the opinion distribu-
tion is shown under the influence of external additive
inputs to both groups, as described by Equations (14
and 15), setting b(t
0
) = 1.0 and k
p
= k
n
= 1.0, with
the negative group receiving inputs negatively. When
|b
p
| > |b
n
|, the positive group’s stronger inputs lead
to more robust opinions and increasing transaction
prices, while |b
p
| < |b
n
| implies the negative group’s
greater input, resulting in more influential negative
opinions and declining prices. It can be seen in in-
put dynamics that during the period from year 2021
to 2022 the positive group receives a stronger posi-
tive input, and the negative group receives a weaker
negative input.
4.2 Comparative Analysis of Model
Predictions and Bitcoin Closing
Prices
The predictive performance of three hypotheses was
quantitatively assessed against actual Bitcoin closing
prices. Data normalization was conducted using the
MinMaxScaler, aligning the scales of the model pre-
dictions with the Bitcoin price data for a direct com-
parison. The assessment utilized three error metrics:
Mean Absolute Error (MAE), Root Mean Square Er-
ror (RMSE), and the Pearson correlation coefficient.
The results for each hypothesis are presented as fol-
lows:
• Hypothesis A: Exhibited an inverse relationship
with the actual price trends, evidenced by a MAE
of 0.3432, RMSE of 0.3865, and a negative corre-
lation coefficient of -0.1711.
• Hypothesis B: Demonstrated a marginal positive
linear relationship, with a MAE of 0.4366, RMSE
of 0.4717, and a correlation coefficient of 0.0564.
• Hypothesis C: Showed a slightly stronger in-
verse relationship than H1, with a MAE of 0.3362,
RMSE of 0.3808, and a correlation coefficient of
-0.1863.
The negative correlation coefficients for Hypoth-
esis A and Hypothesis C suggest a counterintuitive
relationship, where an increase in the actual Bitcoin
prices is associated with a decrease in the model’s
predicted transactions, and vice versa. The negligible
correlation in Hypothesis B indicates an absence of
a significant linear relationship. These outcomes un-
derscore a potential misalignment between the predic-
tive models and the actual price behavior, suggesting
that the models may not adequately capture the influ-
ential market dynamics. Refinements in the models’
assumptions, parameters, and the inclusion of more
descriptive features could potentially enhance predic-
tive accuracy.
5 CONCLUSION
In conclusion, our investigation sheds light on the
complexities of financial market frenzies, particu-
larly within the context of competing narratives. Our
approach, which integrates an agent-based trading
model augmented by opinion dynamics, allows for
a meticulous evaluation of three main hypotheses:
self-reinforcement, herding behavior, and responsive-
ness to additive external inputs. Empirical analysis,
anchored in actual market data, suggests that while
each hypothesis has its role in influencing price move-
ments, it is the herding behavior that predominantly
dictates market behavior. This revelation highlights
the complex fusion of individual decision-making and
collective market sentiment in the financial domain.
Despite this, there are noticeable divergences be-
tween our model’s forecasts and the empirical Bit-
coin price data, emphasizing the challenges inherent
ICAART 2024 - 16th International Conference on Agents and Artificial Intelligence
146

Hypothesis A Hypothesis B Hypothesis C
Figure 5: Comparison of the model dynamics (1) for the three hypotheses on the transaction prices using the real-world market
mood in Figure 3. Plotted as a function of time during the time from 2018 to 2023.
in precisely simulating financial markets. Recogniz-
ing the multifaceted nature of such markets, future en-
deavors will be directed towards refining the model-
ing framework. The aim is to iteratively enhance its
sophistication, thereby improving its capacity to en-
capsulate the subtleties and volatility of market price
trajectories. This refinement process is expected to
advance our understanding of the psychological and
sociological factors that drive market behaviors, po-
tentially leading to more robust predictive models. To
facilitate replication and further advancement of this
work, I will provide the system’s source code as an
open-source repository on GitHub
3
. I look forward
to the diverse applications and enhancements the re-
search community will derive from this resource.
REFERENCES
A, A. (2024). Exploring the Impact of Competing
Narratives on Financial Markets I: An Opinionated
Trader Agent-Based Model as a Practical Testbed.
In Submitted to the 24th International Conference
on Agents and Artificial Intelligence (ICAART), vol-
ume 2, pages First Page–Last Page. INSTICC. Avail-
able at Linktothepaperifavailable.
3
See my NarrativeEconomics Repository for source
code and more details.
Aliber, R. Z., Kindleberger, C. P., and McCauley, R. N.
(2015). Manias, Panics, and Crashes: A History of
Financial Crises. Springer.
Anand, A. and Pathak, J. (2021). WallStreetBets against
Wall Street: The Role of Reddit in the Gamestop
Short Squeeze. Technical Report IIMB Working
Paper-644, Indian Institute of Management Banga-
lore.
Andreev, B., Sermpinis, G., and Stasinakis, C. (2022).
Modelling Financial Markets during Times of Ex-
treme Volatility: Evidence from the GameStop Short
Squeeze. Forecasting, 4(3):654–673.
Axtell, R. and Farmer, J. D. (2018). Agent-based modeling
in economics and finance: Past, present, and future.
Technical report.
Bizyaeva, A., Franci, A., and Leonard, N. E. (2020). A
general model of opinion dynamics with tunable sen-
sitivity. arXiv preprint arXiv:2009.04332.
Bokhari, A. and Cliff, D. (2022). Studying Narrative
Economics by Adding Continuous-Time Opinion Dy-
namics to an Agent-Based Model of Co-Evolutionary
Adaptive Financial Markets. In Proceedings of the
15th International Conference on Agents and Artifi-
cial Intelligence.
Cliff, D. (2012). Bristol Stock Exchange: open-source
financial exchange simulator. https://github.com/
davecliff/BristolStockExchange.
Cliff, D. (2018). BSE: A Minimal Simulation of a Limit-
Order-Book Stock Exchange. In Bruzzone, F., edi-
Exploring the Impact of Competing Narratives on Financial Markets II: An Opinionated Trader Agent-Based Model with Dynamic Feedback
147

tor, Proc. 30th Euro. Modeling and Simulation Sym-
posium (EMSS2018), pages 194–203.
Cliff, D. (2022). Metapopulation Differential Co-Evolution
of Trading Strategies in a Model Financial Market. In
2022 IEEE Symposium Series on Computational In-
telligence (SSCI), pages 1600–1609.
Cliff, D. (2023). Parameterised Response Zero Intelligence
Traders. Journal of Economic Interaction and Coor-
dination, pages 1–54.
Farmer, J. D., Patelli, P., and Zovko, I. (2005). The Pre-
dictive Power of Zero Intelligence in Financial Mar-
kets. Proceedings of the National Academy of Sci-
ences, 102(6):2254–2259.
Franci, A., Golubitsky, M., Bizyaeva, A., and Leonard,
N. E. (2019). A Model-Independent Theory of
Consensus and Dissensus Decision Making. arXiv
preprint arXiv:1909.05765.
Gode, D. and Sunder, S. (1993). Allocative Efficiency of
Markets with Zero-Intelligence Traders: Market as a
Partial Substitute for Individual Rationality. Journal
of Political Economy, 101(1):119–137.
Hirshleifer, D. (2020). Presidential Address: Social Trans-
mission Bias in Economics and Finance. The Journal
of Finance, 75(4):1779–1831.
Jakab, S. (2022). The Revolution That Wasn’t: GameStop,
Reddit, and the Fleecing of Small Investors. Penguin.
Kameda, T., Inukai, K., Wisdom, T., and Toyokawa, W.
(2014). The concept of herd behaviour: its psycho-
logical and neural underpinnings. Sciences, 420(8).
Kim, K., Lee, S.-Y. T., and Kauffman, R. J. (2023).
Social Informedness and Investor Sentiment in the
GameStop Short Squeeze. Electronic Markets,
33(1):23.
Ladley, D. (2012). Zero Intelligence in Economics
and Finance. The Knowledge Engineering Review,
27(2):273–286.
Leonard, N. E., Keena Lipsitz, Anastasia Bizyaeva, Alessio
Franci, and Yphtach Lelkes (2021). The nonlinear
feedback dynamics of asymmetric political polariza-
tion. Proceedings of the National Academy of Sci-
ences, 118(50):e2102149118.
Liu, S. (2021). Competition and Valuation: A Case Study
of Tesla Motors. IOP Conference Series: Earth and
Environmental Science, 692(2):022103.
Lomas, K. and Cliff, D. (2021). Exploring Narrative Eco-
nomics: An Agent-Based Modeling Platform that In-
tegrates Automated Traders with Opinion Dynamics.
In Rocha, A.-P., Steels, L., and van den Herik, J., edi-
tors, Proceedings of the 13th International Conference
on Agents and Artificial Intelligence (ICAART2021),
volume 1, pages 137–148. SciTePress.
Long, S., Lucey, B., Xie, Y., and Yarovaya, L. (2023). “I just
like the stock”: The role of Reddit sentiment in the
GameStop share rally. Financial Review, 58(1):19–
37.
Shiller, R. (2017). Narrative Economics. American Eco-
nomic Review, 107(4):967–1004.
Shiller, R. (2019). Narrative Economics: How Stories Go
Viral & Drive Major Economic Events. Princeton.
Surowiecki, J. (2004). The Wisdom of Crowds: Why the
Many Are Smarter Than the Few and How Collective
Wisdom Shapes Business, Economies, Societies, and
Nations. Doubleday, Anchor Press.
ICAART 2024 - 16th International Conference on Agents and Artificial Intelligence
148
