
Decoding Autism Diagnosis: A Journey Towards Transparency with
XAI in ML Models
Shivani Pandya
a
and Swati Jain
b
Institute of Technology, Nirma University, Sarkhej Gandhinagar Hwy, Ahmedabad, Gujarat, India
Keywords:
Autism Spectrum Disorder, Explainable Artificial Intelligence, LIME, SHAP, Machine Learning.
Abstract:
Autism Spectrum Disorder (ASD) is a developmental condition that manifests within the first three years
of life. Despite the strides made in developing accurate autism classification models, particularly utilizing
datasets like AQ-10, the lack of interpretability in these models poses a significant challenge. In response to
this concern, we employ eXplainable Artificial Intelligence (XAI) techniques, specifically Local Interpretable
Model-agnostic Explanations (LIME) and Shapley Additive exPlanations (SHAP), to enhance transparency.
Our primary aim, following the commendable accuracy achieved with the AQ-10 dataset, is to demystify the
black-box nature of machine learning models used for autism classification. LIME provides locally faithful
explanations, offering a more nuanced understanding of predictions, while SHAP quantifies the contribution
of each feature to the model’s output. Through instance-based analyses, we leverage these XAI techniques
to delve into the decision-making processes of the model at an individual level. Integrating LIME and SHAP
not only elevates the model’s trustworthiness but also helps a deeper comprehension of the factors influencing
autism classification. Our results underscore the efficacy of these techniques in unraveling the intricacies of
the model’s decisions, shedding light on relevant features and their impact on classification outcomes. This re-
search contributes to bridging the gap between accuracy and interpretability in machine learning applications,
particularly within the realm of autism classification.
1 INTRODUCTION
Autism Spectrum Disorder (ASD) is a behavioral
condition that affects how individuals interact with
society throughout their lifetime. Symptoms of ASD
typically appear during childhood and persist into
adolescence and adulthood (Hasin et al., 2013). ASD
patients exhibit repetitive behaviors, and analyzing
these behaviors can aid in early detection. The di-
versity of behaviors demonstrated by ASD patients
depends on age and ability. Common behavioral dis-
orders in ASD patients include deficient expressive
gestures, non-responsiveness to sound, lack of proper
eye contact, no sensation of pain, repetition of words,
and agitation with changes in daily routines (Hasin
et al., 2013). Compared to healthy populations, sib-
lings of individuals with autism are at a fifty times
greater risk of developing ASD (Joseph and Tager-
Flusberg, 1997). Additionally, males are 4-5 times
more likely to be affected than females. The World
Health Organization reports that 1 in 160 children
a
https://orcid.org/0000-0001-9348-1840
b
https://orcid.org/0000-0002-5708-7472
worldwide is prone to developing ASD at any given
time. Hong Kong, South Korea, and the United States
have the highest prevalence rates of ASD. In India,
the prevalence rate is 1 in 500, with an incidence rate
of 11,914 people yearly. In recent years, ASD preva-
lence has increased from 15 to 64 per 10,000 in India
(Geetha et al., 2019). According to the Autism Soci-
ety of America, the incidence rate of autism is rising
at a rate of 10-17% each year in the USA. In 2020, the
CDC (Centers for Disease Control and Prevention) re-
ported a 10% increase in autism incidence rate, with 1
in 54 children in the USA being diagnosed with ASD.
These statistics are alarming, considering that ASD is
a rare disease (Shaw et al., 2023).
While ASD cannot be fully cured, early detec-
tion of symptoms can help reduce the effects of
the disease. Machine learning (ML) has been ap-
plied to predicting and detecting various diseases with
good accuracy, including ASD, based on multiple
physical and physiological parameters (Raj and Ma-
sood, 2020). However, detecting and analyzing ASD
is challenging due to the existence of other men-
tal health problems with typical symptoms, which
700
Pandya, S. and Jain, S.
Decoding Autism Diagnosis: A Journey Towards Transparency with XAI in ML Models.
DOI: 10.5220/0012456300003657
Paper published under CC license (CC BY-NC-ND 4.0)
In Proceedings of the 17th International Joint Conference on Biomedical Engineering Systems and Technologies (BIOSTEC 2024) - Volume 2, pages 700-707
ISBN: 978-989-758-688-0; ISSN: 2184-4305
Proceedings Copyright © 2024 by SCITEPRESS – Science and Technology Publications, Lda.

can result in false detection. To address this issue,
a machine learning model is proposed in this paper
for early prediction of ASD through screening test
datasets, with the application of Explainable Artificial
Intelligence (XAI) to identify the contribution of fea-
tures towards accurate prediction. Comparative case
studies have been conducted using available features
in the dataset and the most contributing features pre-
dicted by XAI through performance metrics: accu-
racy, precision, recall, and F1-score (Das and Rad,
2020).
1.1 Contribution
1. This research focuses on detecting ASD using
AQ-10 datasets. It provides a comprehensive
guide on implementing machine learning algo-
rithms specifically designed for this purpose.
2. Addresses interpretability issue in black box mod-
els with XAI techniques (LIME and SHAP).
3. Provides detailed analysis of each prediction and
identifies specific attributes with the greatest im-
pact on the decision-making process.
The paper is divided into four main sections. Sec-
tion 2 explores the related work, providing a context
and existing knowledge in the field. Moving forward,
Section 3 gives a concise overview of the dataset and
describes the pre-processing steps taken. Section 4
presents the proposed work and provides an in-depth
examination of the methodology used in our exper-
iments. Section 5 unveils the results of our exper-
iments and engages in a comprehensive discussion.
Finally, Section 6 delivers a conclusive summary and
findings, encapsulating the paper’s key insights and
future scope.
2 RELATED WORK
Based on the reviewed literature, Machine Learning
(ML) techniques have proven highly effective in pre-
dicting various diseases based on syndromes. For ex-
ample, Cruz et al. (Cruz and Wishart, 2006) used
ML to diagnose cancer, demonstrating its broad range
of applications in predicting diseases. Khan et al.
(Khan et al., 2017) also employed ML to predict dia-
betes, showcasing its versatility in addressing differ-
ent health concerns. Wall et al. (Wall et al., 2012) uti-
lized the Alternating Decision Tree (ADTree) method
to detect ASD traits and achieved high accuracy
within a specific age range (5-17 years). However,
their approach was limited in its ability to predict
ASD across diverse age groups. Bone et al. (Bone
et al., 2016) applied a Support Vector Machine (SVM)
to predict ASD traits, achieving notable sensitivity
and specificity. However, the study faced constraints
due to a wide age range (4-55 years). Allison et
al. (Allison et al., 2012) achieved over 90% accu-
racy in ASD screening by employing the ’Red Flags’
tool in conjunction with the Autism Spectrum Quo-
tient. Thabtah (Thabtah, 2017) conducted a compre-
hensive comparative analysis of previous ML algo-
rithms for autism trait prediction. In contrast, Hauck
and Kliewer (Hauck and Kliewer, 2017) identified
pivotal screening questions for the Autism Diagnos-
tic Observation Schedule (ADOS) and Autism Diag-
nostic Interview-Revised (ADI-R) methods, empha-
sizing the efficacy of their combined use. Bekerom
(van den Bekerom, 2017) used various ML techniques
to discern ASD traits in children, accounting for fac-
tors like developmental delay, obesity, and physi-
cal activity levels. Wall et al. (Wall et al., 2012)
made progress in classifying autism through concise
screening tests, with the ADTree and functional tree
exhibiting promising results. Heinsfeld (Heinsfeld
et al., 2018) explored algorithms and neural networks
for identifying ASD patients, achieving classification
accuracy ranging from 66% to 71%. Meanwhile,
Liu (Liu et al., 2016) investigated the potential of
face-scanning patterns to identify children with ASD,
achieving exceptional accuracy, specificity, sensitiv-
ity, and Area Under the Curve (AUC) metrics. Bone
et al. (Bone et al., 2015) conducted a meticulous
analysis of prior studies, addressing conceptual and
methodological issues and successfully replicating re-
sults using their ML approach. Despite the extensive
research in this field, a definitive conclusion regard-
ing the universal applicability of ML-based autism
screening across age groups remains elusive. There-
fore, the existing tools and techniques call for devel-
oping a comprehensive app-based solution tailored to
different age demographics.
Numerous studies have delved into the application
of machine learning techniques to predict ASD from
high-dimensional datasets. Archana et al. (Archana
et al., 2023) introduced a comprehensive methodol-
ogy encompassing dimensionality reduction, feature
extraction, and classifier selection, achieving notable
advancements in ASD prediction. Their approach
addresses the challenge posed by large feature sets
in high-dimensional data. Additionally, similar ef-
forts have been made by several researchers. They
demonstrated promising results in refining classifiers
for enhanced ASD prediction. Furthermore, it exam-
ined various classifiers, emphasizing the potential of
Decision Tree classifiers in achieving high accuracy
rates in ASD prediction. Building upon these pre-
Decoding Autism Diagnosis: A Journey Towards Transparency with XAI in ML Models
701

ceding works, the current study refines and extends
these methodologies, achieving a remarkable testing
accuracy of 97.47% with a reduced feature set of 254
features and a model training time of 23.508 seconds.
This research contributes significantly to the evolving
landscape of machine learning-based ASD prediction,
offering promising avenues for improving early diag-
nosis and intervention strategies for individuals with
ASD.
3 DATASET DESCRIPTION AND
PRE-PROCESSING
Data is a crucial component in AI, and to achieve sub-
stantial efficiency, a large amount of data must be an-
alyzed. Numerous resources have been dedicated to
collecting data, including Dr. Fadi Fayez Thabtah
(Thabtah, 2019; Thabtah et al., 2018), who has fo-
cused on autism assessment in young children. The
dataset used in this study was curated through the
ASDTests mobile application, which can be accessed
at ASDTest. This dataset represents a significant ad-
vancement in screening autism, particularly in infants,
and highlights several influential factors that require
further exploration. These factors are essential not
only for detecting autistic traits but also for refining
the categorization of ASD. As part of the diagnosis
process for ASD, behavioral traits are recorded using
the Q-chat-10 questionnaire.
This dataset has been designed specifically for
classification tasks in ASD. It consists of 704 in-
stances, with each instance containing 21 attributes.
These attributes include a mix of categorical, con-
tinuous, and binary data. The dataset provides de-
mographic details such as age and gender, as well
as contextual factors like ethnicity and family history
of Pervasive Developmental Disorders (PDD). Addi-
tionally, it includes specifics about the screening pro-
cess, such as who completes the test, the country of
residence, and whether a screening app was used pre-
viously. The dataset also describes screening methods
by age category and captures binary responses (0 or 1)
to ten questions as mentioned in table 1 integral to the
screening process.
In the process of developing a classification
model, the attributes, denoted as [X], serve as in-
dependent variables. These features are utilized to
construct the model, where the target variable, rep-
resented as [Y], is binary. Specifically, [Y] indicates
the presence (1) or absence (0) of autistic traits.
4 PROPOSED WORK
Our primary objective is to build a model that gener-
ates predictions and provides insight into its decision-
making process. We aim to understand the reasons be-
hind the model’s decisions and the factors contribut-
ing to its predictions. This requires us to examine
each output and explain the basis of each decision. As
we implement machine models, it is crucial to con-
sider interpretability in the model’s outcomes.
4.1 LIME
Local Interpretable Model-agnostic Explanations
(LIME) (Ribeiro et al., 2016) is a technique that aims
to explain the predictions of machine learning mod-
els, particularly those considered black-box models.
The main goal of LIME is to provide interpretable
explanations for individual predictions, which can
help humans understand why a specific prediction
was made. The process involves selecting a particular
instance and generating perturbed versions of that
instance by slightly and randomly modifying its
features. These perturbed instances are then used
to obtain predictions from the black-box model.
After that, a locally interpretable linear regression
model is trained on the perturbed instances and their
corresponding black-box model predictions. The
optimization problem can represent the working
equation of LIME:
minimize L( f , g, π
x
) = E
x
′
∼π
x
[L ( f , g, x
′
)]+Ω(g)
Here, f represents the black-box model, g is the
interpretable model, π
x
is the probability distribution
over perturbed instances, x
′
is a perturbed instance,
L is a loss function measuring the difference be-
tween black-box and interpretable model predictions,
and Ω(g) is a regularisation term discouraging model
complexity. This equation encapsulates the optimiza-
tion problem that LIME addresses, seeking an inter-
pretable model g that effectively captures the behavior
of the complex model f for the chosen instance while
promoting simplicity through regularisation.
4.2 SHAP
SHapley Additive exPlanations (SHAP) (Lundberg
and Lee, 2017) is an algorithm that helps explain the
output of machine learning models fairly and consis-
tently. It uses the concept of Shapley values from
cooperative game theory, where each feature is con-
sidered as a ”player” in a game, with the prediction
being the outcome. The Shapley value provides a
HEALTHINF 2024 - 17th International Conference on Health Informatics
702
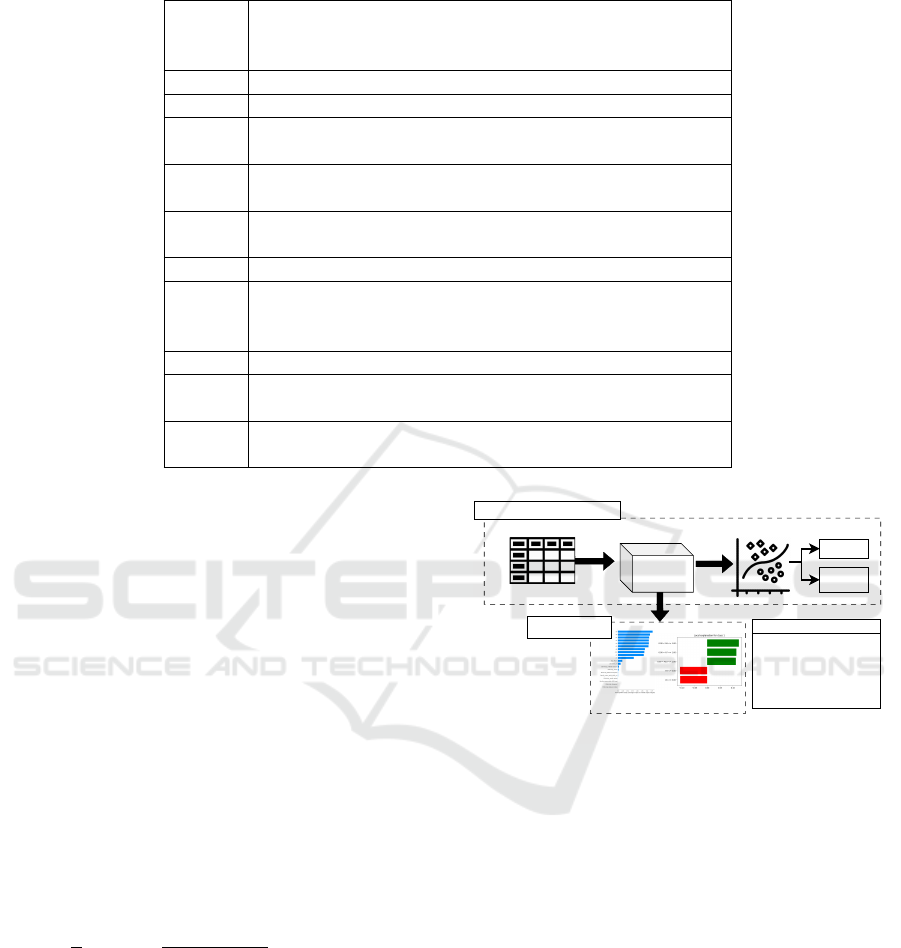
Table 1: Q-chat-10-Toddler Features Corresponding to Variables in Dataset.
Variable
in
Dataset
Corresponding Q-chat-10-Toddler Feature
A1 Does your child look at you when you call his/her name?
A2 How easy is it to make eye contact with your child?
A3 Does your child point to indicate that s/he wants some-
thing? (e.g., a toy that is out of reach)
A4 Does your child point to share interest with you? (e.g.,
pointing at an interesting sight)
A5 Does your child pretend? (e.g., care for dolls, talk on a
toy phone)
A6 Does your child follow where you’re looking?
A7 If you or someone else in the family is visibly upset, does
your child show signs of wanting to comfort them? (e.g.,
stroking hair, hugging them)
A8 Would you describe your child’s first words as:
A9 Does your child use simple gestures? (e.g., wave good-
bye)
A10 Does your child stare at nothing with no apparent pur-
pose?
way to distribute the contribution of each feature to
the model’s prediction fairly.
The algorithm considers all possible feature com-
binations for each prediction using a permutation-
based approach. It calculates the difference in the
model output when a feature is included versus when
it is excluded, representing the marginal contribution
of that feature. The Shapley value for a specific fea-
ture is then computed by taking the weighted average
of these marginal contributions over all possible com-
binations. The weights are determined by the number
of ways each combination can occur.
Mathematically, the equation for SHAP values
for a particular feature i in a specific prediction
instance involves a summation of all possible subsets
of features. This equation ensures that the Shapley
values satisfy essential properties such as consistency
and linearity.
φ
i
( f ) =
1
N
∑
S⊆N\{i}
|S|!·(|N|−|S|−1)!
|N|!
[ f (S ∪ {i}) − f (S)]
In this equation, N represents the set of all fea-
tures, S is a subset excluding feature i, and f (S) and
f (S ∪ {i}) denote the model output for subsets S and
S with feature i included, respectively. The Shap-
ley value for feature i is determined by considering
its marginal contribution to all possible subsets, en-
suring a comprehensive and fair explanation of the
model’s predictions. The workflow of both algo-
rithms is shown in figure 1.
For Feature Importantace and
Ranking
LIMESHAP
ML/ DL model Classification
Dataset
Autistic
Non-
Autistic
Result
But why?
Machine Learning workflow
Explainable AI
Black box
Relevent Feature and score
A9
(geasture)
A7 (Sign of
comfort)
A6 (Looking
where point)
0.085085
0.048019
0.052081
Figure 1: Proposed Methodology for XAI.
5 RESULT AND DISCUSSION
We used various machine learning algorithms on the
AQ-10 dataset, a questionnaire designed to measure
autistic traits. During the development of a model, the
data preprocessing stage is carried out on the whole
dataset. This stage includes tasks such as handling
missing values and scaling features. After this, the
dataset is divided into two sets: 80% for the train-
ing set and 20% for the testing set. Hyperparame-
ter tuning is then performed. Following this, cross-
validation is applied to the training set to assess the
model’s generalization across different subsets.
The final model is then trained on the entire train-
ing set. Its evaluation is carried out on a separate
testing set that was not used in the preceding stages.
while evaluations are based on metrics such as accu-
Decoding Autism Diagnosis: A Journey Towards Transparency with XAI in ML Models
703
racy, precision, recall, and F1 score. The performance
of each model on the AQ-10 dataset is summarized
below in the table. 2.
Following the implementation of machine learn-
ing algorithms on the dataset, we specifically chose
the Random Forest algorithm to interpret the model
predictions. The selection was motivated by the en-
semble nature of Random Forest, which consists of
multiple decision trees. Understanding individual de-
cision trees can be challenging due to their com-
plex structures, prompting our preference for Random
Forests as they provide a diverse collection of trees,
contributing to a more interpretable and robust model.
Table 2: Autism Screening AQ-10 dataset Accuracy.
Algorithm Training Acc Testing Acc
Decision Tree 1.0 1.0
SVM 1.0 1.0
Logistic Regression 1.0 1.0
Random Forest 1.0 0.995
k-Nearest Neighbors (knn) 0.962 0.947
MLP 0.93 0.92
We have chosen two instances to compare. In In-
stance 1, the class label is ’Yes’ or ’1’, representing
the presence of autistic traits. In Instance 2, the class
label is ’No’ or ’0’, representing the absence of autis-
tic traits or non-autistic. We applied the random forest
algorithm and then used the LIME and SHAP meth-
ods to interpret the model’s decisions. Below are the
results.
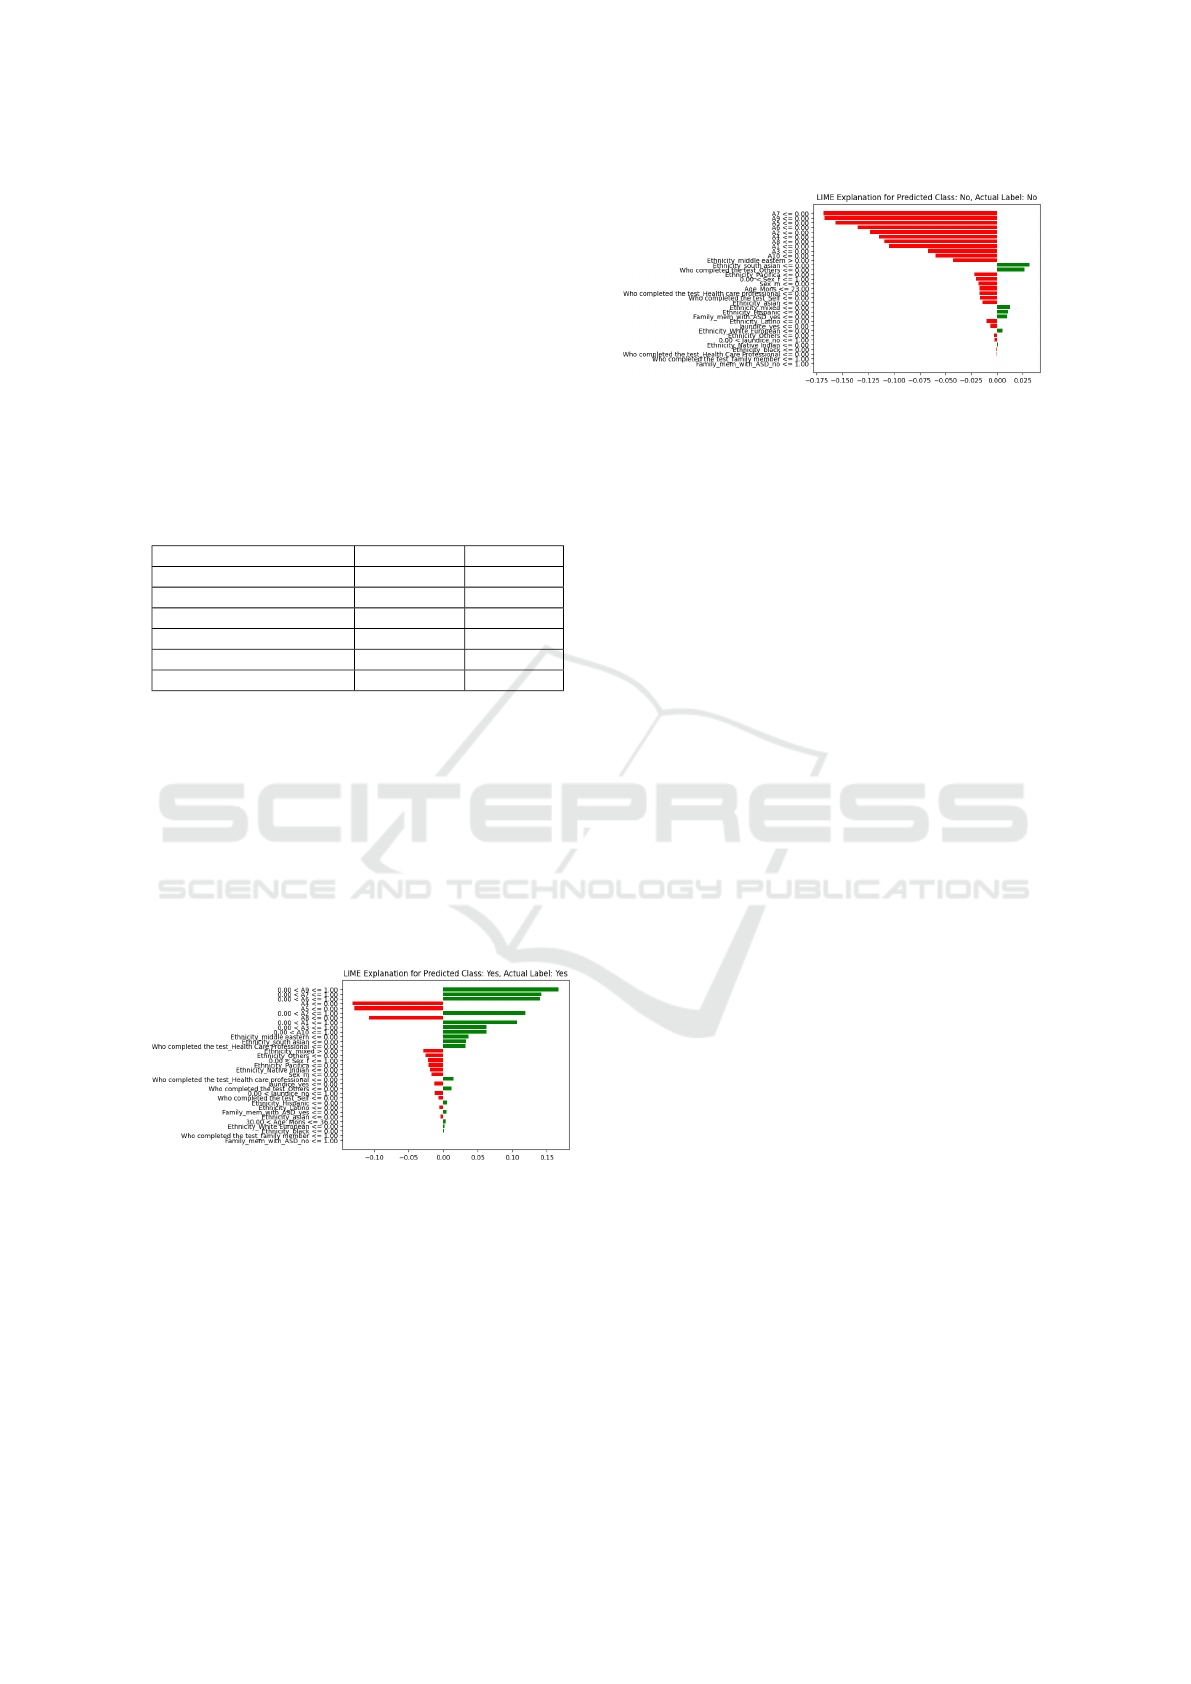
5.1 LIME: Interpretation
Figure 2: LIME interpretation for Instance 1, where the in-
dividual identifies as autistic Class: Yes.
LIME plays a crucial role in making autism classifica-
tion model predictions more understandable through
visualizations that highlight positive and negative as-
sociations with specific features. Consider Figure. 2,
where the model establishes a positive relation be-
tween features A9, A7, and A6 and the likelihood of
predicting autism. In this visualization, a green color
signifies this positive association. The intensity of the
green color indicates that higher levels of these fea-
Figure 3: LIME interpretation for Instance 2, where the in-
dividual identifies as non-autistic Class: No.
tures are linked to an increased probability of autism
prediction. Now, consider another scenario, as shown
in Figure 3, where features negatively affect autism
prediction. In this case, LIME represents the negative
correlation with a red color. The increasing intensity
of red communicates that as these features increase,
there is a decreased likelihood of the model predicting
autism. These color-coded visualizations from LIME
offer valuable insights into the importance of specific
features in predicting outcomes for individual cases.
They contribute to a nuanced understanding of how
the model makes decisions in autism classification.
Consider Instance 1, depicted in Figure 4. In this
case, the actual label is autistic. The prediction label
score is notably high at 0.99 for a ”YES” prediction,
indicating a 99% probability that the person is autis-
tic. This score is derived from a combination of dif-
ferent features, and the contribution of each feature is
visually represented in the figure. Conversely, when
the actual label is non-autistic (NO), as illustrated in
Figure 5, the prediction score is much lower at 0.071.
This implies that there is a mere 0.071% chance that
the person could be autistic, leading the model to pre-
dict a non-autistic classification. Analyzing such re-
sults allows us to interpret the model’s predictions and
conduct a detailed analysis of the contribution of each
feature to the model’s decision-making process.
5.2 SHAP: Interpretation
SHAP is a global interpretation method that helps un-
derstand how a model operates. As shown in Figure
6, the summary plot is an excellent tool for visualiz-
ing how each feature contributes to the model’s out-
come. The plot uses a color-coding system to repre-
sent each feature based on its distance from the base-
line. Warmer colors are used for features that have
a more significant impact on the model’s prediction.
In contrast, cooler blue colors indicate a negative or
lesser impact on the model’s outcome. The SHAP
summary plot aids users in comprehending the impact
of individual features on the model’s predictions, en-
hancing the interpretability of the model by providing
HEALTHINF 2024 - 17th International Conference on Health Informatics
704
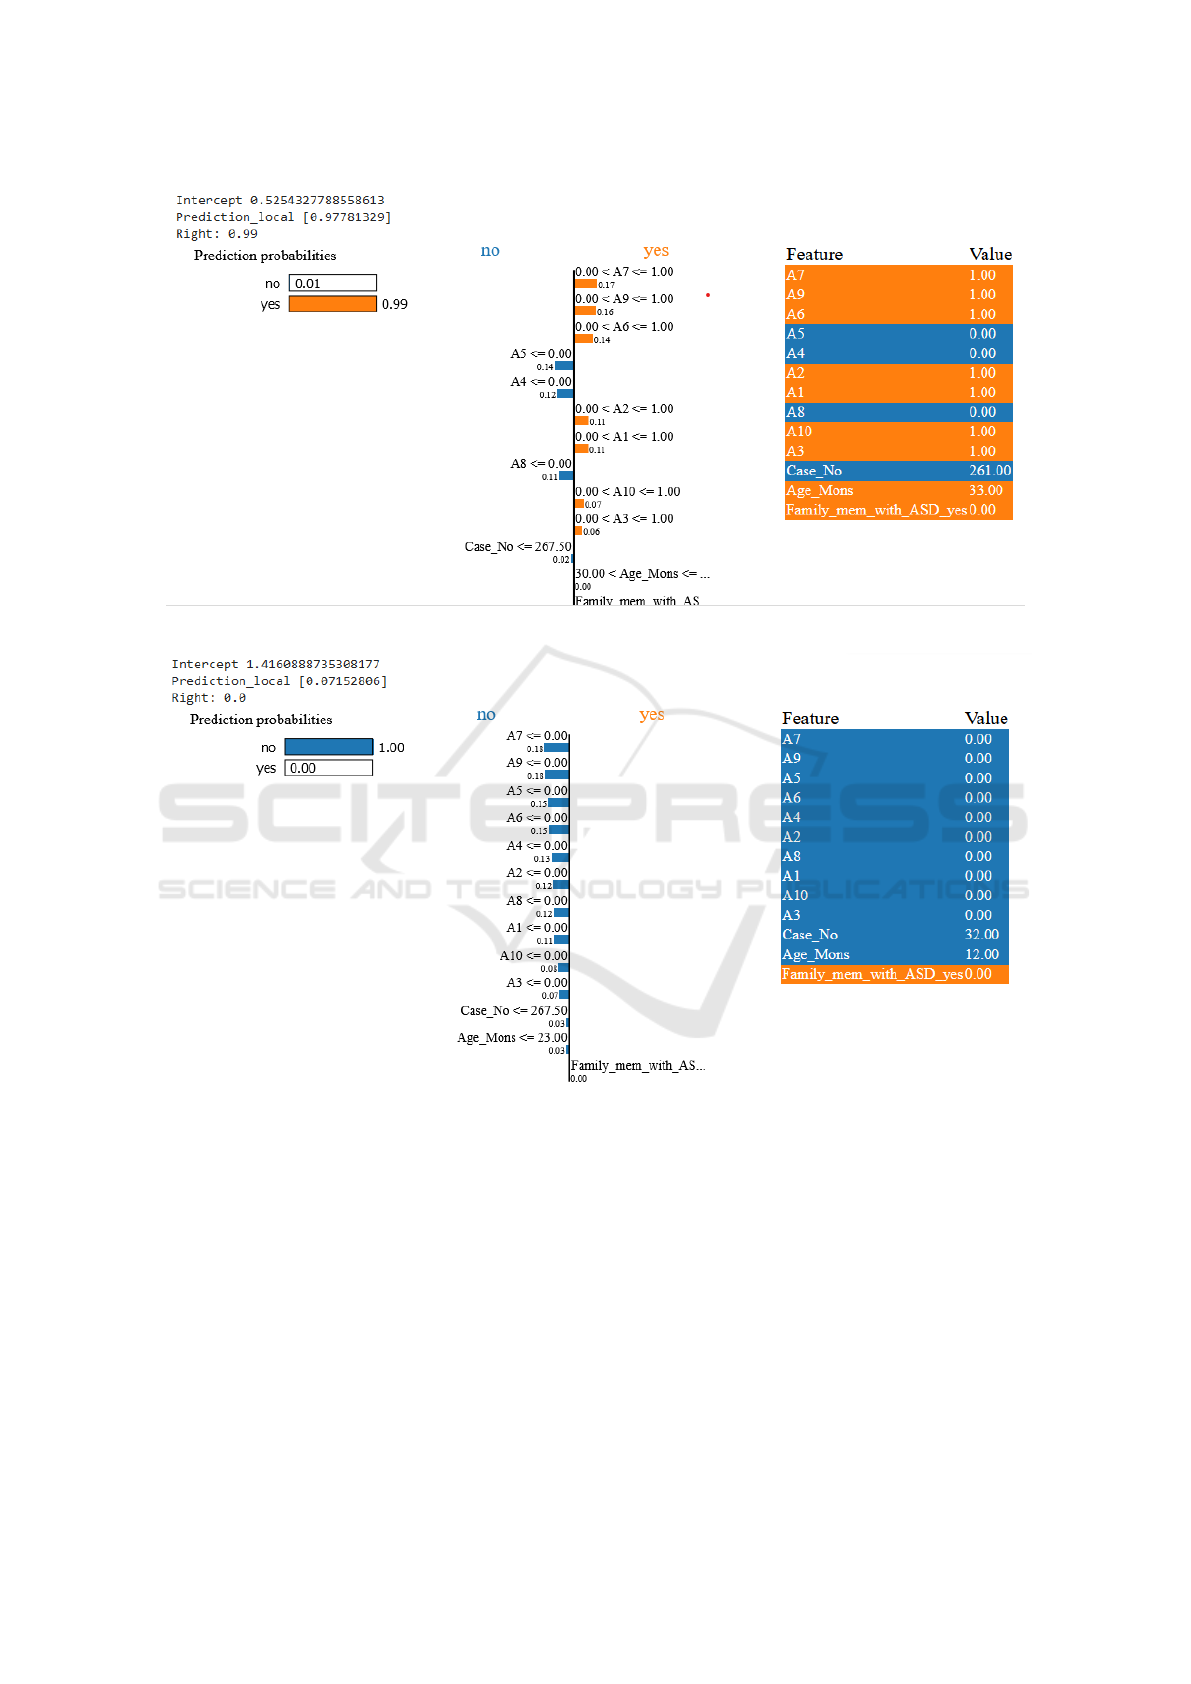
Figure 4: LIME interpretation for autistic class.
Figure 5: LIME interpretation for non-autistic class.
insights into the relative importance and directionality
of each feature.
In this detailed analysis using SHAP values, we
focus on interpreting the predictions of a model for
two instances; for instance 1 7, we observe positive
SHAP values for attributes A1, A2, A3, A6, A7, A9,
and A10. This means that higher values in these at-
tributes positively predict Yes meaning the presence
of autistic traits. By this, we can observe that Features
such as A9 (with a SHAP value of 0.085085) have a
powerful positive impact on the model’s affirmative
prediction.
On the other hand, for instance, 2, 8, which is
labeled as No, we observe negative SHAP values for
attributes A1 to A10. This indicates that higher values
in these attributes negatively influence the model’s
prediction of the absence of autistic traits. Features
like A9 have a significant impact on predicting the
negative outcome. We can clearly understand the
interpretation of the SHAP values using the color-
coded visualization, where red highlights feature
with higher values that strongly impact positive
predictions. In comparison, blue indicates features
with higher values that have a mitigated impact on
negative predictions. This comprehensive analysis
Decoding Autism Diagnosis: A Journey Towards Transparency with XAI in ML Models
705
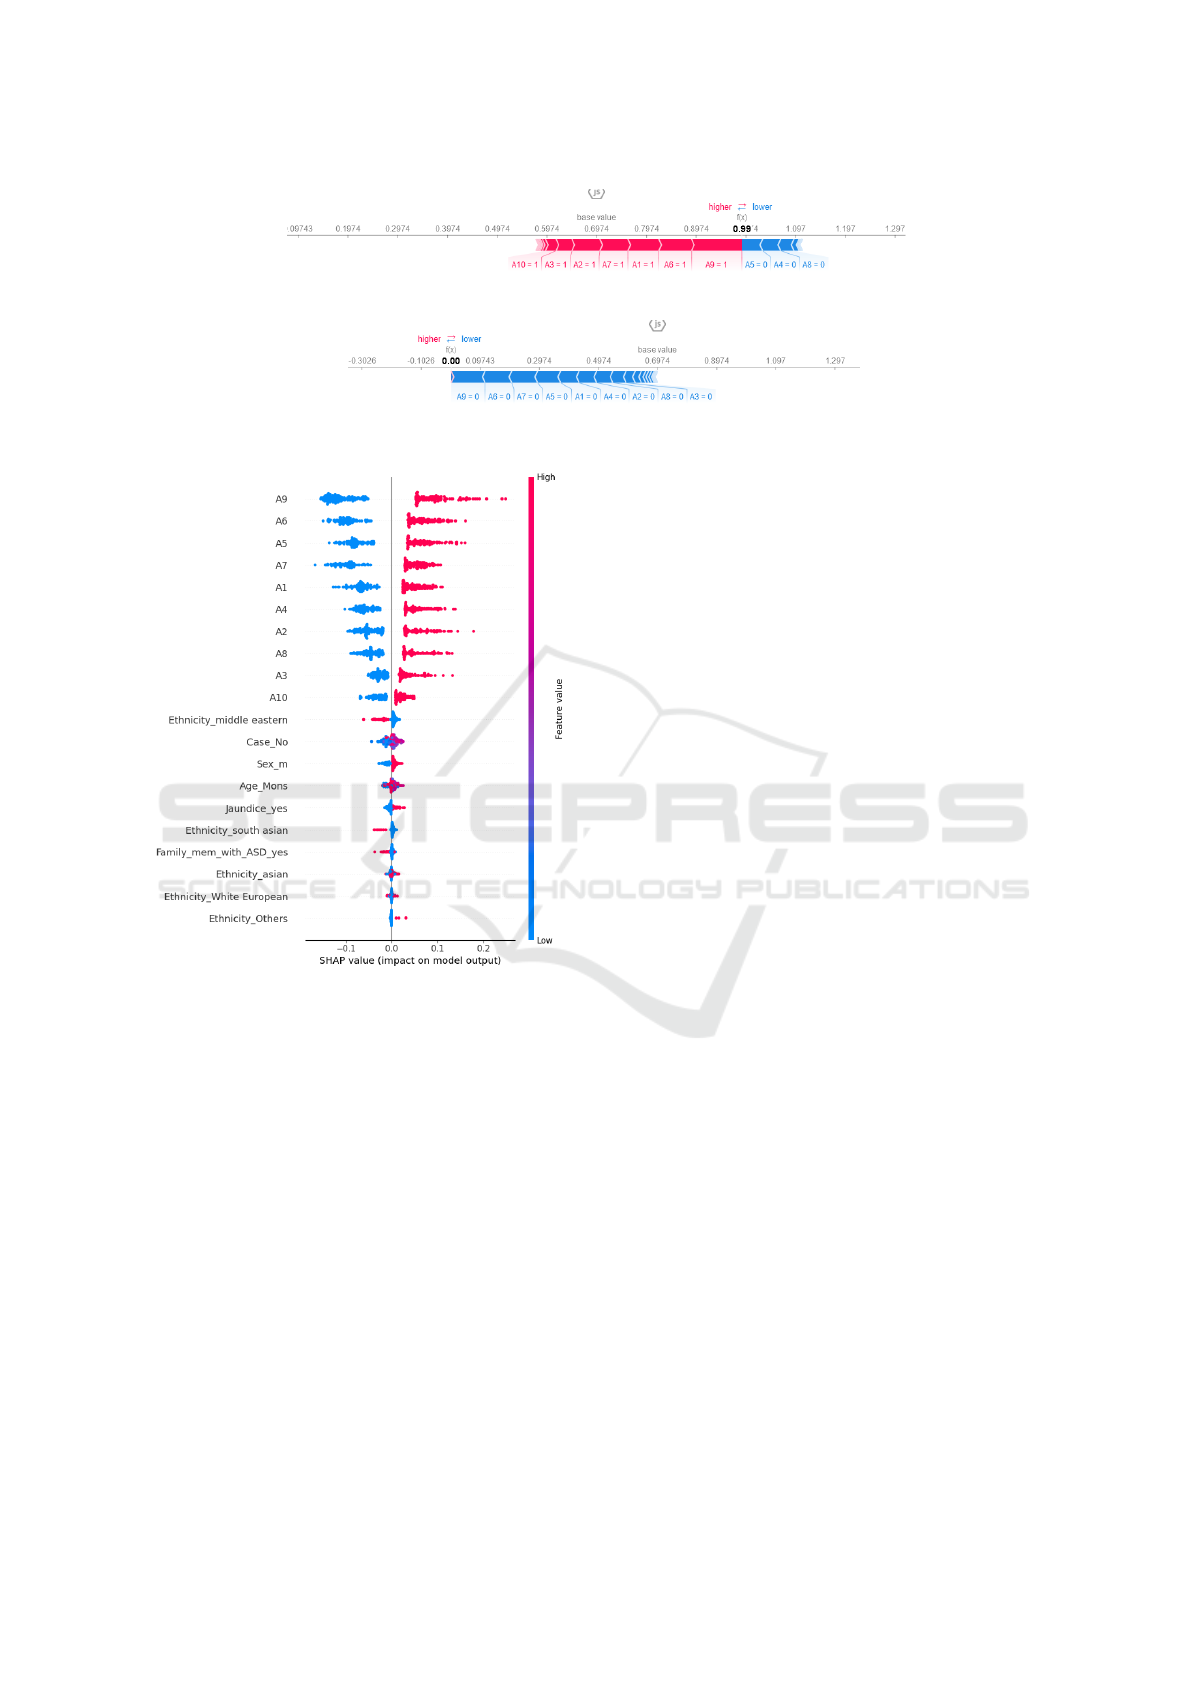
Figure 7: SHAP interpretation for Instance 1, where the individual identifies as autistic Class: Yes.
Figure 8: SHAP interpretation for Instance 2, where the individual identifies as non-autistic Class: No.
Figure 6: SHAP summary of overall model prediction.
provides a nuanced understanding of the importance
of features in individual predictions. It underscores
the transparency and interpretability offered by SHAP
values in unraveling the intricacies of the model’s
decision-making process.
Through an examination of LIME and SHAP
analyses, it becomes evident that features such as
”Does your child use simple gestures? (A9),” ”Does
your child comfort you? (A7),” and ”Does your child
follow where you point? (A6)” play a pivotal role
in both positive and negative predictions made by
the model. Notably, these features exhibit significant
prominence in the SHAP values as well. This sub-
stantiates the conclusion that gestures, expressions of
comfort, and the ability to follow directions are ar-
eas where individuals with autism may experience
discomfort or challenges. The consistent emphasis
on these features in both LIME and SHAP analyses
strengthens the inference that they significantly in-
fluence the model’s predictions. This insight holds
valuable implications for tailoring child-oriented ther-
apies, as it underscores the importance of addressing
and supporting individuals with autism in the domains
of gestural communication, providing comfort, and
following cues. Leveraging these findings can con-
tribute to developing more targeted and effective in-
terventions for autistic children, fostering better un-
derstanding and support in areas where they may face
difficulties.
6 CONCLUSION AND FUTURE
SCOPE
In our approach to autism classification through var-
ious machine learning algorithms, our goal is to
achieve consistent accuracy while acknowledging the
inherent complexity of these models. We employ De-
cision Trees, Random Forests, SVM, Logistic Regres-
sion, knn, and an MLP. Emphasizing interpretability,
we leverage two widely used eXplainable Artificial
Intelligence methods—SHAP and LIME. SHAP em-
ploys game theory principles to calculate Shapley val-
ues, providing insights into how features collectively
impact predictions. Meanwhile, LIME offers specific,
instance-level explanations. Looking ahead, we plan
to enhance explanations by incorporating domain-
specific knowledge, exploring advanced visualization
techniques, and staying current with emerging in-
terpretability methods in healthcare data. We aim
for continuous adaptation, real-time model monitor-
ing, and exploring novel approaches to boost trans-
parency. This includes integrating model-agnostic in-
terpretability methods with domain-specific knowl-
edge and staying informed about state-of-the-art tech-
niques. Through these efforts, we aspire to improve
transparency in our autism classification model and
contribute to advancing interpretable machine learn-
ing in clinical applications.
HEALTHINF 2024 - 17th International Conference on Health Informatics
706

REFERENCES
Allison, C., Auyeung, B., and Baron-Cohen, S. (2012). To-
ward brief “red flags” for autism screening: The short
autism spectrum quotient and the short quantitative
checklist in 1,000 cases and 3,000 controls. Journal
of the American Academy of Child & Adolescent Psy-
chiatry, 51(2):202–212.
Archana, P., Sirisha, G., and Chaitanya, R. K. (2023).
Prediction of autism spectrum disorder from high-
dimensional data using machine learning techniques.
Soft Computing, pages 1–7.
Bone, D., Bishop, S. L., Black, M. P., Goodwin, M. S.,
Lord, C., and Narayanan, S. S. (2016). Use of machine
learning to improve autism screening and diagnos-
tic instruments: effectiveness, efficiency, and multi-
instrument fusion. Journal of Child Psychology and
Psychiatry, 57(8):927–937.
Bone, D., Goodwin, M. S., Black, M. P., Lee, C.-C., Au-
dhkhasi, K., and Narayanan, S. (2015). Applying ma-
chine learning to facilitate autism diagnostics: pitfalls
and promises. Journal of autism and developmental
disorders, 45:1121–1136.
Cruz, J. A. and Wishart, D. S. (2006). Applications of
machine learning in cancer prediction and prognosis.
Cancer informatics, 2:117693510600200030.
Das, A. and Rad, P. (2020). Opportunities and challenges
in explainable artificial intelligence (xai): A survey.
arXiv preprint arXiv:2006.11371.
Geetha, B., Sukumar, C., Dhivyadeepa, E., Reddy, J. K.,
and Balachandar, V. (2019). Autism in india: a case–
control study to understand the association between
socio-economic and environmental risk factors. Acta
Neurologica Belgica, 119(3):393–401.
Hasin, D. S., O’brien, C. P., Auriacombe, M., Borges, G.,
Bucholz, K., Budney, A., Compton, W. M., Crowley,
T., Ling, W., Petry, N. M., et al. (2013). Dsm-5 criteria
for substance use disorders: recommendations and ra-
tionale. American Journal of Psychiatry, 170(8):834–
851.
Hauck, F. and Kliewer, N. (2017). Machine learning for
autism diagnostics: applying support vector classifica-
tion. In Int’l Conf. Heal. Informatics Med. Syst, pages
120–123.
Heinsfeld, A. S., Franco, A. R., Craddock, R. C., Buch-
weitz, A., and Meneguzzi, F. (2018). Identification of
autism spectrum disorder using deep learning and the
abide dataset. NeuroImage: Clinical, 17:16–23.
Joseph, R. M. and Tager-Flusberg, H. (1997). An investiga-
tion of attention and affect in children with autism and
down syndrome. Journal of autism and developmental
disorders, 27(4):385–396.
Khan, N. S., Muaz, M. H., Kabir, A., and Islam, M. N.
(2017). Diabetes predicting mhealth application us-
ing machine learning. In 2017 IEEE international
WIE conference on electrical and computer engineer-
ing (WIECON-ECE), pages 237–240. IEEE.
Liu, W., Li, M., and Yi, L. (2016). Identifying children
with autism spectrum disorder based on their face pro-
cessing abnormality: A machine learning framework.
Autism Research, 9(8):888–898.
Lundberg, S. M. and Lee, S.-I. (2017). A unified approach
to interpreting model predictions. Advances in neural
information processing systems, 30.
Raj, S. and Masood, S. (2020). Analysis and detection
of autism spectrum disorder using machine learning
techniques. Procedia Computer Science, 167:994–
1004.
Ribeiro, M. T., Singh, S., and Guestrin, C. (2016). ” why
should i trust you?” explaining the predictions of any
classifier. In Proceedings of the 22nd ACM SIGKDD
international conference on knowledge discovery and
data mining, pages 1135–1144.
Shaw, K. A., Bilder, D. A., McArthur, D., Williams,
A. R., Amoakohene, E., Bakian, A. V., Durkin, M. S.,
Fitzgerald, R. T., Furnier, S. M., Hughes, M. M., et al.
(2023). Early identification of autism spectrum dis-
order among children aged 4 years—autism and de-
velopmental disabilities monitoring network, 11 sites,
united states, 2020. MMWR Surveillance Summaries,
72(1):1.
Thabtah, F. (2017). Autism spectrum disorder screening:
machine learning adaptation and dsm-5 fulfillment. In
Proceedings of the 1st International Conference on
Medical and health Informatics 2017, pages 1–6.
Thabtah, F. (2019). Machine learning in autistic spec-
trum disorder behavioral research: A review and ways
forward. Informatics for Health and Social Care,
44(3):278–297.
Thabtah, F., Kamalov, F., and Rajab, K. (2018). A new
computational intelligence approach to detect autistic
features for autism screening. International journal of
medical informatics, 117:112–124.
van den Bekerom, B. (2017). Using machine learning for
detection of autism spectrum disorder. In Proc. 20th
Student Conf. IT, pages 1–7.
Wall, D. P., Dally, R., Luyster, R., Jung, J.-Y., and DeLuca,
T. F. (2012). Use of artificial intelligence to shorten
the behavioral diagnosis of autism.
Decoding Autism Diagnosis: A Journey Towards Transparency with XAI in ML Models
707
