
The Interactive Network Visualization of the Interactions Between
Topologically Associating Domains in the Genome of Fruit Fly
Samira Mali
1 a
and Swetha Annavarapu
2,3 b
1
Laboratory for Theoretical and Computational Molecular Biophysics, Virginia Tech, Blacksburg VA, U.S.A.
2
The Distributed Virtual Environments Lab, Center for Human-Computer Interaction, Virginia Tech, Blacksburg VA, U.S.A.
3
ADP Inc., Alpharetta GA, U.S.A.
Keywords:
Topologically Associating Domain, Genome of Fruit Fly, Human-Centered Computing, Visualization
Technique, Network Visualization, Visualization Design, Evaluation Methods.
Abstract:
In this work, we created a network visualization to help you understand how Topologically Associating Do-
mains (TADs) interact with each other across the genome based on where the TAD is located, whether it is near
the center of the nucleus or near the edge of the nucleus. This visualization can reveal how the dense regions
and sparse regions of chromosome interactions are distributed in one view. The pilot study demonstrates how
network visualization of TAD-TAD interactions can quickly answer numerous major questions in 3D genome
and epigenetics field without requiring the development of Machine Learning methods or Algorithms to un-
lock Heatmap structures. The questions include but are not limited to, determining many-way interactions and
interactions between TADs belonging to various epigenetic classes.
1 INTRODUCTION
1.1 Topologically Associating Domain
Several researchers are studying how DNA folds in
the tiny nucleus space. Building artificial chromo-
somes will successfully correct genetic abnormalities
if they follow the correct folding other than the correct
orders across the genome. Researchers now know that
folding is not random, and there are some patterns we
can observe in the folding of chromosomes wrapped
around the Histone proteins. Topologically Associ-
ating Domains (TAD)(Lieberman-Aiden et al., 2009)
are one of those basic folding patterns.
A topologically associating domain (TAD) is a
self-interacting genomic region in which DNA se-
quences interact with one another more frequently
than sequences outside the TAD.
TADs are structural features of chromosomes that
play a crucial role in genome organization and regu-
lation of gene expression. They were first identified
in 2012 in Drosophila melanogaster and subsequently
in mammalian genomes using high-throughput chro-
mosome conformation capture (Hi-C) technology.
a
https://orcid.org/0000-0002-3701-0072
b
https://orcid.org/0000-0002-1221-2823
(Dixon et al., 2012)).
TADs have been found to be conserved across
species and are thought to be important for main-
taining proper gene expression and regulatory inter-
actions(Acemel et al., 2017). TADs are thought to be
stable over time, and disruption of TAD boundaries
has been associated with various diseases, including
cancer and developmental disorders (Flavahan et al.,
2016)). TAD structure has an essential role in gene
regulation because the TAD boundaries show the ex-
act position of insulator proteins. Disruption of TAD
boundaries is found to be associated with a wide range
of diseases, such as cancer.(Bonev and Cavalli, 2016)
As a result, recognizing TADs and any information
about them would be very helpful in the 3D genome
field.
TADs are believed to be formed by the binding of
architectural protein complexes, such as CTCF and
cohesin, which loop the DNA to form discrete do-
mains (Nora et al., 2012). Recent studies have shown
that TADs are not always strictly compartmentalized
but can interact with each other, leading to the forma-
tion of so-called ”meta-TADs” (Bonev and Cavalli,
2016). In addition, several complexes, such as CTCF
and the cohesin protein complex, are recognized for
their connection to the creation of TADs. These two
main protein complexes have a role in the folding of
504
Mali, S. and Annavarapu, S.
The Interactive Network Visualization of the Interactions Between Topologically Associating Domains in the Genome of Fruit Fly.
DOI: 10.5220/0012456200003657
Paper published under CC license (CC BY-NC-ND 4.0)
In Proceedings of the 17th International Joint Conference on Biomedical Engineering Systems and Technologies (BIOSTEC 2024) - Volume 1, pages 504-511
ISBN: 978-989-758-688-0; ISSN: 2184-4305
Proceedings Copyright © 2024 by SCITEPRESS – Science and Technology Publications, Lda.

chromosomes. All this information confirms that the
TADs are important and need to be explored in detail.
There is ongoing research to better understand the dy-
namics of TAD formation and maintenance, as well as
their role in gene regulation and disease (Dekker and
Mirny, (Dekker and Mirny, 2016))
1.2 Importance of Network
Visualization
Visualizing TAD (Topologically Associating Do-
mains) interactions is an important aspect of 3D
genome visualization, and heatmaps are one of the
most commonly used techniques for this purpose.
Heatmaps are used to represent the frequency of in-
teractions between different TADs, with each row
and column corresponding to a different TAD and the
color indicating the frequency of the interaction in the
population of cells.
However, as with any visualization technique,
there are limitations to using heatmaps for TAD inter-
action visualization(Lex et al., 2012). Not only may
heatmaps not provide a clear sense of the spatial orga-
nization of TADs in three-dimensional space, but also
one of their limitations is that they can only show pair-
wise interactions between TADs, so they may not be
able to capture more complex relationships between
multiple TADs.
There are no 3D visualizations for Many-Body
chromatin interactions and with the regular heatmaps,
it is difficult to find the three-way or more-way in-
teractions(Oudelaar et al., 2018). Regarding this
concept, to the best of our knowledge, there is
only one work available for Drosophila(Sun et al.,
2021), whose resolution is higher than TAD. On the
other hand, there is a recent research (Dotson et al.,
2022) about the many-body interactions in the human
genome that used upset plots to show the intersections
of the pairwise interactions to recognize many-body
interactions.
We argue that network visualization would be
more effective than an upset plot in showing the inter-
section among data. Upset plots are generally more
effective for comparing the overlap of sets or groups
of data. However, network visualizations are more
useful for understanding the relationship between en-
tities. In this work, we propose such a network visu-
alization of TADs.
One of our specific ideas in this research is ad-
dressing the issue of the incompleteness of many-
body contact view in heatmap by using network
visualization of interactions between TADs. In ad-
dition, Hi-C heatmaps do not directly represent the
directionality of interactions between genomic seg-
ments (TADs), which can make it difficult to iden-
tify the nature of the interactions. Network visualiza-
tion can address this by incorporating directed graphs
(edges).
Other visualization techniques, such as 3D plots
and network graphs, can be used in conjunction with
heatmaps. 3D plots can be used to show the physi-
cal arrangement of TADs in three-dimensional space,
while network graphs can be used to show the rela-
tionships between multiple TADs in a more complex
and nuanced way.
Overall, while heatmaps can be a useful tool for
visualizing TAD interactions, they may need to be
supplemented with other visualization techniques to
capture the complexity of 3D genome organization
fully.
On the other hand, circus plots can be used to visu-
alize the TAD-TAD interactions. However, it has sev-
eral disadvantages, such as limited scalability, mean-
ing these plots can become cluttered and difficult to
read when the number of individuals or interactions
is large as well in the circus plots, it can be difficult to
identify the specific connections or relationships be-
tween individuals, particularly when there are many
overlapping lines. All of these issues can be addressed
easily by a well-rendered graph layout visualization.
Furthermore, one important aspect of the
structure-function relationship in chromatin in the
nucleus is the interaction between active and inac-
tive regions of chromatin. Therefore, our second
specific idea in this project is to propose a network
visualization to represent types of interactions,
including interactions among Active, PcG, HP1
Centromeric, and Null TADs in the genome of fruit
fly.
Network visualization, also known as graph vi-
sualization, is a technique used to display complex
data in a way that is easy to understand. Networks
are made up of nodes and edges, with nodes rep-
resenting objects or entities and edges representing
relationships between them. In the context of TAD
visualization, nodes can represent individual TADs,
while edges can represent interactions between TADs.
There are several tools available for visualizing TADs,
which can be broadly classified into two categories:
1) tools for visualizing TADs as 2D plots and 2)
tools for visualizing TADs in 3D. Tools for visualiz-
ing TADs as 2D plots:
• Juicebox (Durand et al., 2016) is a popular tool for
visualizing Hi-C data, which can be used to dis-
play TAD boundaries, as well as other genomic
features such as gene locations and epigenetic
marks.
• HiCPlotter (Akdemir and Chin, 2015) is a tool
The Interactive Network Visualization of the Interactions Between Topologically Associating Domains in the Genome of Fruit Fly
505

for visualizing Hi-C data as 2D heatmaps, which
can be used to identify TAD boundaries and other
structural features of the genome.
Tools for visualizing TADs in 3D:
• TADview 1.1 is a tool for visualizing TADs as 3D
models. This tool is a plugin that can be added to
VMD (Humphrey et al., 1996) and includes many
features, such as representing different epigenetic
classes of TADs.
• 3D Genome Browser is a web-based tool for vi-
sualizing Hi-C data in 3D, which can be used to
explore TAD boundaries and their spatial organi-
zation. (Wang et al., 2018)
• HiCExplorer (Wolff et al., 2018): A suite of tools
for exploring Hi-C data, including a 3D visualiza-
tion tool that can be used to visualize TADs and
other genomic features in 3D.
• Chrom3D(Paulsen et al., 2017) is a computational
tool for modeling the 3D structure of the genome,
which can be used to visualize TADs and other
structural features in 3D.
In High-throughput chromatin conformation cap-
ture (Hi-C) experiments, these regions are basically
visualized as squares along the diagonals through a
Heat Map in higher resolution. While in TAD reso-
lution, each dot in the heatmap shows one TAD. Heat
Maps have a lot of limitations in terms of visualization
context. They only show the frequency of interactions
in each region and cannot show the types of the TAD.
Other than epigenetic classes, TADs can be classified
into two categories based on their position with re-
spect to the nucleus, whether they are near the nuclear
envelope or near the center of the nucleus(Afanasyev
and Onufriev., 2022). There are several ways in which
network visualization can be used to enhance TAD vi-
sualization. For example, it can be used to:
1. Display relationships between TADs: By using a
network visualization, it is possible to see the re-
lationships between TADs and how they interact
with each other. This can provide a more compre-
hensive view of the genome than a static image of
TADs alone.
2. Analyze the structure of TADs: Network visual-
ization can be used to analyze the structure of
TADs and identify patterns and clusters within
them. This can help to uncover functional rela-
tionships and potential regulatory mechanisms.
3. Identify key TADs: By using network analysis
techniques, it is possible to identify key TADs that
are important for the overall structure and func-
tion of the genome.
2 METHODOLOGY USED TO
COLLECT PAPERS
The keywords used to collect the papers were
”Topologically Associating Domains,” ”TAD visu-
alization,” ”TAD Network Visualization,” ”Genome
Network Visualization,” and ”Network Visualization
Tools for Biological Networks.” A total of 48 papers
were reviewed out of which 29 papers were chosen as
references for the literature review.
The reason for choosing these papers is that they
are aligned with two main goals of this study, in-
cluding the interaction among the different epigenetic
classes of chromosomes as well as the many-body in-
teraction concept in 3D genome folding.
Three papers were published in Genome Biol-
ogy journal, four papers in Nucleic acids research,
six papers in Nature (communications, review, genet-
ics), two papers in Cell Journal, one from Epigenet-
ics and Chromatin journal, one from Interdisciplinary
Reviews: Developmental Biology, one in Bioinfor-
matics journal, one was accepted in Proceedings of
the international AAAI conference on web and so-
cial media, one in Communications Biology journal,
one in scientific report, one journal in PLoS Compu-
tational Biology journal and one from Genome Re-
search journal.
3 RESEARCH GAPS
A few research gaps identified based on the current
visualization methods being used for TADs are:
1. There are not any 3D visualizations for Many-
Body chromatin interactions. With the regular
heatmaps, it is difficult to show the three-way or
more-way interactions.(Liu et al., 2021)(Dotson
et al., 2022)
2. So far, heat maps are being used for TAD visual-
ization, but it does not give full information about
the interactions. There are only values of interac-
tions. But with a Network visualization we can
see if there is any interaction between the nodes
based on edge connection and its color taxonomy.
This project aims to fill a gap in research by visu-
alizing interactions between TADs (topologically as-
sociated domains) in the nucleus. By mapping how
these interactions vary based on TAD location (near
the nucleus periphery or center), it can shed light on
gene activity patterns crucial for understanding gene
regulation. This visualization could aid physicist.
BIOINFORMATICS 2024 - 15th International Conference on Bioinformatics Models, Methods and Algorithms
506
4 HYPOTHESIS
We argue that a heatmap alone cannot depict the
distribution of TAD-TAD interactions in the nucleus
based on the epigenetic classes of TADs. Further-
more, the heatmap fails to represent multiple-body
interactions, making it challenging to discern 3-4-5
body interactions quickly and easily.
Based on both the design procedures we devel-
oped and the pilot study we conducted, we demon-
strate heatmaps are not enough to answer the afore-
mentioned question rapidly.
5 METHODS
5.1 Network Visualization of TAD-TAD
Interactions
In the proposed approach, each node represents a
TAD in the network, and each edge shows the inter-
action between the TADs. If there is an interaction
between the TADs, an edge is connected to repre-
sent it. Otherwise, there is no edge between them.
The TADs close to the nuclear periphery are inac-
tive regions of chromatin and those close to the center
are active regions of chromatin. There are 4 types
of nodes: Active, PcG (repressed Polycomb group),
HP1 Centromeric (inactive regions related to H3K4
histone modification), and Null TADs. The size of
the node represents the radius of the TAD. TADs con-
tain information about the amount of DNA base-pair
on that domain as well as the exact region for that do-
main along the genome.
The initial plan was to use some available tools,
such as cola.js(Dwyer, 2018), to build an interactive
network visualization. However, due to some techni-
cal issues relating to a high number of nodes, Gephi
(Gansner and North, 2000) was used for the network
visualization. The other options, including cola.js and
plotly (Python library), do not meet our needs in terms
of applying the appropriate types of forces between
nodes to handle very large networks in biology con-
text. This resulted in these tools not being able to
accommodate the high number of nodes used to rep-
resent TADs across the whole genome.
5.2 Dataset
Generally, the data corresponding to the TAD loca-
tions is defined by applying some predefined algo-
rithms to Hi-C data. However, the data for this project
is taken from (Sexton et al., 2012), which partitioned
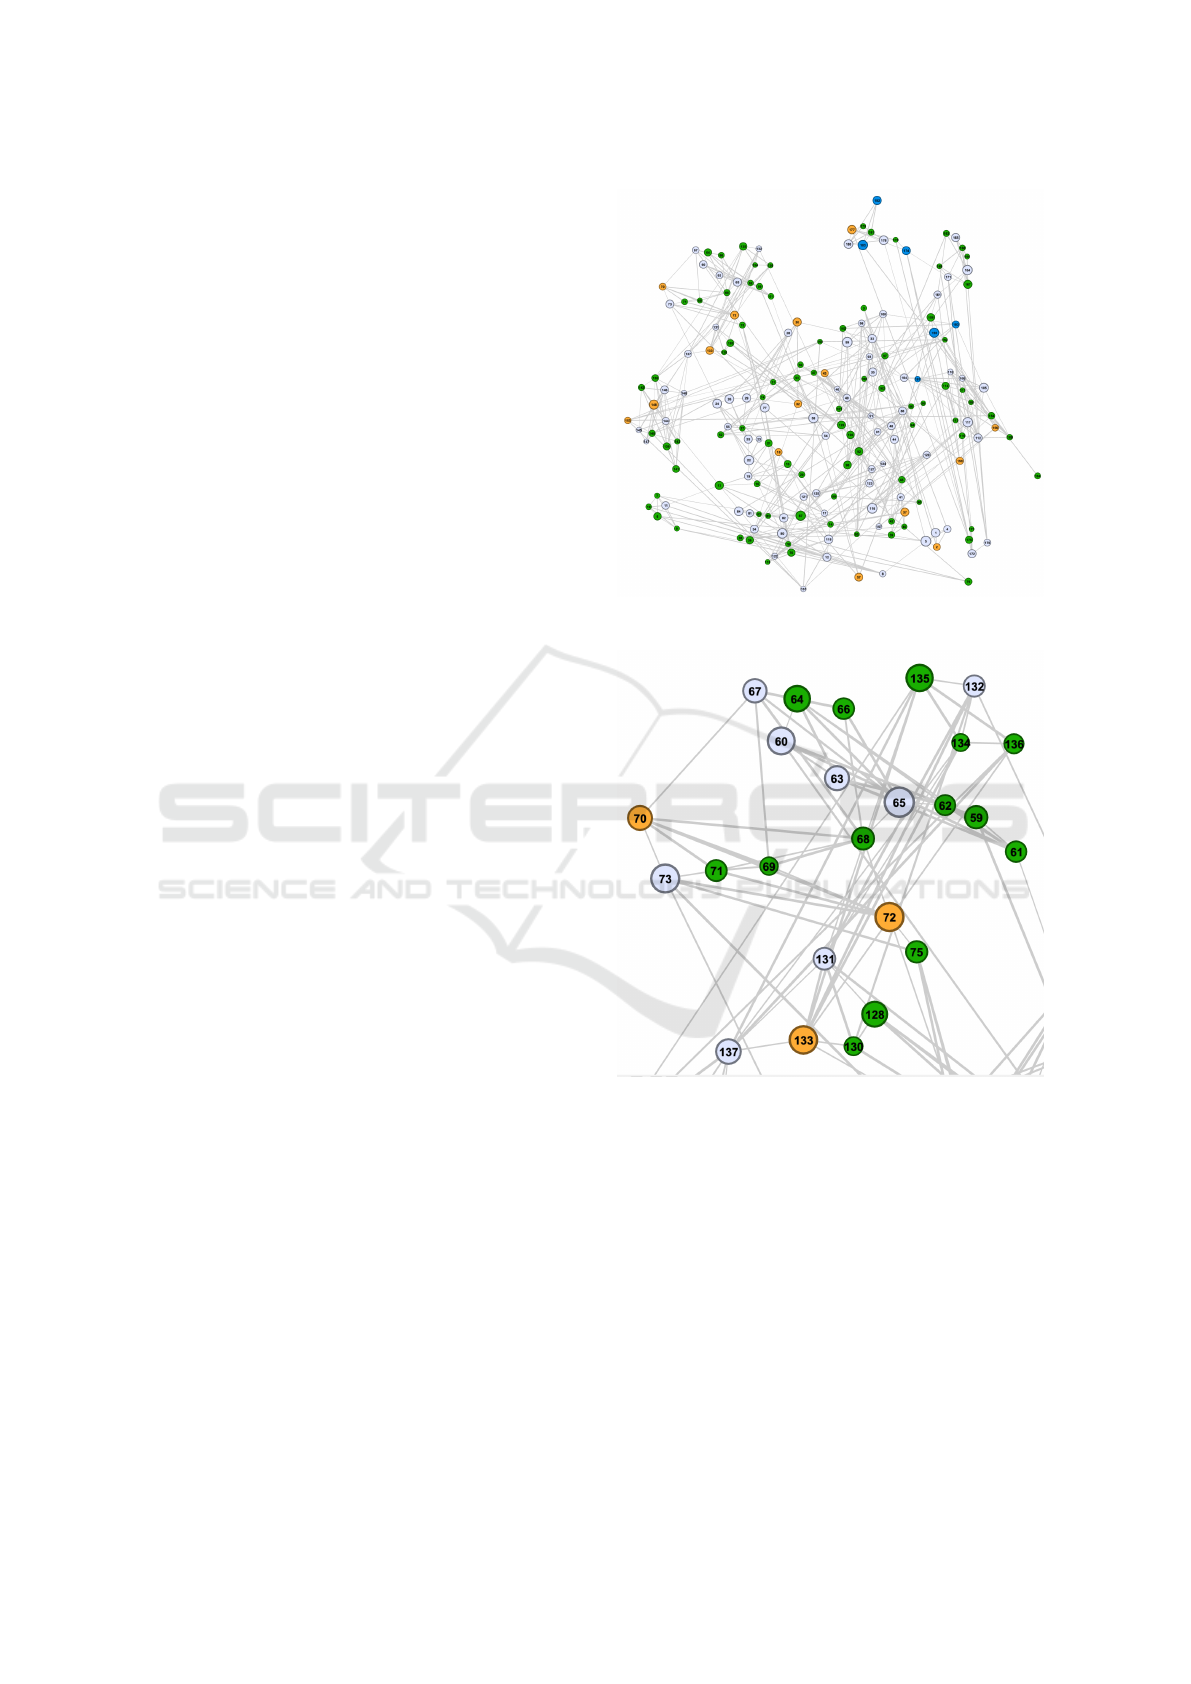
Figure 1: Many-Body Interaction in TAD Network Visual-
ization.
Figure 2: Zoomed-in view of a part of the Network. We can
zoom in and zoom out through the network.
the genome of Drosophila into Topologically Associ-
ating Domains (TAD) for each chromosome based on
the chromatin density in the nucleus.
This data is imported into the software interface
as a CSV file. We use Gephi 1.10(Bastian et al.,
2009) to visualize our TAD-TAD network. We use
this tool because it uses forces and other network fea-
tures to make it more readable. Several studies used
Gephi for their visualization targets. (Deng et al.,
2022),(Ma et al., 2021). We have used two parts of
the dataset: the first is for the whole chromosomes of
the drosophila genome, and the second is only for Chr
X:[ 173,850-21,889,749] that has 184 TADs. Each
The Interactive Network Visualization of the Interactions Between Topologically Associating Domains in the Genome of Fruit Fly
507
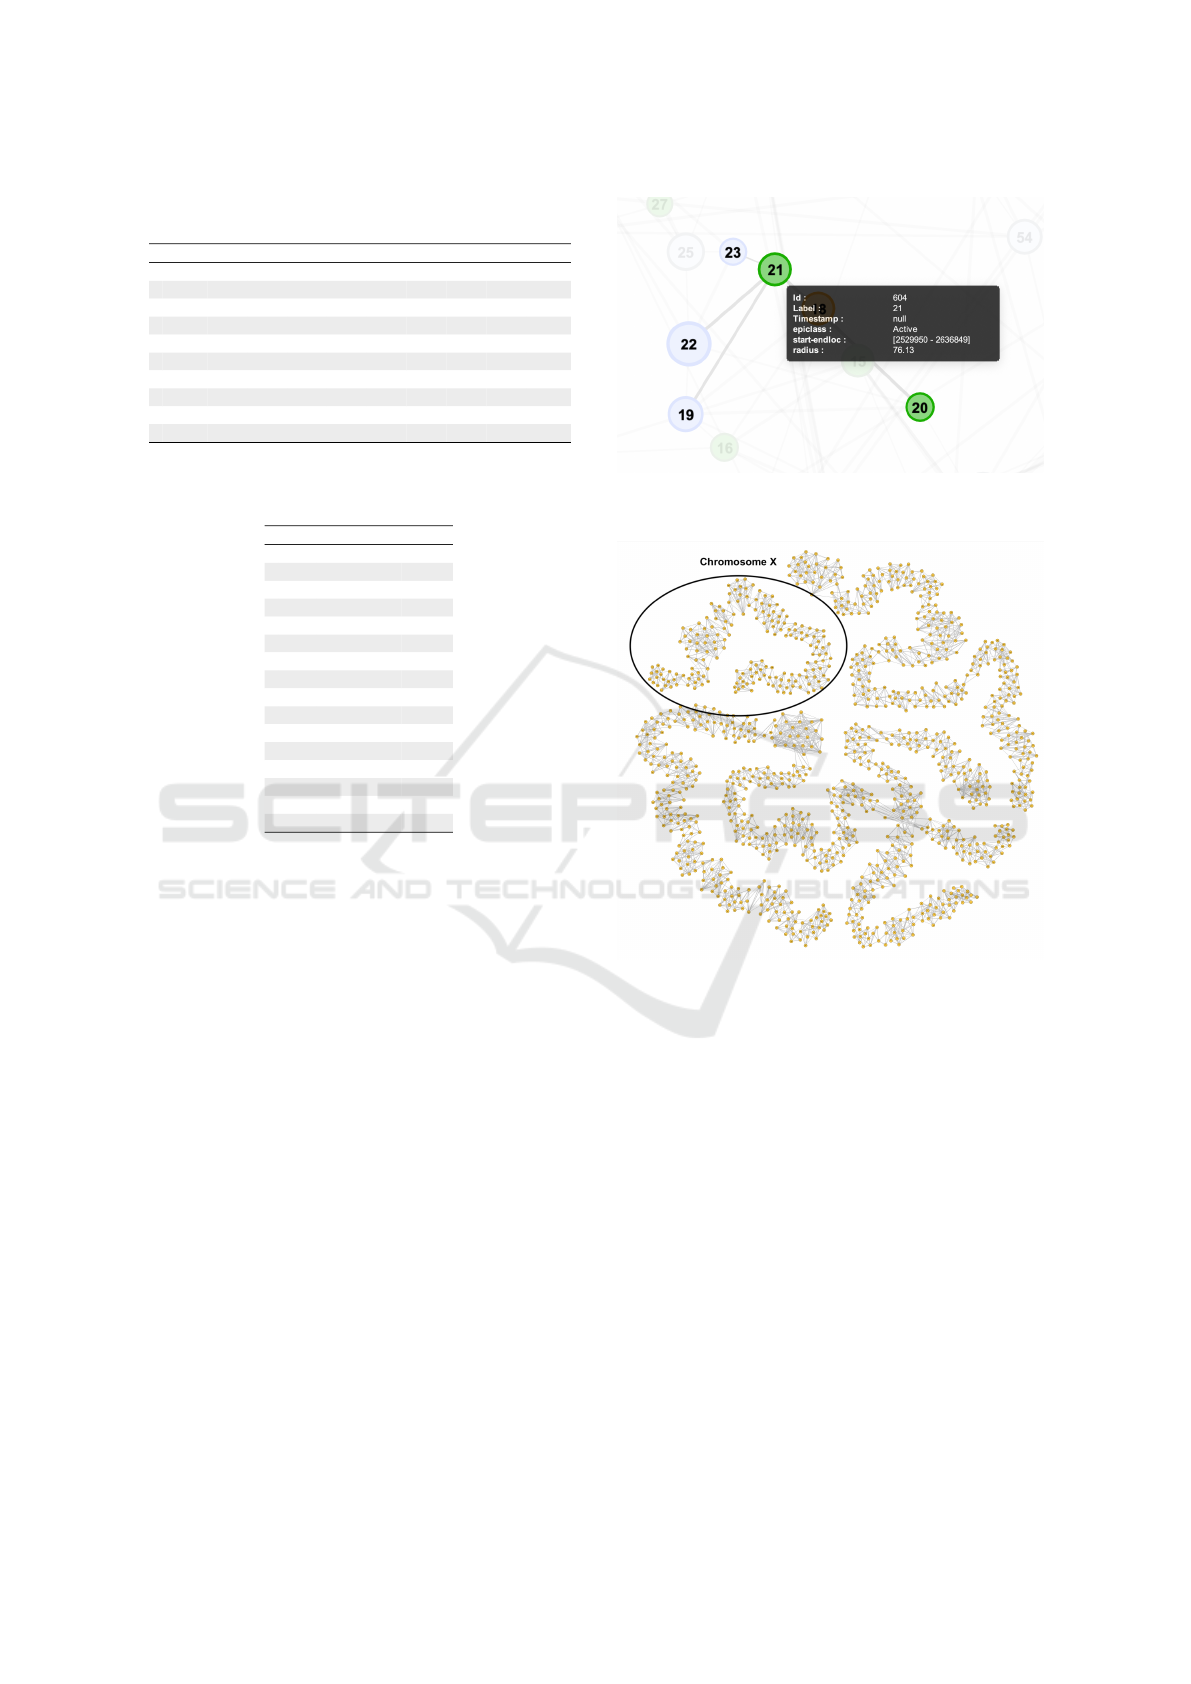
Table 1: Each element represents the frequency of contacts
between each of the two domains.
1 2 3 4 5 6 7 8 9 10
1 1 0.999667 0.749417 0.555148 0.323559 0.216928 0.223259 0.183272 0.080973 0.0816395
2 0.999667 1 0.999334 0.874375 0.518161 0.357547 0.339553 0.257581 0.108964 0.109963
3 0.749417 0.999334 1 0.999334 0.691103 0.479174 0.423192 0.296235 0.112962 0.115961
4 0.555148 0.874375 0.999334 1 0.999334 0.870377 0.718427 0.487171 0.194269 0.186604
5 0.323559 0.518161 0.691103 0.999334 1 1 0.977341 0.647784 0.250916 0.224592
6 0.216928 0.357547 0.479174 0.870377 1 1 1 0.781073 0.272909 0.243585
7 0.223259 0.339553 0.423192 0.718427 0.977341 1 1 0.991003 0.460846 0.401866
8 0.183272 0.257581 0.296235 0.487171 0.647784 0.781073 0.991003 1 0.999334 0.952349
9 0.080973 0.108964 0.112962 0.194269 0.250916 0.272909 0.460846 0.999334 1 1
10 0.0816395 0.109963 0.115961 0.186604 0.224592 0.243585 0.401866 0.952349 1 1
Table 2: The attributes for each TAD include radius, epi-
class, as well as start and end loci.
EpiClass Start-EndLoc Radius (nm)
1 Inactive [173850 - 425249] 101.24
2 PcG [425250 - 513049] 71.29
3 Active [513050 - 551249] 54.02
4 Inactive [551250 - 658949] 76.32
5 Inactive [658950 - 1129149] 124.73
6 Active [1129150 - 1268749] 83.21
7 Active [1268750 - 1293949] 47.03
8 Inactive [1293950 - 1356849] 63.79
9 Active [1356850 - 1375149] 42.27
10 Active [1375150 - 1410649] 52.72
11 Inactive [1410650 - 1558649] 84.85
12 Inactive [1558650 - 1753549] 93
13 Active [1753550 - 1971649] 96.56
14 Active [1971650 - 2013749] 55.8
15 Active [2013750 - 2117549] 75.39
16 Active [2117550 - 2165549] 58.3
matrix element shows the edge weight (the frequency
of interaction among the population of cells).
5.3 Design Procedure
We imported a CSV file as a matrix with timestamps,
choosing graph settings like undirected edges, auto-
scaling, and excluding self-loops. Additionally, we
selected a sum-based edge merge strategy. Later, we
added node data (TAD labels, epigenetic classes, lo-
cations, and radii) to the workspace, merging dupli-
cates based on attributes like epiclass and location.
In Gephi’s Data Laboratory, we appended this data
to an existing workspace. We segregated epigenetic
classes using filters and identified Many-Body inter-
actions between active nodes. We also set up visual
aids, assigning node colors by epiclass and adjusting
node sizes based on radius. Edge colors were unique
for connecting TADs.
To inspect nodes easily, we installed the Inspec-
tor plugin, enabling us to view node details (ID, label,
timestamp, epiclass, locations, and radius) when hov-
ering over nodes in the graph area of the Overview
window.
In the overview window under the Layout tab, we
ran ForceAtlas 2(Jacomy et al., 2014) with the follow-
Figure 3: By hovering over a node, we can see the Node
information.
Figure 4: The chromosome shown by the circle is the chro-
mosome X amongst the whole chromosomes of Drosophila.
In addition, in this figure, we can observe some graph fea-
tures, such as clique, which could be directly related to the
higher level of gene expression in those chromosomal re-
gions.
ing specifications:
We have created two different filters: the first is to
show all the Epigenetic classes, and the second is to
filter out connections between active nodes to identify
Many-Body interactions.
For Epigenetic Classes filter, we first added the
intersection operator in the queries. The edge weight
filter ranged from the least edge weight above zero to
2. We adjusted the edge weight filter at 0.8 (Sun et al.,
2021).
For Many-Body Interactions filter, we created a
base filter similar to the epigenetic classes filter. We
modified the Inter edge of the Epiclass filter in queries
by choosing Active and PcG classes.
BIOINFORMATICS 2024 - 15th International Conference on Bioinformatics Models, Methods and Algorithms
508
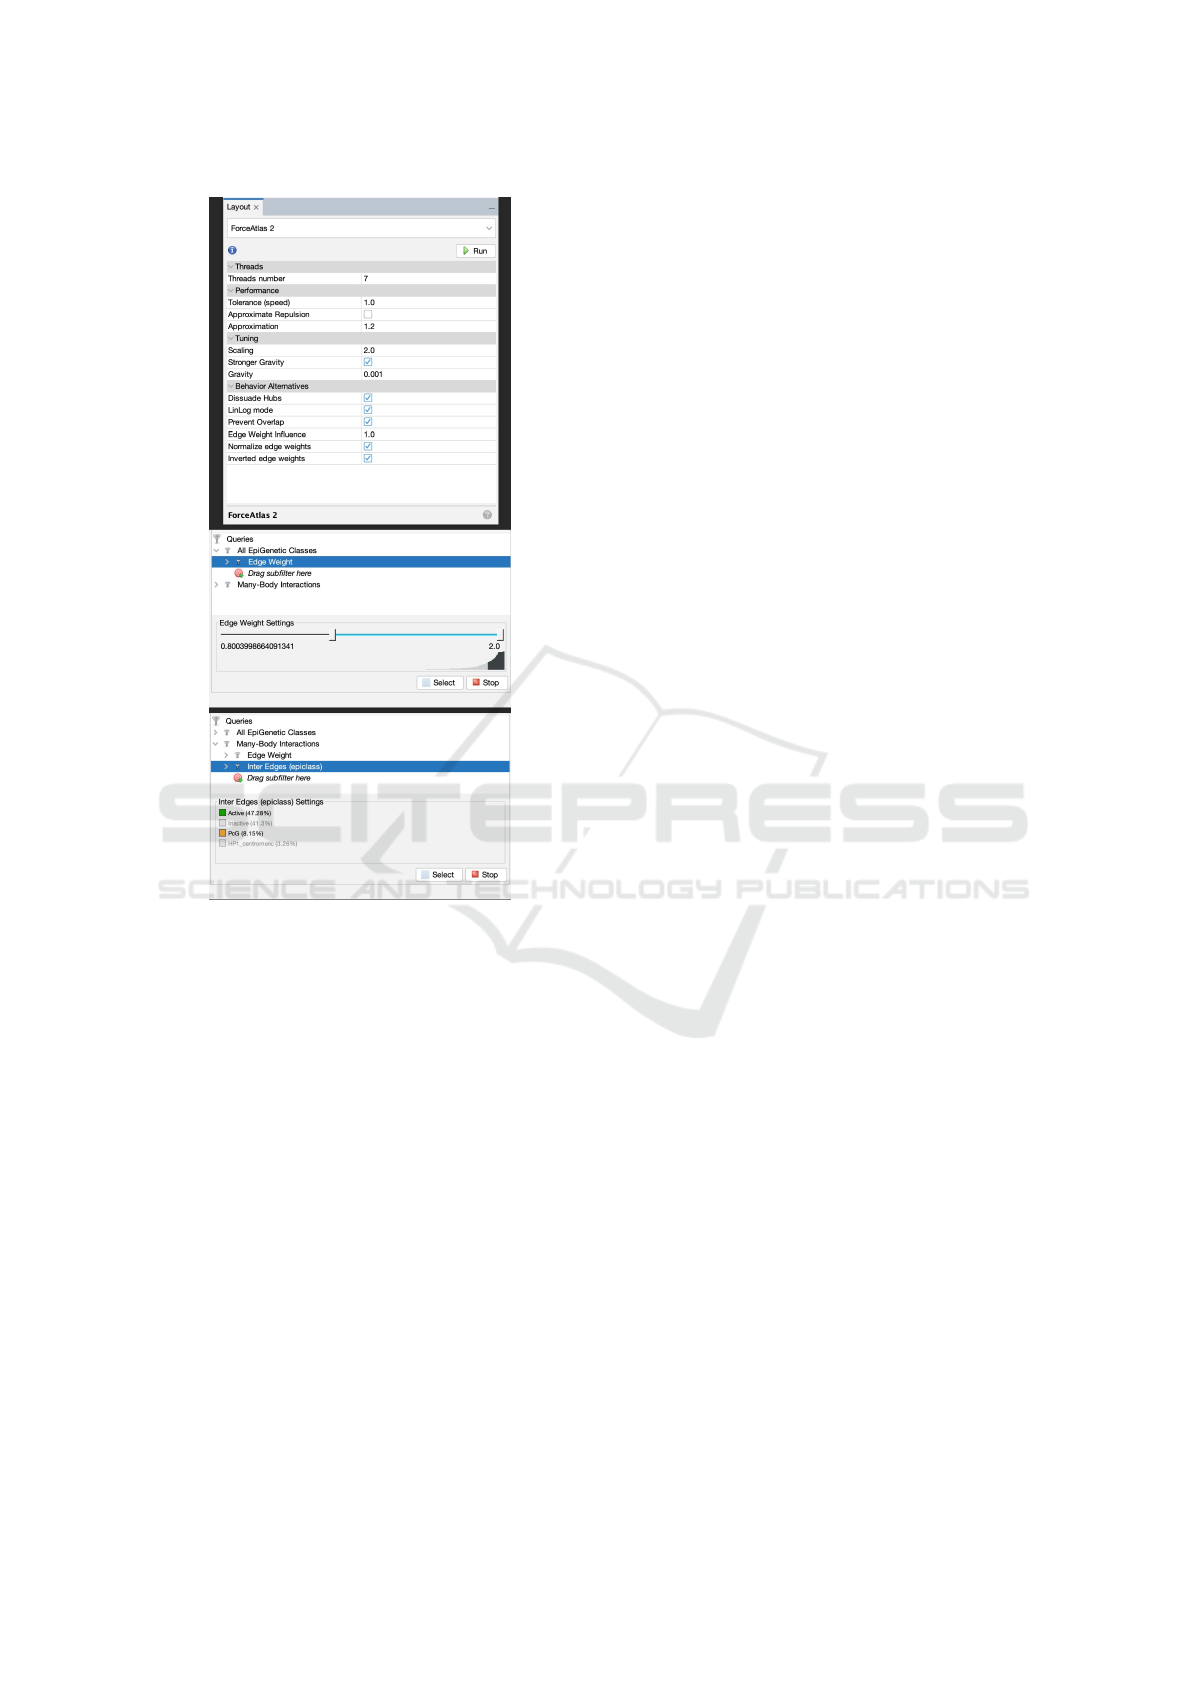
Figure 5: (a)ForceAtlas 2 is developed by the Gephi team
as an all-around solution to Gephi users’ typical networks
(scale-free, 10 to 10,000 nodes), (b) The empirical studies
show the 0.8 is the distance threshed for having contact be-
tween pieces of DNA, (c) Many-Body Interaction filter in
TAD Network Visualization with Inter edges between Ac-
tive and PcG Nodes
Whenever we want to apply a filter, we can choose
that particular filter from the queries and click on the
Filter button at the bottom right corner to update it in
the network.
The reason we apply the ForceAtlas2 is: we need
to apply the right force to reach a smooth network
of TAD-TAD interaction in the Drosophila genome.
Previous studies provide different models. One pro-
vides statistical models on Force-directed graph lay-
out(Zhong et al., 2023), and the other uses the unified
force representation integrating popular techniques
such as the stress model, the spring-electrical model,
as well as maxent-stress model(Xue et al., 2022).
However, ForceAtlas2 adjusts attractive forces in pro-
portion to distance and repulsive forces inversely to
distance, aiming to enhance the display of local neigh-
borhoods and cluster structures in the visualization,
which is more similar to the (Tolokh and Onufriev,
2023) which is a model simulation for Drosophila
(fruit fly) genome.
5.4 Initial Pilot Study
To prepare a better pilot study, we used the ideas of
a few pilot study works (Yang and Goodwin, 2019),
(Sedlmair et al., 2012), (Wall et al., 2022). We present
our analysis of two expert interviews. Such analysis
is crucial to understanding the real-world scenarios of
analyzing chromatin organization in TAD resolution.
The motivation for these interviews was to under-
stand the role of flow data in real-world applications
and existing workflows across different disciplines to
help inform new visualization designs.
The questions for the pilot study are listed in the
link:
Pilot Study Questions.
A few guidelines formulated based on the pilot
study are:
1. In the heatmap, the checkerboard patterns show
the active and inactive regions. However, deciding
which one is active and which one is inactive is
sometimes confusing.
The distribution of four types of Epigenetic
classes of TADs can be clear in the network, with
different color coding for each class.
2. One of the major challenges in single-cell stud-
ies is figuring out what types of single cells are
more frequent in the ensemble average Hi-C con-
tact matrices. We cannot answer this question ex-
plicitly using heatmap visualization.
However, we can do this using the information
about the degree of each node in the network.
3. Heatmap can be used to identify the many-body
interactions, but it takes a lot of time.
Network visualization can make the process of
identifying many-body interactions easier.
4. The most important one is that some graph fea-
tures like clique show a high level of transcription
and gene expression in those regions (hubs), and
we can get these features by network visualization
(see Figure 5).
The results of our analysis show that network vi-
sualization can be more efficient and easier to use than
interaction matrices (Hi-C heatmaps), which are the
most common approaches to visualizing chromatin
interactions in this field.
The Interactive Network Visualization of the Interactions Between Topologically Associating Domains in the Genome of Fruit Fly
509

6 RESULTS AND FUTURE PLAN
FOR USER STUDY
We develop a pipeline for network visualization for
TAD-TAD interaction of Drosophila genome using a
graph layout method providing filters such as multi-
way interactions as well as epigenetic classes. The re-
sults from the pilot study highlight the need of a new
visualization approach for TAD-TAD interactions to
facilitate answering several questions: ”Visualizing
networks simplifies the identification of many-body
interactions”. In addition, the degree of the nodes
in the network can explain the biological meaning of
this type of representation of interactions between the
TADs: ”The integration of the nodes with high de-
grees show the hub regions with higher level of tran-
scription or gene expression.”
The combination of our design procedure and pi-
lot study demonstrate the correctness of our hypothe-
sis which indicate Hi-C heatmap in TAD resolution is
not enough to smoothly justify how TADs distributed
in different radial positions as well as quick determi-
nation of many-way interactions among TADs.
In the current work, primary focus for the project
is designing a Network Visualization for TADs. How-
ever, since this work is domain-specific, we plan on
conducting a user study in the future. As part of the
study, we plan to recruit 10 Ph.D. students in the Bi-
ology/Physics/Biochemistry fields, where we plan to
show them the visualizations and confirm if these vi-
sualizations will be helpful in the field using a survey.
As of now, the User studies are yet to be done
fully. As part of the user study, the participant would
be interacting with the network visualization. They
would be asked to perform general interaction tasks
such as zoom-in and zoom-out, identify active and in-
active TADs, and identify TAD many-body interac-
tions such as 3, 4, 5-body interactions. They will be
asked to list out the nodes that are part of the Many-
body interactions. In the end, they would be asked
to fill out an online survey, which includes a NASA-
TLX questionnaire to understand the mental work-
load of using the network visualization and SUS to
understand the ease of system usability. The survey
will also include a few custom questions about the
TAD network visualizations to understand if the par-
ticipant could successfully perform all the tasks as-
signed to them during the study.
The results of the study will be analyzed based on
the answers provided by the participants to the survey
questions.
7 CONCLUSION
Briefly, we can categorize our idea into two specific
aspects. First, we are interested in seeing how TADs
have interacted with each other in many ways. On
the other hand, we would like to see the distribution
of these interactions and compare them among the
Epigenetic classes Active, PcG (repressed Polycomb
group), HP1 Centromeric (inactive regions related to
H3K4 histone modification), and Null in TADs. As
the future work, expanding the work to apply the tech-
nique to mammalian genomes would also be inter-
esting. Answering these questions is helpful to Bi-
ologists and Physicists for an easier understanding of
genome folding.
ACKNOWLEDGMENT
The authors extend their appreciation to Yalong Yang
and Alexey Onufriev for their guidance and support.
REFERENCES
Acemel, R. D., Maeso, I., and G
´
omez-Skarmeta, J. L.
(2017). Topologically associated domains: a success-
ful scaffold for the evolution of gene regulation in an-
imals. Wiley Interdisciplinary Reviews: Developmen-
tal Biology, 6(3):e265.
Afanasyev, Alexander Y., Y. K. I. S. T. I. V. S. and Onufriev.,
A. V. (2022). The probability of chromatin to be at the
nuclear lamina has no systematic effect on its tran-
scription level in fruit fly. bioRxiv.
Akdemir, K. C. and Chin, L. (2015). Hicplotter integrates
genomic data with interaction matrices. Genome biol-
ogy, 16:1–8.
Bastian, M., Heymann, S., and Jacomy, M. (2009). Gephi:
an open source software for exploring and manipu-
lating networks. In Proceedings of the international
AAAI conference on web and social media, volume 3,
pages 361–362.
Bonev, B. and Cavalli, G. (2016). Organization and func-
tion of the 3d genome. Nature Reviews Genetics,
17(11):661–678.
Dekker, J. and Mirny, L. (2016). The 3d genome as
moderator of chromosomal communication. Cell,
164(6):1110–1121.
Deng, L., Gao, B., Zhao, L., Zhang, Y., Zhang, Q., Guo, M.,
Yang, Y., Wang, S., Xie, L., Lou, H., et al. (2022). Di-
urnal rnapii-tethered chromatin interactions are asso-
ciated with rhythmic gene expression in rice. Genome
Biology, 23(1):1–22.
Dixon, J. R., Selvaraj, S., Yue, F., Kim, A., Li, Y., Shen, Y.,
Hu, M., Liu, J. S., and Ren, B. (2012). Topological
domains in mammalian genomes identified by analy-
BIOINFORMATICS 2024 - 15th International Conference on Bioinformatics Models, Methods and Algorithms
510

sis of chromatin interactions. Nature, 485(7398):376–
380.
Dotson, G. A., Chen, C., Lindsly, S., Cicalo, A., Dilworth,
S., Ryan, C., Jeyarajan, S., Meixner, W., Stansbury,
C., Pickard, J., et al. (2022). Deciphering multi-way
interactions in the human genome. Nature Communi-
cations, 13(1):5498.
Durand, N. C., Robinson, J. T., Shamim, M. S., Machol, I.,
Mesirov, J. P., Lander, E. S., and Aiden, E. L. (2016).
Juicebox provides a visualization system for hi-c con-
tact maps with unlimited zoom. Cell systems, 3(1):99–
101.
Dwyer, T. (2018). Constraint-Based Layout in the Browser.
https://marvl.infotech.monash.edu/webcola/.
Flavahan, W. A., Drier, Y., Liau, B. B., Gillespie, S. M.,
Venteicher, A. S., Stemmer-Rachamimov, A. O.,
Suv
`
a, M. L., and Bernstein, B. E. (2016). Insula-
tor dysfunction and oncogene activation in idh mutant
gliomas. Nature, 529(7584):110–114.
Gansner, E. R. and North, S. C. (2000). An open graph
visualization system and its applications to software
engineering. Software: practice and experience,
30(11):1203–1233.
Humphrey, W., Dalke, A., and Schulten, K. (1996). Vmd:
visual molecular dynamics. Journal of molecular
graphics, 14(1):33–38.
Jacomy, M., Venturini, T., Heymann, S., and Bastian, M.
(2014). Forceatlas2, a continuous graph layout algo-
rithm for handy network visualization designed for the
gephi software. PloS one, 9(6):e98679.
Lex, A., Streit, M., Schulz, H.-J., Partl, C., Schmalstieg,
D., Park, P. J., and Gehlenborg, N. (2012). Stratomex:
visual analysis of large-scale heterogeneous genomics
data for cancer subtype characterization. In Computer
graphics forum, volume 31, pages 1175–1184. Wiley
Online Library.
Lieberman-Aiden, E., Van Berkum, N. L., Williams, L.,
Imakaev, M., Ragoczy, T., Telling, A., Amit, I., La-
joie, B. R., Sabo, P. J., Dorschner, M. O., et al. (2009).
Comprehensive mapping of long-range interactions
reveals folding principles of the human genome. sci-
ence, 326(5950):289–293.
Liu, L., Zhang, B., and Hyeon, C. (2021). Extracting multi-
way chromatin contacts from hi-c data. PLoS Compu-
tational Biology, 17(12):e1009669.
Ma, J., Hou, C., Li, Y., Chen, S., and Wu, C. (2021).
Ogt protein interaction network (ogt-pin): a curated
database of experimentally identified interaction pro-
teins of ogt. International journal of molecular sci-
ences, 22(17):9620.
Nora, E. P., Lajoie, B. R., Schulz, E. G., Giorgetti, L.,
Okamoto, I., Servant, N., Piolot, T., Van Berkum,
N. L., Meisig, J., Sedat, J., et al. (2012). Spa-
tial partitioning of the regulatory landscape of the x-
inactivation centre. Nature, 485(7398):381–385.
Oudelaar, A. M., Davies, J. O., Hanssen, L. L., Tele-
nius, J. M., Schwessinger, R., Liu, Y., Brown, J. M.,
Downes, D. J., Chiariello, A. M., Bianco, S., et al.
(2018). Single-allele chromatin interactions identify
regulatory hubs in dynamic compartmentalized do-
mains. Nature genetics, 50(12):1744–1751.
Paulsen, J., Sekelja, M., Oldenburg, A. R., Barateau, A.,
Briand, N., Delbarre, E., Shah, A., Sørensen, A. L.,
Vigouroux, C., Buendia, B., et al. (2017). Chrom3d:
three-dimensional genome modeling from hi-c and
nuclear lamin-genome contacts. Genome biology,
18:1–15.
Sedlmair, M., Meyer, M., and Munzner, T. (2012). Design
study methodology: Reflections from the trenches and
the stacks. IEEE transactions on visualization and
computer graphics, 18(12):2431–2440.
Sexton, T., Yaffe, E., Kenigsberg, E., Bantignies, F.,
Leblanc, B., Hoichman, M., Parrinello, H., Tanay,
A., and Cavalli, G. (2012). Three-dimensional fold-
ing and functional organization principles of the
drosophila genome. Cell, 148(3):458–472.
Sun, Q., Perez-Rathke, A., Czajkowsky, D. M., Shao, Z.,
and Liang, J. (2021). High-resolution single-cell 3d-
models of chromatin ensembles during drosophila em-
bryogenesis. Nature communications, 12(1):205.
Tolokh, Igor S., N. A. K. I. V. S. and Onufriev, A. V. (2023).
Strong interactions between highly dynamic lamina-
associated domains and the nuclear envelope stabi-
lize the 3d architecture of drosophila interphase chro-
matin. Epigenetics & Chromatin, 16(1):21.
Wall, E., Xiong, C., and Kim, Y.-S. (2022). Vishikers’ guide
to evaluation: Competing considerations in study de-
sign. IEEE Computer Graphics and Applications,
42(3):29–38.
Wang, Y., Song, F., Zhang, B., Zhang, L., Xu, J., Kuang, D.,
Li, D., Choudhary, M. N., Li, Y., Hu, M., et al. (2018).
The 3d genome browser: a web-based browser for
visualizing 3d genome organization and long-range
chromatin interactions. Genome biology, 19(1):1–12.
Wolff, J., Bhardwaj, V., Nothjunge, S., Richard, G., Ren-
schler, G., Gilsbach, R., Manke, T., Backofen, R.,
Ram
´
ırez, F., and Gr
¨
uning, B. A. (2018). Galaxy hic-
explorer: a web server for reproducible hi-c data anal-
ysis, quality control and visualization. Nucleic acids
research, 46(W1):W11–W16.
Xue, M., Wang, Z., Zhong, F., Wang, Y., Xu, M., Deussen,
O., and Wang, Y. (2022). Taurus: towards a unified
force representation and universal solver for graph
layout. IEEE Transactions on Visualization and Com-
puter Graphics, 29(1):886–895.
Yang, Y. and Goodwin, S. (2019). What-why analysis of ex-
pert interviews: Analysing geographically-embedded
flow data. In 2019 IEEE Pacific Visualization Sympo-
sium (PacificVis), pages 122–126. IEEE.
Zhong, F., Xue, M., Zhang, J., Zhang, F., Ban, R., Deussen,
O., and Wang, Y. (2023). Force-directed graph lay-
outs revisited: a new force based on the t-distribution.
IEEE Transactions on Visualization and Computer
Graphics.
The Interactive Network Visualization of the Interactions Between Topologically Associating Domains in the Genome of Fruit Fly
511
