
Evaluation of Orthogonal Vector Projection Method in ST Algorithm
for Generating Differential Diagnoses of Chest Pain: A Pilot Study
Irosh Fernando
1a
, Luke Nepia
2
, Hoang Mai Khanh Do
3
and Edward Holmes
3
1
Hunter New England Area Health, 72 Watt St, Newcastle, NSW, Australia
2
Faculty of Medicine and Health, University of New England, Elm Avenue, Armidale NSW 2351, Australia
3
School of Medicine and Public Health, Faculty of Health and Medicine, University of Newcastle, Australia
Keywords: Medical Expert Systems, Computer Algorithms for Medical Diagnosis, Select and Test (ST) Algorithm,
Orthogonal Vector Projection Method, Algorithm for Diagnosing Chest Pain.
Abstract: Diagnosing chest pain can be a challenging process with potential misdiagnoses causing significant morbidity
and mortality, and the associated healthcare cost and burden. As a potential solution to increase the diagnostic
accuracy and rule out non-life-threatening conditions, we have evaluated the method known as orthogonal
vector projection which is a part of the Select and Test (ST) algorithm for medical diagnosis, as a pilot study.
Using a knowledgebase consisting of 12 diagnoses and 43 clinical features, we have evaluated 47 clinical
cases by comparing the diagnosis given by a senior clinician to the diagnosis arrived by the orthogonal vector
projection method.
1 INTRODUCTION
Chest pain is common physical complaint with a
lifetime prevalence of 25% in the general population,
resulting in common presentations to emergency
departments (Thomsett et al, 2018), (Chew et al,
2016), (Cullen et al, 2015). While there are many
possible causes of chest pain ranging from benign
causes to life-threatening medical emergencies such
as acute coronary syndrome (ACS), discriminating
them can be difficult (Cullen et al, 2015), (Geyser et
al, 2016). For example, it is known that between 50%
to 80% of the time, patients with possible ACS are
misdiagnosed and sent home without proper
treatment (Geyser eta l, 2016); and about one third of
patients who didn’t have a diagnosis related to their
chest pain, are known to be later diagnosed with ACS
or die from cardiovascular disease (Fordyce et al,
2016). On the other hand, the benign causes of chest
pain still often require evaluation including
investigations amounting to healthcare cost of
diagnosis which burdens patients and health care
services (Cullen et al, 2015). Furthermore, clinicians
are known to make diagnostic errors due to number
of factors including fatigue and time pressure. Hence,
use of diagnostic algorithm to improve diagnostic
a
https://orcid.org/0000-0003-1239-9277
accuracy, mitigate the errors, and minimise
unnecessary investigations, is highly desirable.
In this research work, we have used the method
known as orthogonal vector projection of ST
algorithm, which was introduced by (Fernando et al,
2016) and has been evaluated in generating
differential diagnoses for psychiatric conditions.
In this study, two different evaluations were
done to explore the potential use of the method for
triaging (i.e., arriving at differential diagnoses prior
to conducting investigations) and a diagnostic tool
(i.e., arriving at diagnosis with all clinical features
including investigation results).
2 ORTHOGONAL VECTOR
PROJECTION METHOD
(OVPM)
A given clinical presentation with a set of clinical
features, requiring a diagnosis, is conceptualised as a
binary vector in which, each feature is assigned a
binary value to indicate if the feature is present or not
in the patient. On the other hand, each potential
diagnosis presented as a real vector corresponding to
Fernando, I., Nepia, L., Do, H. and Holmes, E.
Evaluation of Orthogonal Vector Projection Method in ST Algorithm for Generating Differential Diagnoses of Chest Pain: A Pilot Study.
DOI: 10.5220/0012456000003657
In Proceedings of the 17th International Joint Conference on Biomedical Engineering Systems and Technologies (BIOSTEC 2024) - Volume 2, pages 695-699
ISBN: 978-989-758-688-0; ISSN: 2184-4305
Copyright © 2024 by Paper published under CC license (CC BY-NC-ND 4.0)
695

the set of clinical features, with each real element
corresponding to respective clinical feature, being a
relative weight assigned according to its diagnostic
importance (i.e., a clinical feature which is highly
indicative of the diagnosis is given a higher weight
compared to one which is less indicative of the
diagnosis). Using these vectors, a similarity measure
with respect to each diagnosis is derived as follows.
Let 𝑛 be the total number of clinical features,
𝐿
⃗
=
⎝
⎜
⎜
⎛
𝑙
.
.
.
𝑙
⎠
⎟
⎟
⎞
where,each element 𝑙
∈
0,1
,
be the vector of clinical features,
𝐷
⃗
=
⎝
⎜
⎜
⎛
𝑑
.
.
.
𝑑
⎠
⎟
⎟
⎞
where,each element 𝑑
∈[0,1],
be a potential diagnosis (i.e., a column vector in the
knowledge base) which satisfies,
𝑑
=1,
and we derive, 𝑋
⃗
the Hadamard product (element-
wise product)
𝑋
⃗
=𝐿
⃗
⃘𝐷
⃗
.
Then using the similarity measure denoted as 𝑟 is
derived as follows,
𝑟=
𝑋
⃗
.𝐷
⃗
𝐷
⃗
Where 𝐷
⃗
is the length of the vector 𝐷
⃗
.
Suppose 𝑚 is the number of total diagnoses, then the
knowledgebase is a 𝑛×𝑚 matrix which consists of
the column vectors corresponding to each diagnosis.
3 STUDY DESIGN AND DATA
COLLECTION
A total of 12 diagnoses were carefully chosen along
with the list of 43 clinical features consisting of
physical symptoms, clinical examination findings and
investigations. With the view of two potential use of
the method as a triage tool, a separate set of vectors
for diagnoses were created excluding investigation
findings and redistributing the weights. The weights
were assigned to each clinical feature for each
diagnosis subjectively using clinical expertise and
adjusted using test cases. The two knowledgebases
are tabulated in the appendix.
Assuming a prevalence between 5-10% of the
chest pain related diagnoses in emergency department,
and a predetermined sensitivity and specificity of 80%
for each and individual diagnosis, the estimated
sample size was 980 participants, which was not
feasible to achieve with the time and resources
available. However, combining all diagnoses as one
general diagnostic entity with their aggregated
prevalence be more than 95%, with predetermined
sensitivity and specificity of 92% for the general
diagnostic entity, and with 8% of maximum marginal
error and 95% confidence level, the required sample
size was deemed as only 47 participants.
Therefore, evaluation of the orthogonal vector
projection method was conducted as a pilot study to
determine the general sensitivity and specificity for
combined diagnoses as opposed to determining
sensitivity and specificity for each individual
diagnosis.
The diagnostic data (i.e., list of clinical features
and the diagnosis given by a senior clinician) from the
patients who were recruited for the study, was
collected after obtaining ethics approval from Hunter
New England Local Area Health District (John
Hunter Hospital and Maitland Hospital) where the
study was conducted over a period of 4 months. The
recruitment data are summarised in Table-1.
Table 1: Chest pain related diagnoses and number of
clinical cases.
Diagnosis Number of cases
STEMI 6
NSTEMI 23
Unstable angina 4
Pulmonary embolism 4
Pneumonia 9
Gastric ulcer 1
Aortic dissection 0
Pericarditis 0
Pneumothorax 0
Cholecystitis 0
Costochondritis 0
Panic attack 0
HEALTHINF 2024 - 17th International Conference on Health Informatics
696
4 ANALYSIS AND RESULTS
For each clinical case, the similarity measure 𝑟 was
calculated for each for each 12 diagnoses. We chose
arbitrarily the following set of cut-off points for
positive diagnoses: 0.6𝑟,0.7𝑟,0.8𝑟. The
analysis was conducted separately for the diagnoses
with investigations and without investigations.
Without investigation results being included, the
OVPM was able to achieve specificity above 90% at
all cut-off points with a negative predictive value of
90%, and the maximum sensitivity achieved was
70%. On the other hand, with the investigations being
included, the OVPM was able to achieve 87.2%
(95% CI 74.3%-95.2%) sensitivity and 99.2% (95%
CI 98.0%-99.8%) specificity for the cut-off 0.6>r;
and the positive predictive value and the negative
predictive values were 93% and 97.5% respectively;
Table 2 summarises the results for the three most
common diagnoses in the data set.
Table 2: Sensitivity and specificity for the cut-off 0.6>r
with investigation results being included.
STEMI
N
STEMI Pneumonia
True + 6 21 8
False + 0 1 1
False - 0 2 1
True - 43 23 37
Sensitivit
y
100% 91.3% 88.9%
Specificit
y
100% 95.8% 97.4%
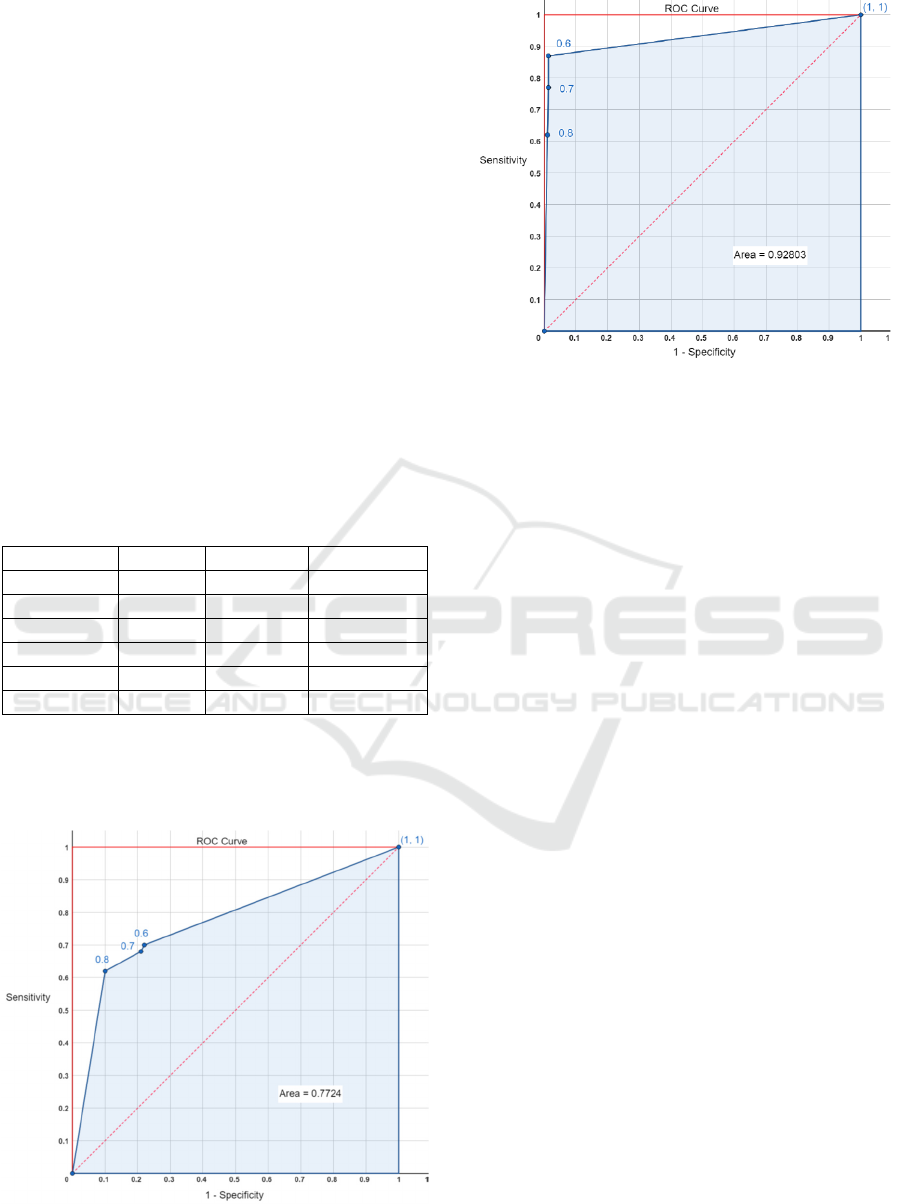
The area under the receiver operating
characteristic curve (AUROC) for the results of the
analysis without and with investigation results were
0.772 and 0.928 respectively (Figures 1 and 2).
Figure 1: Receiver operating characteristic curve for
investigation results being excluded.
Figure 2: Receiver operating characteristic curve for
investigation results being included.
5 DISCUSSION
This pilot study shows that the OVPM has a great
potential in triaging chest pain and diagnosis; the
results have shown to have an excellent diagnostic
accuracy as per the expected standards (Šimundić et
al, 2009). Particularly, with high specificity and NPV,
OVPM has the potential to use as a triage tool with
the utility of ruling out certain diagnoses and thus
minimising the cost of unnecessary investigations.
There were number of limitations in the study.
Firstly, whilst deriving the optimum weights for each
clinical feature for each diagnosis is critical for
accurate results, it was done subjectively as a manual
process; thus, not necessarily representing the
optimum weights. Secondly, the sample size of the
study was small and couldn’t recruit patients for all
the diagnoses, having no patients for 6 diagnoses out
of the 12 diagnoses chosen.
Future areas of research involve developing an
automated process of deriving weights for each pair
of clinical feature and diagnosis; also conducting
further evaluation with bigger sample size.
REFERENCES
Thomsett R, Cullen L. The assessment and management of
chest pain in primary care: A focus on acute coronary
syndrome. Aust J Gen Pract.2018;47(5):246-251.
Chew DP, Scott IA, Cullen L, French JK, Briffa TG,
Tideman PA, et al. National Heart Foundation of
Australia and Cardiac Society of Australia and New
Zealand: Australian clinical guidelines for the
Evaluation of Orthogonal Vector Projection Method in ST Algorithm for Generating Differential Diagnoses of Chest Pain: A Pilot Study
697
management of acute coronary syndromes 2016. Med J
Aust. 2016 Aug 1;205(3):128-33.
Cullen L, Greenslade J, Merollini K, Graves N, Hammett
CJ, Hawkins T, et al. Cost and outcomes of assessing
patients with chest pain in an Australian emergency
department. Med J Aust. 2015 May;202(8):427-32.
Geyser M, Smith S. Chest pain prevalence, causes, and
disposition in the emergency department of a regional
hospital in Pretoria. Afr J Prim Health Care Fam Med.
2016;8(1):e1-5.
Fordyce CB, Newby DE, Douglas PS. Diagnostic Strategies
for the Evaluation of Chest Pain: Clinical Implications
From SCOT-HEART and PROMISE. J Am Coll
Cardiol. 2016;67(7):843-852.
Fernando IP, Henskens FA. The select and test algorithm
for inference in medical diagnostic reasoning:
Implementation and evaluation in clinical psychiatry.
2016 IEEE/ACIS 15
th
International Conference on
Computer and Information Science (ICIS).
2016;1(1):1-9.
Šimundić AM. Measures of Diagnostic Accuracy: Basic
Definitions. EJIFCC. 2009 Jan 20;19(4):203-11.
PMID: 27683318; PMCID: PMC4975285.
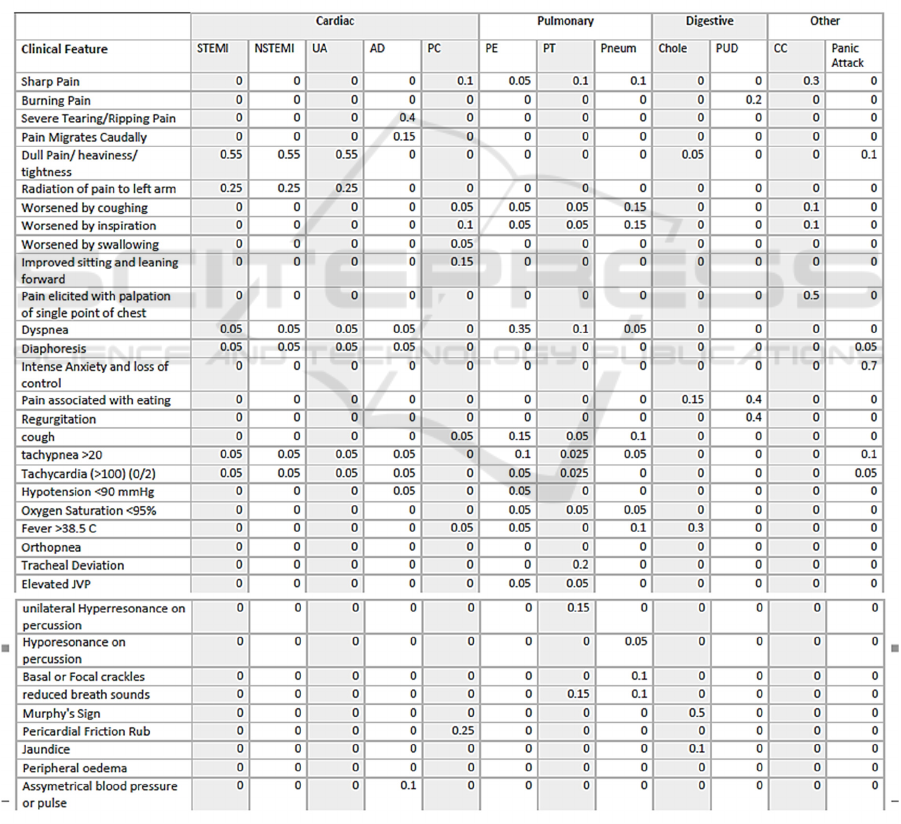
APPENDIX
Figure 3: Knowledgebase consisting of clinical features and their assigned values for each possible differential diagnosis,
excluding investigations; unstable angina (UA), aortic dissection (AD), pericarditis (PC), pulmonary embolism (PE),
pneumothorax (PT), pneumonia (Pneum), cholecystitis (Chole), peptic ulcer disease (PUD).
HEALTHINF 2024 - 17th International Conference on Health Informatics
698
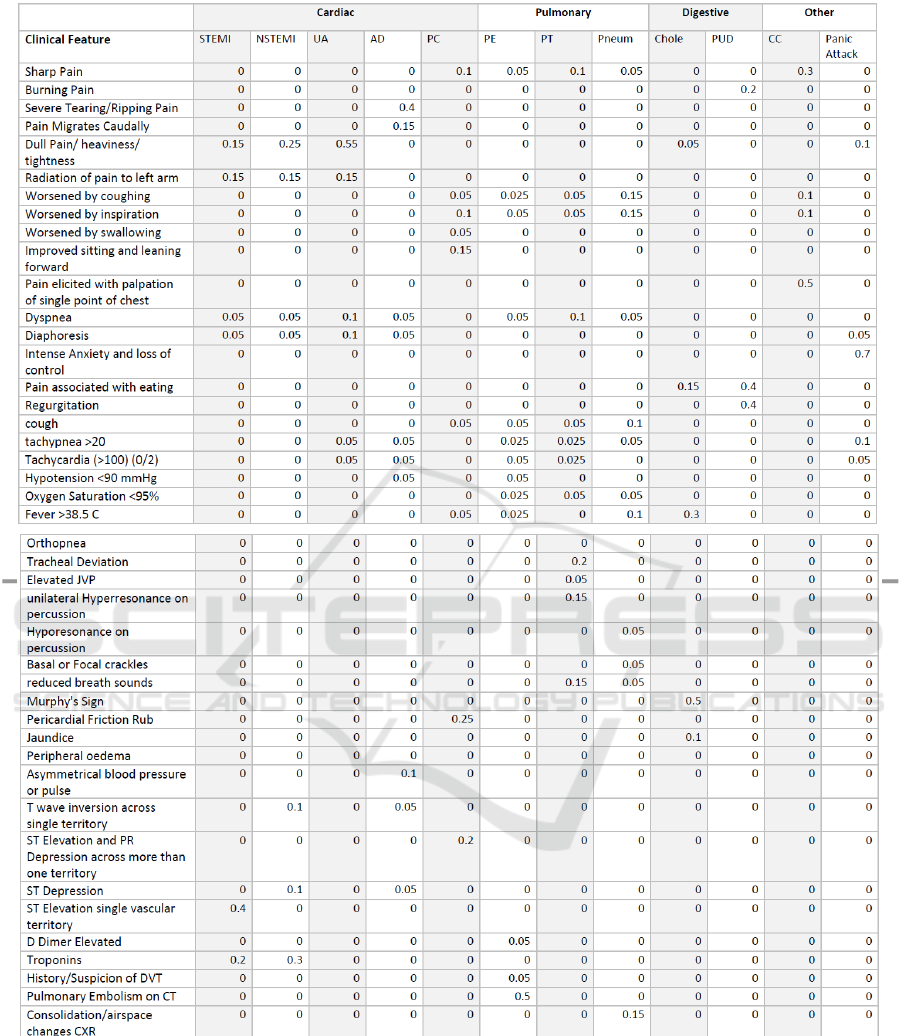
Figure 4: Knowledgebase consisting of clinical features and their assigned values for each possible differential diagnosis,
including investigations.
Evaluation of Orthogonal Vector Projection Method in ST Algorithm for Generating Differential Diagnoses of Chest Pain: A Pilot Study
699
