
Digital Discrimination Detection in Ridesharing Services in Rio de
Janeiro City
Raquel T. Paiva, Wendy S. Cataldo, Ana Cristina B. Garcia
a
and Carlos Eduardo R. de Mello
b
Centro de Ci
ˆ
encias Exatas e Tecnologia, Universidade Federal do Estado do Rio de Janeiro, Rio de Janeiro, Brazil
Keywords:
Digital Discrimination Detection, Ridesharing Service, Ontology, Machine Learning.
Abstract:
The urban transport sector has been significantly transformed by technology. However, the adoption of these
applications has also brought to light important social issues, including the cancellation of rides due to bias.
The objective of this work is to analyze digital discrimination in light of a complex system and address it
through the analysis of crowd data, which can guide mechanisms to dissuade discrimination in digital ser-
vices. Our main motivation is to answer the following research questions: RQ1: Is there evidence of digital
discrimination in the ridesharing services of Rio de Janeiro city? RQ2: Is it possible to identify the factors
that lead to discrimination? RQ3: What are the key concepts regarding Digital Discrimination detection in a
ridesharing service? RQ4: Could Machine Learning techniques accurately identify discrimination and their
key variables that can be used in actions to mitigate this behavior?
1 INTRODUCTION
Currently, urban mobility has become a major chal-
lenge in large centers. The increase in the number
of cars and public transport that has been suffering
with quality and quantity, that directly influences ur-
ban optimization with direct consequences on traffic
flow and congestion (Batty, 2012), and impact on the
environment, in addition to having a direct relation-
ship with the restriction of offers of legalized urban
mobility services and guaranteed by public authori-
ties and an increase in irregular transport services.
In addition to these, the population suffers with
individual transport services, such as taxis, which
had high costs and also low quality of service, as
they had a monopoly on this service. Given this
scenario, in 2014 the ridesharing service arrived in
Brazil, where the urban transport sector has been sig-
nificantly transformed by technology, with transport
applications playing a key role in simplifying and ef-
ficient services for passengers (Miroslav Tushev and
Mahmoud, 2020), causing new platforms to emerge,
increasing competition, and allowing the population
to have more transport options at affordable costs.
However, the ridesharing apps only enable the
provision of a service in a peer-to-peer modality, that
a
https://orcid.org/0000-0002-3797-5157
b
https://orcid.org/0000-0002-3632-4002
is, between a passenger and a driver, who in turn have
biases, a phenomenon that undermines equality and
accessibility of transport services (Yanbo Ge, 2018).
These biases can lead to a social problem which is
discrimination. This brings us to a question: would
ridesharing app available in Rio de Janeiro city be im-
mune to discrimination related to gender, race, age,
able, class and religious, among other characteristics
(Jorge Mejia, 2020)? Does the ridesharing service
available have other issues that we are not aware of?
To clarify these doubts, we sought answers in crowd-
sourced data and explored comments from users of
this system as a way of understanding the main prob-
lem faced by users.
Then in the present study, we sought any evidence
in the literature related to digital discrimination de-
tection in ridesharing services, where we adopted a
strategy of an exploratory literature review.
The database used was Google Scholar and the
search strings were:
• “discrimination prejudice bias ridesharing appli-
cations science computing”
• ”uber ”gender discrimination”
source:Information source:Systems”
• ”uber ”gender discrimination” source:IEEE”
Filtering for the last 5 years, the search resulted in
1030 articles in the first query, 9 articles in the second,
and 6 articles in the last, totaling 1045 articles, which
Paiva, R., Cataldo, W., Garcia, A. and R. de Mello, C.
Digital Discrimination Detection in Ridesharing Services in Rio de Janeiro City.
DOI: 10.5220/0012455800003636
Paper published under CC license (CC BY-NC-ND 4.0)
In Proceedings of the 16th International Conference on Agents and Artificial Intelligence (ICAART 2024) - Volume 3, pages 1205-1212
ISBN: 978-989-758-680-4; ISSN: 2184-433X
Proceedings Copyright © 2024 by SCITEPRESS – Science and Technology Publications, Lda.
1205

were filtered by analyzing the presence or absence of
keywords in the title and summary, in addition to a
brief analysis of the conclusion, which resulted in the
selection of 14 articles for full reading
From this review, we extract the following re-
search questions:
• RQ1. Is there evidence of digital discrimina-
tion in the ridesharing application used in Rio de
Janeiro city?
• RQ2. It is possible to identify the factors that lead
to discrimination?
• RQ3. What are the key concepts regarding Digital
Discrimination detection in a ridesharing service?
• RQ4. Could Machine Learning techniques accu-
rately identify discrimination and their key vari-
ables that can be used in actions to mitigate this
behavior?
The rest of this paper is organized as follows. Sec-
tion 2 provides a background on discrimination. In
section 3, we describe and present our ontology, fol-
lowed by our methodology in section 4. Next in sec-
tion 5, we present our study results and discussion.
Section 6 addresses the conclusion and limitations of
this study.
2 BACKGROUND
In this section, we will present the main concepts
for understanding the research problem and the tech-
niques and approaches for analyzing the problem in
this work. To analyze the main complaints from users
from one platform of ridesharing service and whether
there is any factor of discrimination related to users
of the service, first, it is necessary to understand what
discrimination is, how it occurs, and whether it can
be reflected in digital services. By understanding how
and when discrimination can manifest itself and its
provoking “agents”, it is possible to assess whether
this discrimination can be extended to ridesharing
digital services.
In the literature, we find two types of discrimina-
tion: direct and statistically or proxy. According
to (Brown, 2019), direct discrimination is carried
out by an “agent” based on observable personal char-
acteristics of the person who suffered prejudice and
causes a negative effect (Murphy, 2002). These per-
sonal characteristics can be race, gender, and sexual
orientation, among others.
Statistically or proxy discrimination can occur
consciously or unconsciously and is carried out when
observable personal characteristics are used to infer
about unobservable measures (Brown, 2019) (John
F. Dovidio, 2000). Also, this kind of discrimination it
is known as a belief-based bias (Monachou and Ash-
lagi, 2019) . For example, when we have a service de-
nied for a young person just because statistically we
know that younger people have a lower income than
people over 30 years old.
Another key concept found in the literature is the
taste-based as one of a potential source of discrimi-
nation. According to (Monachou and Ashlagi, 2019)
taste-based bias occurs when a person is not aware of
his own prejudices and is associated with the absence
of information about a person leading to discrimina-
tion. This form of bias is particularly insidious, as it
operates beneath an individual’s levels of conscious
perception, transforming into a subtle yet powerful
form of discrimination.
Now that we know the main concepts related to
prejudice or bias, it is important to understand what
it is digital discrimination or discrimination in the
online environment occurs when a service is denied
to a person or a group of individuals using his per-
sonal characteristics available on their profile in the
services platform that can be used to identify and dis-
tinguish them such as symbols, colors, images, text,
or graphics (Abramova, 2020).
In the methodology section, we use a term called
Red Line as a classification category to represent ar-
eas or neighborhoods that have high rates of violence
or crime.
Machine Learning (ML) is a set of models that
enable systems to learn from a dataset, were they can
be trained with a subset of labeled data, called of su-
pervised learning, or independently where the system
identifies patterns and processes, called unsupervised
learning.
We selected two ML techniques for our experi-
ment, the Naive Bayes (NB), a supervised ML tech-
nique used to classify tasks based on Bayes theo-
rem from statistics, and Support Vector Machine
(SVM), another supervised ML technique used to
classify tasks and data analysis for outlier detection.
In the next section, we adopt an ontology which
is a semantic data structure that captures the relation-
ships and concepts underlying a specific domain.
3 ONTOLOGY
The present work proposes to understand and ana-
lyze if there is evidence of digital discrimination in
the context of the ridesharing service available in Rio
de Janeiro city and whether this reason is related to
some type of prejudice. In this context, the creation
ICAART 2024 - 16th International Conference on Agents and Artificial Intelligence
1206
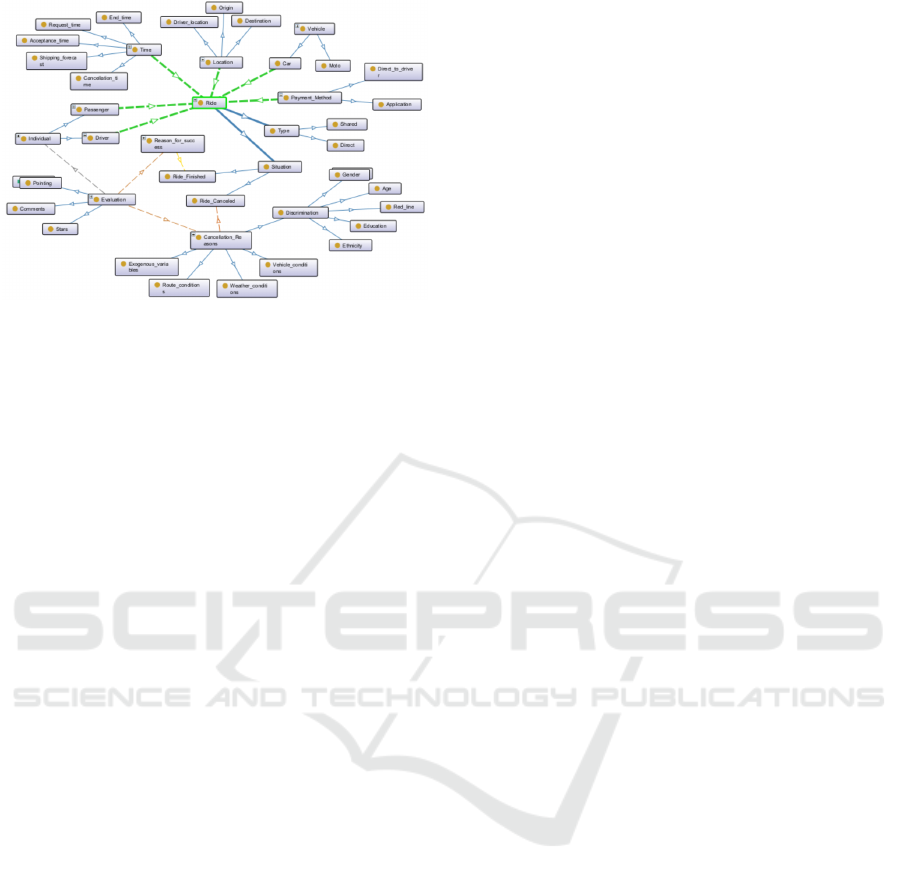
Figure 1: Ridesharing ontology.
of an ontology dedicated to understanding the status
of rides, including the canceling, in order to identify if
the reason was due to prejudice is essential for a more
in-depth and effective analysis of this problem.
Our ontology aims to map the key elements re-
lated to ride status, if there is a discriminatory behav-
ior involved or identified in the cancellations and the
factors that lead to this behavior, also the characteris-
tics of the actors (drivers or passengers) involved.
In order to better understand our domain we an-
alyze the information about the application service
available on the Internet for driver terms and FAQs
for passengers and drivers.
A user will download the application that was
made available on Android and iOS platforms. The
versions of the two operating systems may vary or
present differences in some features. The user, after
downloading and registering on the application, re-
quests a ride by identifying their origin address (em-
barkation) and entering their destination address (dis-
embarkation) and their payment method and select-
ing the desired fare. After entering this information,
the ridesharing platform will search for the nearest
drivers.
Drivers have a specific application, where they
register and according to the platform, the login in
the system is made to be in an online mode to receive
rides requests. After starting the system and being
ready, they are able to receive ride requests, with ini-
tial entry information such as the boarding region.
After the ride is accepted by a driver, the platform
shares both passenger and driver information on their
respective applications, for example, the ridesharing
platform provides information to the passenger appli-
cation about the driver who accepted the ride, such as
the name of the driver and information about the ve-
hicle. After that, the ride can be canceled by both. If
there is no cancellation, the passenger is boarded, so
the driver starts the ride in his app until disembarking
the ride, where the status changes to complete, and
then moves on to the billing stage, where depending
on the user’s selected option, it can be done directly
in the app or to the driver in the form of credit, debit
or cash.
After billing, the process moves on to the evalua-
tion stage. This is carried out through a rating system
of 1 to 5 stars, where 1 signifies a poor experience and
5 denotes an excellent one. Additionally, there is an
option to leave a comment, which can be used to ex-
press compliments or report any issues that may have
occurred during the journey. In cases of great dis-
satisfaction with a platform’s service, Brazilian users
tend to adopt a complaints platform called Reclame
Aqui, where users register their complaints and the
platform may or may not provide feedback on the
reported complaints. These comments can vary into
two types, commendation, a positive type, and com-
plaints, a negative type, regarding the provision of the
service which is made up of the driver, his vehicle,
the condition of the service provision and the func-
tioning of the platform application itself. Comments
about the driver can vary about different characteris-
tics, such as their driving mode, their education, and
attitudes, such as rudeness or kindness, to behaviors
that should be banned in society, such as prejudice
and harassment. Comments regarding the vehicle can
be very diverse concerning the vendor, model, and age
of the car to its condition and comfort. Other com-
ments that can be found are about the conditions for
providing the service, including considering the route
the driver took, the traffic encountered, and the oper-
ation of the application itself, such as difficulties in
registering crashes, or other difficulties in use.
4 METHODOLOGY
In our work, we selected an article that we can use as
a baseline for our study and that can be reproduced
with the data that can represent a ridesharing service
used in Rio de Janeiro city. The research method-
ology adopted by (Miroslav Tushev and Mahmoud,
2020) was to analyze the online feedback from the
actors involved in the ridesharing service (drivers and
passengers). The paper adopted the social network
Twitter to represent this online feedback. Due to a
particular characteristic of the Brazilian population,
our proposal is to use the Reclame Aqui platform to
obtain this feedback online.
Digital Discrimination Detection in Ridesharing Services in Rio de Janeiro City
1207
4.1 Dataset
We extracted 210 complaints from user’s platform on
the Reclame Aqui website through a Python algo-
rithm, using the BeautifulSoap and Selenium Web-
driver libraries. Additionally, we received a total of
750 reviews from a ride-sharing service, where there
were 150 reviews from each rating system from 1 to
5 stars. These anonymous comments were saved in
an Excel spreadsheet locally. This dataset then had a
total of 960 comments, in which pre-processing of the
data was then carried out, such as removing lines that
were brought with the phrase ”Optional Comment”,
where the user did not make any comments in the ap-
plication, just inserted an evaluation on the scoring
system. After removing these lines, the final dataset
resulted in 433 comments, where special characters
generated, for example, by keyboard support config-
ured on the smartphone, were removed.
4.2 Classification and Data Analysis
After creating the dataset and pre-processing, we read
and analyzed the 433 comments in pairs, where we
manually classified each one into categories that we
identified as shown in Table 1.
Table 1: Classification categories.
Aggression; Application;
Harassment; Suitability;
Register; Driver dissatisfaction;
Charge; Cleaning;
Positive comments; Driving mode;
Discrimination; Red line;
Education; Ride status; and
Conservation state; Route.
Of the 433 comments, 163 are multilabel and re-
ceived more than one classification, as they contained
complaints from 2 or 3 categories, we separate these
comments totaling a dataset with 630 comments.
Despite the small sample of comments obtained,
it was possible to identify the practice of discrimina-
tion, with a percentage of 1.9 percent, as shown in the
graph in Figure 2. In this classification, we consider
discrimination in relation to gender, including LGBT,
ethnicity, ageism, weight, politics, and religion.
Of this percentage, 25 percent of users who suf-
fered discrimination were female passengers, 8.3 per-
cent were elderly passengers, and we also found cases
of harassment of women. All religious and politi-
cal discrimination was practiced by passengers in a
percentage of 41.7 in relation to the total number of
comments found with evidence of discrimination as
Figure 2: Discrimination evidence.
Figure 3: Discrimination radar discrimination.
we can see in Figure 3.
After the analysis of the comments and their man-
ual classification, we created a data dictionary with
words and terms associated with each of the cate-
gories. Our next step was to use the Python library
scikit-learn for ML to realize a predictive data analy-
sis for our dataset of comments.
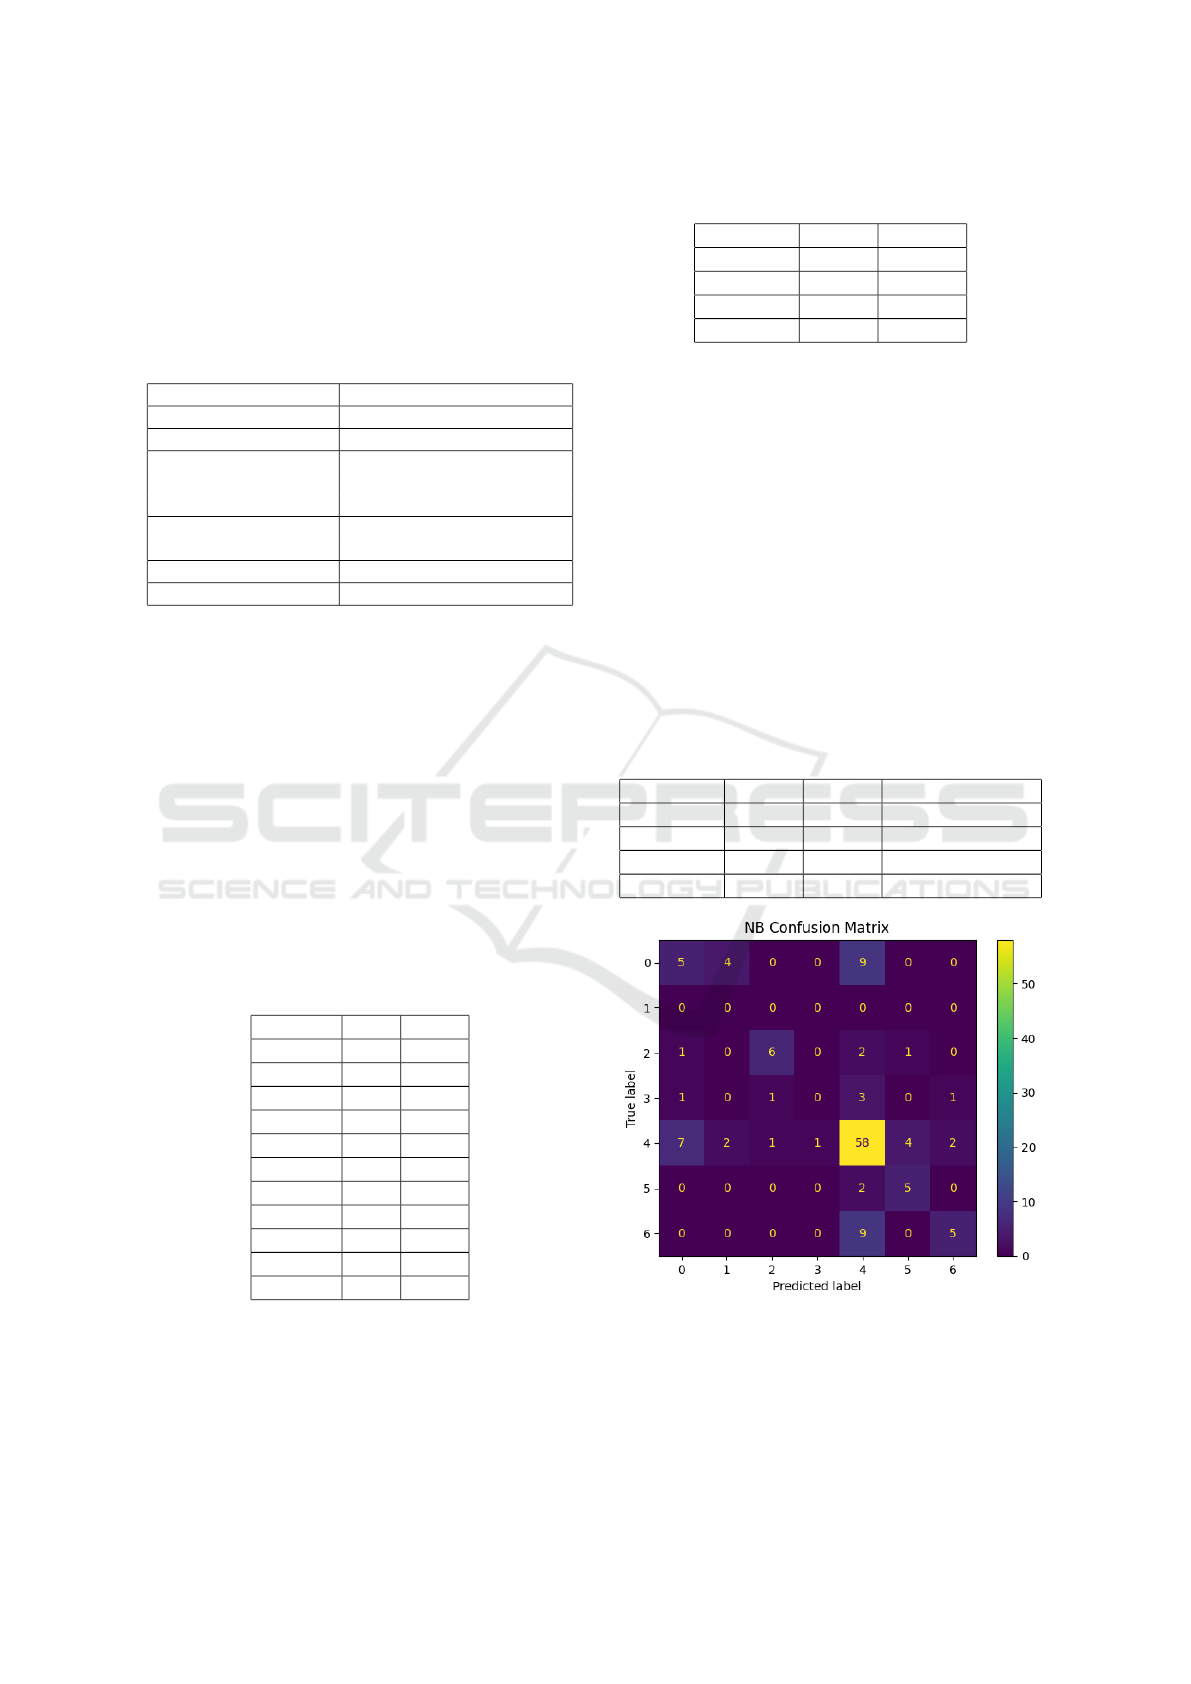
The first technique used was the NB model for
classification, where we applied the MultiOutputClas-
sifier and trained the model with the word dictionary
built from the analysis of comments. The result of
the classification presented the following indicators:
F1-score of 0.23227, Precision of 0.3706, Recall of
0.1905, and Accuracy of 0.1905.
We continue our test now adopting the SVM
model, also for a classification, where we adopted the
same dictionary of words and obtained the following
indicators: F1-score of 0.14636, Precision of 0.3926,
Recall of 0.1111, and an Accuracy of 0.1111.
The comparison of the results obtained with the
two models adopted is shown in Table 2.
Table 2: Results comparison.
NB SVM
Accuracy 0.1905 0.1111
Precision 0.3706 0.3926
Recall 0.1905 0.1111
F1-score 0.23227 0.14636
These results reflect the issues faced with the data
ICAART 2024 - 16th International Conference on Agents and Artificial Intelligence
1208
obtained to construct our dataset, that is, we obtained
a set of unbalanced and small amounts of data for
the adoption of ML techniques. In order to minimize
this issue, we decided to reduce the number of classes
by grouping them according to the proximity between
them, where the result is shown in Table 3.
Table 3: New categories summarized.
Major category Minor categories added
1. Discrimination Aggression and Harassment
2. Conservation state Cleaning
3. Driver Driving mode, Education,
Suitability, Charge,
and Ride status
4. Application Register and
Driver dissatisfaction
5. Route Red line
6. Positive comments No minor added
After regrouping the categories into a smaller
number, we ran our supervised ML models, NB and
SVM, to reclassify the dataset. We divided our dataset
into a part for training and another for testing, follow-
ing a proportion of 80 percent for training and 20 per-
cent for testing. In order to minimize issues related to
overfitting, we used the cross-reference scores func-
tion to fitting the models by computing the scores for
10 times consecutive, as shown in Table 4, in order to
improve the results in the test classification, as shown
in Table 5. Also, we shown the confusion matrix and
ROC curves to NB and SVM models, as shown in the
sequence of figures 4, 5, 6 and 7. As can be seen, the
NB model presented better results compared to the
SVM model.
Table 4: Cross-reference scores results.
NB SVM
Score1 0.81 0.68
Score2 0.76 0.72
Score3 0.69 0.72
Score4 0.67 0.78
Score5 0.72 0.74
Score6 0.69 0.74
Score7 0.70 0.72
Score8 0.73 0.66
Score9 0.66 0.74
Score10 0.70 0.76
Mean 0.71 0.72
The problem of class imbalance is a common
challenge in the task of identifying discrimination in
comments, as it can affect the quality of the model.
To solve this problem, we apply the RandomUnder-
Sampler technique from the imbalanced-learn library
Table 5: Comparison of supervised model test results.
NB SVM
Accuracy 0.6385 0.47694
Precision 0.6304 0.4622
Recall 0.6385 0.4769
F1-score 0.6274 0.4645
to balance the model training. We then build an
SVM classifier with specific class weights ’Applica-
tion’: 5, ’Conservation state’: 7, ’Discrimination’:
10, ’Driver’: 1, ’Positive comments’: 25, ’Route’: 7.
Class weights are assigned so that minority classes
have a greater weight, which contributes to increas-
ing model performance in these classes. With these
adjustments, we created a balanced and adaptive strat-
egy to deal with class imbalance in our dataset. These
changes improved the model’s performance in identi-
fying discrimination in the comments that formed our
dataset, offering a more robust and efficient solution
to tackle the unbalance problem. Therefore, after ad-
justing the specific class weights, our results changed
to an F1-score of 0.4645 to 0.6681. Table 6 shows the
complete new results.
Table 6: Comparison of supervised model test results.
NB SVM SVM (adjusted)
Accuracy 0.6385 0.4769 0.6846
Precision 0.6304 0.4622 0.6594
Recall 0.6385 0.4769 0.6846
F1-score 0.6274 0.4645 0.6681
Figure 4: Confusion matrix NB model results.
Digital Discrimination Detection in Ridesharing Services in Rio de Janeiro City
1209
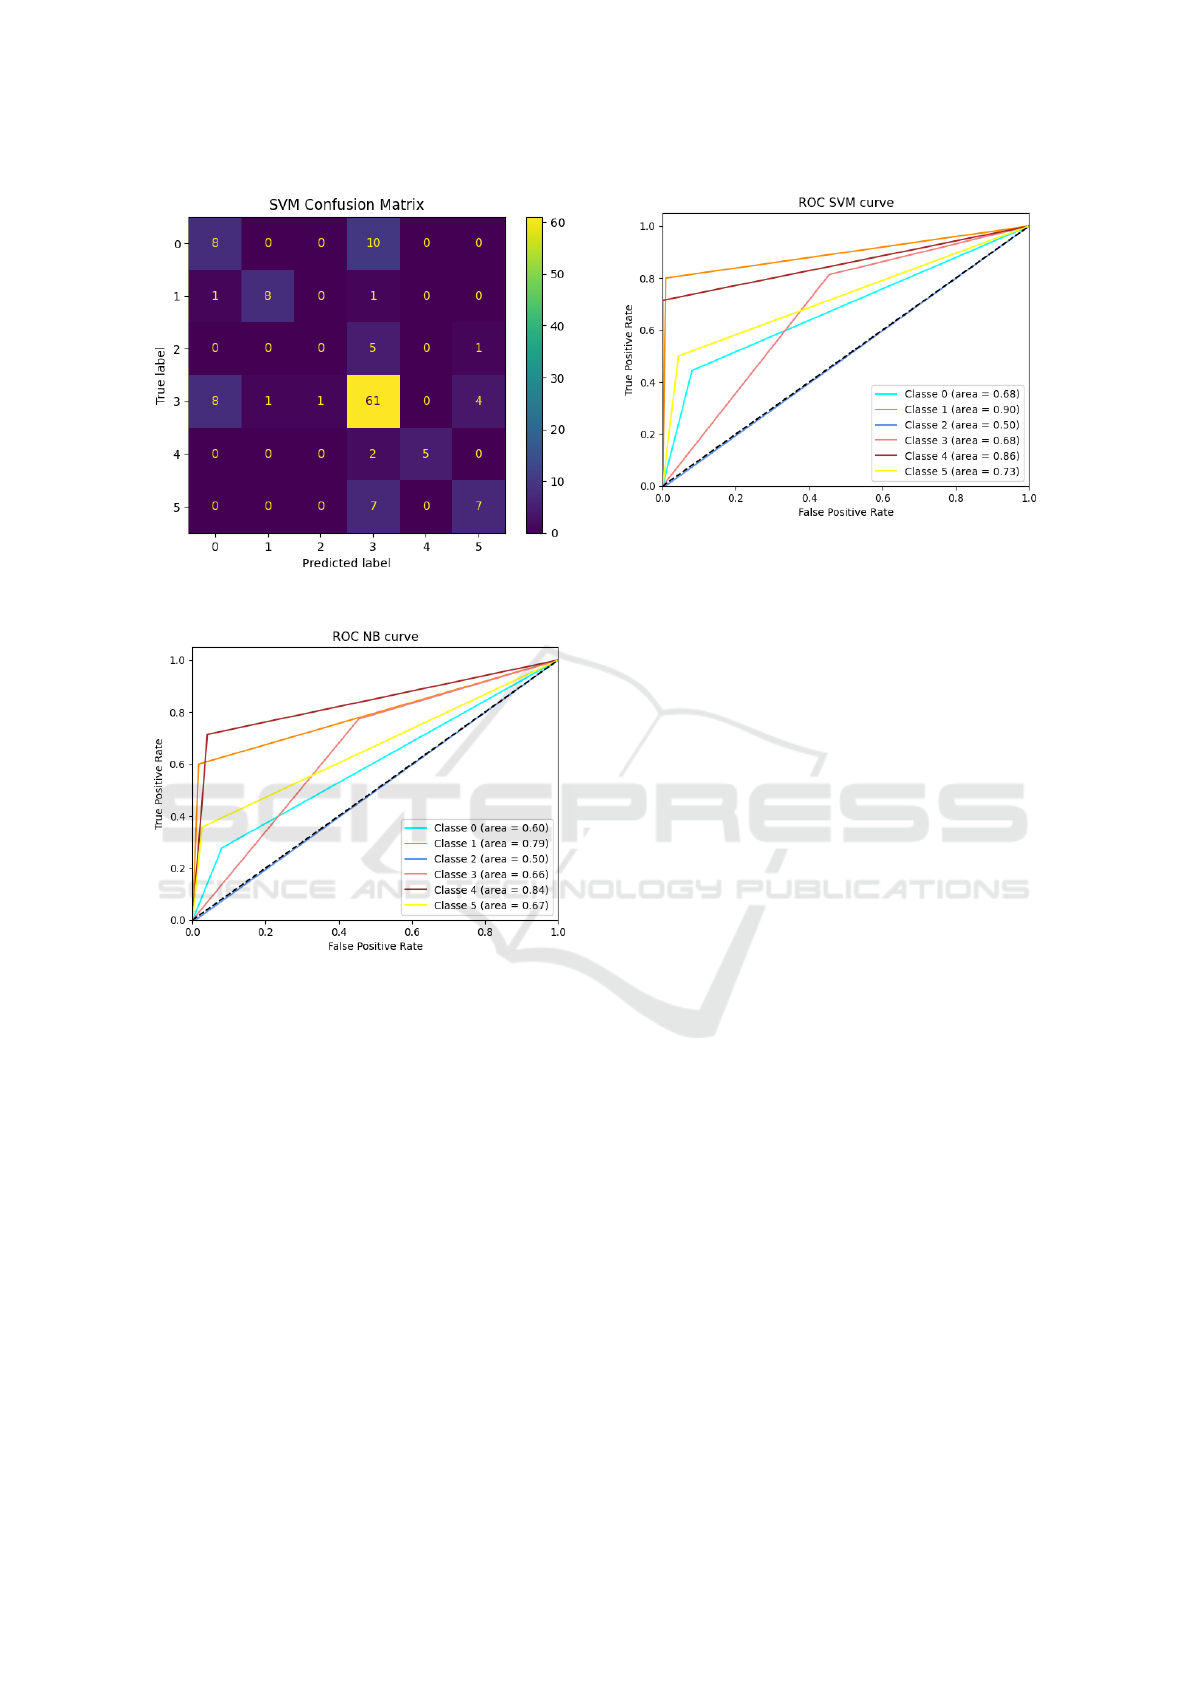
Figure 5: Confusion matrix SVM model results.
Figure 6: ROC curve for NB model.
5 STUDY RESULTS AND
DISCUSSION
Digital discrimination in shared services has been ad-
dressed from different aspects, but the main one found
in the literature was diagnosis as in (Abramova, 2020)
(Brown, 2019) (Yanbo Ge, 2018). But approaches
were also found from the aspect of the information
system where the interest was divided into identifying
biases in the algorithms adopted by shared ride plat-
forms as in (Pandey and Caliskan, 2021) and identify-
ing biases and discrimination manifested by applica-
tion drivers as in (Jorge Mejia, 2020), by passengers
as in (Alex Rosenblat, 2017) and by biases expressed
by both as in (Miroslav Tushev and Mahmoud, 2020).
Shared ride service platforms, with the aim of re-
ducing discrimination on the part of drivers, began
Figure 7: ROC curve for SVM model.
sending the least amount of information about the
passenger to drivers when distributing the ride re-
quest. However, it was still possible to observe dis-
crimination shortly after the acceptance and sharing
of passenger characteristics such as name, gender,
score, origin, and destination addresses (Jorge Mejia,
2020).
Another point addressed in (Pandey and Caliskan,
2021) was the bias in the algorithm of shared ride
systems, where the price of ride fares varies not only
with demand, but also with their location of origin or
destination, where positive relationships were found,
that is, it was identified that locations with a higher
rate of acceptance of rides had higher fares, but also
negative relationships, where locations with a higher
rate of white population have lower rates while loca-
tions with a higher rate of non-white population have
higher rates. In (Jorge Mejia, 2020), the fare value is
identified as one of the points to reduce the cancel-
lation rate due to discrimination. The study suggests
making this cost explicit as an attempt to reduce bi-
ased behavior. An interesting mitigation action found
in the literature is a ride distribution model based on
learning the history of acceptance and cancellation,
that is, promoting a pairing of passengers and drivers,
not only based on a scoring system but also with the
identification of a bias in these platform users and
with this it would be possible to expose them, accord-
ing to (Monachou and Ashlagi, 2019).
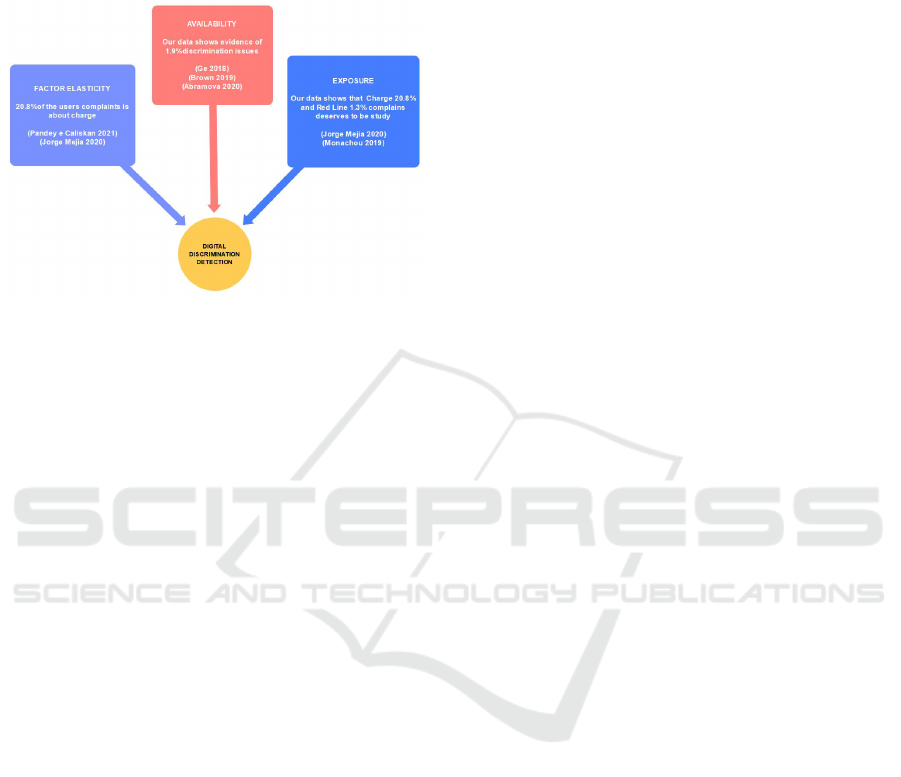
Comparing the results found in the literature with
the data and the ontology analyzed in our study, we
suggest some points for discussion, as shown in Fig-
ure 6. The ride-sharing services available in the city
of Rio de Janeiro present several differences from
platform to platform. Based on our study, 7.4 per-
cent of the complaints found were in relation to dis-
counts not being applied or rides canceled due to the
choice of a discounted ride. This difference suggests
ICAART 2024 - 16th International Conference on Agents and Artificial Intelligence
1210
that users have different perceptions if this mitigating
action works as expected or the dynamic system ap-
plied by this specific platform service, as we found in
(Jorge Mejia, 2020) and (Pandey and Caliskan, 2021).
Figure 8: Ridesharing discrimination detection discussion.
Another interesting point, which at the same time
corroborates the analysis with the studies found in the
literature, was in relation to the provision of passen-
ger information, such as origin and destination ad-
dresses, to the driver only after accepting the ride as
(Miroslav Tushev and Mahmoud, 2021), (Yanbo Ge,
2018), (Brown, 2019) and (Abramova, 2020). How-
ever, this was a point where we found divergent opin-
ions from the user’s platform. Passenger information
is made available after acceptance of the ride as a way
to mitigate discrimination, however, discrimination is
possible to identify that cancellation still occurs after
this information is made available, and when not, pas-
sengers report that the service provided is impacted,
causing embarrassment, discomfort, and insecurity to
the passenger who is disembarked outside the location
requested in the application.
Also, two indicators suggest a more in-depth anal-
ysis, as it was not possible to identify whether there
was direct or statistical discrimination by class or eth-
nicity. The largest of them, with 20.8 percent of com-
plaints, were related to charging, where they were as-
sociated with passenger complaints regarding drivers
who canceled the ride or did not want to use the dis-
count selected by the passenger when requesting the
ride. Another index that it was not possible to de-
termine direct or statistical discrimination by class or
ethnicity for the 1.3 percent of complaints categorized
as Red Line, that is, where the destination address is
located in communities or their surroundings. This
indicator may be more associated with public safety
issues but also it can hide discrimination behavior.
Furthermore, we were able to observe that the NB
model was the best compared to the SVM, until we
adjusted the class weights to solve the unbalanced
class problem. Additionally, we were unable to use
SVM to identify outliers in our data or obtain better
results due to the size of the datasets with both mod-
els.
6 CONCLUSIONS
In this study, it was possible to analyze that the main
problem of this research is a topic of great relevance
to society and there are opportunities to address it in
the information system in order to promote mecha-
nisms that reduce discrimination of any type, be it
racial, gender, sexual orientation, religious or politi-
cal association, of way to eradicate this behavior that
is harmful to society. Our study, combined with an ex-
ploratory analysis of the state of the art in literature,
proposed to answer the following questions:
• RQ1. Is there evidence of digital discrimination in
the ridesharing application used in Rio de Janeiro
city? Based on our analysis, it was possible to
conclude that yes, there is evidence of digital dis-
crimination in the ridesharing services of the city.
• RQ2. Is it possible to identify the factors that lead
to discrimination? Yes, it was possible to iden-
tify that there are factors associated with preju-
dice in particular towards women, with the com-
ments, it was possible to identify that the majority
of drivers are men, we found only 4 comments
with reference to a driver woman, representing
0.63 percent, and 50 percent with positive com-
ments.
• RQ3. What are the key concepts regarding Digital
Discrimination detection in a ridesharing service?
These concepts were identified in our analysis of
the domain, where we proposed an ontology about
it.
• RQ4. Could Machine Learning techniques accu-
rately identify discrimination and its main vari-
ables that can be used in actions to mitigate this
behavior? Yes, it is possible to use ML models to
accurately identify discrimination in ride-sharing
services. We were able to observe that, due to the
size of our data set, with just a small adjustment to
reduce the number of categories used for classifi-
cation, we already improved the results presented
by both models. If it is possible to increase the
size of the data set we can expect these results to
improve even further, in addition, if we get a data
set large enough to apply an unsupervised learn-
ing model, it will be possible to compare the re-
sults between the supervised and unsupervised, in
addition to analyzing the identified patterns and
Digital Discrimination Detection in Ridesharing Services in Rio de Janeiro City
1211

behaviors and checking whether or not it is pos-
sible to identify outliers in our data and thus key
variables for our problem.
As (Miroslav Tushev and Mahmoud, 2020), one
limitation faced was the amount of data, plus the ab-
sence of user information for analysis, as all com-
ments do not contain information and personal char-
acteristics, it does not allow for a more in-depth anal-
ysis of some indicators that may or may not be related
to discrimination due to prejudice, but it was not evi-
dent.
For future work, we propose to enlarge our dataset
to include the complaints from Reclame Aqui web-
site for more ridesharing services offered in Brazil
and from other sources and then we can compare ML
supervised versus unsupervised models for classifica-
tion purposes and to identify outliers in our data anal-
ysis. Also, we can explore the dataset to evaluate
and compare results on the detection of discrimina-
tion between different cities in Brazil, and if the dif-
ferences between ridesharing platforms can increase
or decrease the practice of discrimination.
REFERENCES
Abramova, O. (2020). No matter what the name, we’re all
the same? Electronic Markets.
Alex Rosenblat, e. a. (2017). Discriminating tastes: Uber’s
customer ratings as vehicles for workplace discrimi-
nation. In Policy and Internet.
An Yan, B. H. (2019). Fairst: Equitable spatial and temporal
demand prediction for new mobility systems. In ACM
SIGSPATIAL International Conference on Advances
in Geographic Information Systems.
An Yan, B. H. (2020). Fairness in practice: A survey on
equity in urban mobility. In A Quarterly bulletin of the
Computer Society of the IEEE Technical Committee
on Data Engineering.
Batty, M. e. a. (2012). Smart cities of the future. In The
European Physical Journal.
Brown, A. E. (2019). Prevalence and mechanisms of dis-
crimination: Evidence from the ride-hail and taxi in-
dustries. In Journal of Planning Education and Re-
search.
John F. Dovidio, e. a. (2000). Reducing contemporary prej-
udice: Combating explicit and implicit bias at the in-
dividual and intergroup level.
Jorge Mejia, C. P. (2020). When transparency fails: Bias
and financial incentives in ridesharing platforms.
Miroslav Tushev, F. E. and Mahmoud, A. (2020). Digital
discrimination in sharing economy. In International
Requirements Engineering Conference (RE).
Miroslav Tushev, F. E. and Mahmoud, A. (2021). A sys-
tematic literature review of anti-discrimination design
strategies in the digital sharing economy. In IEEE
Transactions on Software Engineering.
Monachou, F. G. and Ashlagi, I. (2019). Discrimination in
online markets: Effects of social bias on learning from
reviews and policy design. In International Confer-
ence on Neural Information Processing Systems.
Murphy, S. A. (2002). Appendix b: Audit studies and
the assessment of discrimination. National Research
Council.
Pandey, A. and Caliskan, A. (2021). Disparate impact of ar-
tificial intelligence bias in ridehailing. In Conference
on AI, Ethics, and Society.
Yanbo Ge, e. a. (2018). Racial discrimination in transporta-
tion network companies. In Journal of Public Eco-
nomics.
ICAART 2024 - 16th International Conference on Agents and Artificial Intelligence
1212
