
Visual Perception of Obstacles: Do Humans and Machines Focus on the
Same Image Features?
Constantinos A. Kyriakides
1 a
, Marios Thoma
1,2 b
, Zenonas Theodosiou
1,3 c
,
Harris Partaourides
4 d
, Loizos Michael
2,1
and Andreas Lanitis
1,5 e
1
CYENS Centre of Excellence, Nicosia, Cyprus
2
Open University of Cyprus, Nicosia, Cyprus
3
Department of Communication and Internet Studies, Cyprus University of Technology, Limassol, Cyprus
4
AI Cyprus Ethical Novelties Ltd, Limassol, Cyprus
5
Department of Multimedia and Graphic Arts, Cyprus University of Technology, Limassol, Cyprus
Keywords:
Deep Learning Algorithms, Explainability, Eye Tracking, Heatmaps, Obstacle Recognition.
Abstract:
Contemporary cities are fractured by a growing number of barriers, such as on-going construction and infras-
tructure damages, which endanger pedestrian safety. Automated detection and recognition of such barriers
from visual data has been of particular concern to the research community in recent years. Deep Learning (DL)
algorithms are now the dominant approach in visual data analysis, achieving excellent results in a wide range
of applications, including obstacle detection. However, explaining the underlying operations of DL models
remains a key challenge in gaining significant understanding on how they arrive at their decisions. The use
of heatmaps that highlight the focal points in input images that helped the models reach their predictions has
emerged as a form of post-hoc explainability for such models. In an effort to gain insights into the learning
process of DL models, we studied the similarities between heatmaps generated by a number of architectures
trained to detect obstacles on sidewalks in images collected via smartphones, and eye-tracking heatmaps
generated by humans as they detect the corresponding obstacles on the same data. Our findings indicate that the
focus points of humans more closely align with those of a Vision Transformer architecture, as opposed to the
other network architectures we examined in our experiments.
1 INTRODUCTION
One of the oldest and most rudimentary forms of mo-
bility throughout human history is traveling on foot.
According to sociologist Vincent Kaufmann (Kauf-
mann et al., 2004), the capacity of individuals to move
in space and be mobile is partly moderated by access,
which is constrained on the conditions and options
available in a given environment. Contemporary cities
have been fragmented by a growing number of con-
struction barriers and infrastructure damages that gen-
erate several problems, setting pedestrian citizens at
risk.
a
https://orcid.org/0009-0008-7185-400X
b
https://orcid.org/0000-0001-7364-5799
c
https://orcid.org/0000-0003-3168-2350
d
https://orcid.org/0000-0002-8555-260X
e
https://orcid.org/0000-0001-6841-8065
Considering the surge of inhabitants in urban areas
in modern times, urban planning is becoming increas-
ingly important and critical for creating a safe and
efficient environment that is inclusive for those who
do not opt for vehicular means of transportation, such
as pedestrians. The development of automated meth-
ods for detecting and recognizing people, barriers, and
damages in visual data to create safe urban environ-
ments has been of particular concern to the research
community in recent years. In this study, we investi-
gate the visual perception of obstacles in urban areas
between humans and machines using heatmaps, with a
specific focus on enhancing the explainability of Deep
Learning (DL) models.
Specifically, our methodology entails the fine-
tuning of various DL models using the obstacle detec-
tion dataset by (Thoma et al., 2023). We subsequently
extract heatmaps from a carefully curated subset of
Kyriakides, C., Thoma, M., Theodosiou, Z., Partaourides, H., Michael, L. and Lanitis, A.
Visual Perception of Obstacles: Do Humans and Machines Focus on the Same Image Features?.
DOI: 10.5220/0012453500003660
Paper published under CC license (CC BY-NC-ND 4.0)
In Proceedings of the 19th Inter national Joint Conference on Computer Vision, Imaging and Computer Graphics Theory and Applications (VISIGRAPP 2024) - Volume 4: VISAPP, pages
357-364
ISBN: 978-989-758-679-8; ISSN: 2184-4321
Proceedings Copyright © 2024 by SCITEPRESS – Science and Technology Publications, Lda.
357

20 images using Grad-CAM (Selvaraju et al., 2017),
representing 10 diverse urban obstacles. Concurrently,
we conduct a comprehensive eye-tracking experiment
involving 35 university students, tasking participants
with identifying specific urban obstacles within the
same dataset subset. The resulting 20 heatmaps per ma-
chine learning model and humans (aggregated across
participants) underwent both quantitative and qualita-
tive analyses. To perform the quantitative comparison
between the extracted machine learning model and
human heatmaps, we employed a multi-grid methodol-
ogy that aims to assess the spatial similarity between
pairs of heatmaps.
2 LITERATURE REVIEW
The study by (Szarvas et al., 2005) compared the per-
formance of pedestrian detection systems when em-
ploying Convolutional Neural Networks (CNNs) ver-
sus Support Vector Machines (SVMs), in search of a
method that could alleviate the problem of pedestrian
accidents. “GLACCESS” is a smartphone applica-
tion prototype, designed to aid walking individuals
with visual impairments by identifying pedestrians in
their surroundings via the collection of images from
wearable cameras (Lee et al., 2020). In an effort to
mitigate accidents associated with distracted pedestri-
ans, (Wang et al., 2012) have used machine learning to
create a smartphone application that detects vehicles
in close proximity to pedestrians who use their smart-
phones while walking. Similarly, (Tung and Shin,
2018) devised “BumpAlert”, that exploits auditory
data from a walker’s surroundings captured by their
smartphone to detect nearby objects. However, pedes-
trian safety is not only endangered by nearby objects,
but also by structural damages that may be present
on their path. For example, structural problems as-
sociated with footpaths and pavements can result in
individuals stumbling and falling (International Trans-
port Forum, 2012). To diminish the effect of such
problems, (Maeda et al., 2018) have used deep neu-
ral networks to detect road damages that compromise
pedestrian safety.
The issue of pedestrian safety has recently gained
further interest in the literature, with studies proposing
novel solutions based on state of the art DL meth-
ods (Thoma et al., 2021). To the best of our knowl-
edge, (Theodosiou et al., 2020) have created the first
dataset consisting of pedestrian obstacle images from
wearable cameras and successfully trained a classifier
capable of distinguishing between 24 distinct types of
pedestrian obstacles and barriers. Wearable cameras
have the potential to be an important source of image
data that can inhibit the risk of pedestrian accidents
by providing real-time information to city authorities
about the current state of the city’s infrastructure. Es-
pecially when combined with intelligent detection sys-
tems trained to identify possible threats around a city,
authorities can take the necessary actions and mea-
sures in due time to protect walking citizens. This
highlights the importance of datasets such as the one
introduced in (Theodosiou et al., 2020), that can be
used for fine-tuning DL models.
The use of automated software capable of identi-
fying barriers in sidewalks can facilitate repairs, espe-
cially when coupled with continuous incoming streams
of data from the local community. (Thoma et al., 2021)
published a proof-of-concept study featuring a smart-
phone application that enables the notification of com-
munity members when barriers are detected through
images of wearable cameras. The relevance of wear-
able technology in promoting the health of the wearer
has been accentuated multiple times in the past (Do-
herty et al., 2013; Studer et al., 2018; Prabu et al.,
2022).
Although the current state of DL research has made
significant leaps in developing accurate models for
various tasks, there is still a need to comprehend how
these models arrive at their decisions. DL models
are inherently hard to explain, due to the multitude
of layers and intermediate computations between the
input and output layers, which often leads to these
models being called “black boxes”.
2.1
Towards Improving Explainability in
Deep Learning
Research in recent years has stressed the importance of
promoting explainable AI that can provide some type
of explanatory logic behind its inferences, in contrast
to merely accepting the algorithm’s results without
properly understanding how the algorithm arrives to
its predictions (Chinu and Bansal, 2023). In this vein,
post-hoc explainability methods have become indis-
pensable tools for analyzing visual models and provid-
ing insights into their decision-making processes.
These techniques, ranging from gradient-based
methods (Zeiler and Fergus, 2014; Selvaraju et al.,
2017) to occlusion analysis (Springenberg et al., 2015),
provide a post-hoc understanding of why a trained
model made a particular prediction. Effectively, they
work by highlighting the significant features and re-
gions that influenced a model’s decision in an effort to
decipher the black-box nature of DL models. However,
despite the advancements in post-hoc explainability, a
crucial aspect remains unexplored: a direct compari-
son with human-generated heatmaps.
VISAPP 2024 - 19th International Conference on Computer Vision Theory and Applications
358

Figure 1: The 20 images used in the experiments.
A direct comparison between model-generated and
human-generated heatmaps holds promise for uncover-
ing valuable insights into the alignment of visual atten-
tion. These investigations may shed light on whether
the features emphasized by the model in its heatmaps
align with the salient aspects recognized by human
observers, offering a comprehensive perspective on
the interpretability and reliability of visual models.
It is important to note that machine-generated and
human-generated heatmaps stem from entirely differ-
ent processes. Consequently, a direct comparison
between the two is not straightforward. Machine-
generated heatmaps are created using gradient-based
techniques, highlighting the influential features for
prediction, whereas human-generated heatmaps are de-
rived from eye-tracking data, which capture visual at-
tention based on the duration and location of gazes on
specific areas of the image. Another significant distinc-
tion lies in the application process: machine-generated
heatmaps are applied instantaneously to the entire in-
put image, whereas human-generated heatmaps un-
fold sequentially, reflecting the human observer’s time-
dependent focus. This may entail positive, negative
and even repetitive attention to reach to a conclusion.
Acknowledging these methodological distinctions is
essential for an accurate comparative analysis between
model-generated and human-generated heatmaps.
2.2 Eye Tracking
Eye trackers have gained popularity over the years as
tools for investigating human attention and collecting
eye-tracking data. The primary objective of gathering
eye-tracking data is to capture the temporal dynamics
of a participant’s gaze, allowing the identification of
regions of interest in the displayed image. A scanpath,
representing the trajectory of the eye’s movement, is
subsequently superimposed on the image, highlighting
the participant’s gaze path. Fixations denote specific
areas that capture a participant’s attention, summa-
rizing spatial and temporal information about the at-
tention afforded to specific parts of the image. The
accumulation of multiple fixations forms a gaze.
Spatial information regarding a participant’s gaze
is derived from inspecting the position of dots on a
scanpath, while the temporal length of each fixation
is determined by the size of each dot. Larger dots in-
dicate longer fixation durations, offering insights into
the perceived significance of a particular region for
the given image interpretation task (Blascheck et al.,
2014). Fixations are generated by computing the aggre-
gated number (“fixation count”), position coordinates
and duration of individual fixations. A saccade refers
to the rapid eye movement occurring when transition-
ing from one fixation to another. Eye-tracker data are
typically stored in EyeLink Data Format files (EDF)
or plain text, encoding events such as fixation points
and saccades during stimulus exposure (Wang, 2021).
A popular method for interpreting eye move-
ment data is through Attention Map generation
(heatmaps) (Wang, 2021; Blascheck et al., 2014). Vi-
sual representations of eye-tracking data facilitate qual-
itative analyses, revealing spatial positions where in-
dividuals concentrate their focus. This information
aids researchers in gaining a deeper understanding of
how the participants’ visual attention is distributed
across image stimuli (Blascheck et al., 2014). For a
comprehensive guide on analyzing eye movement data,
readers are encouraged to consult (Wang, 2021).
3 METHODOLOGY
In order to investigate the correspondence between
machine- and human-generated heatmaps in the con-
text of obstacle detection, we devised a methodology
comprising three distinct steps
1
:
1.
Fine-tuning various deep learning models utilizing
the obstacle detection dataset from (Thoma et al.,
2023). Following the model refinement, we extract
heatmaps from a carefully curated subset of 20
images using Grad-CAM (Selvaraju et al., 2017),
representing 10 diverse urban obstacles.
1
The code used is available at https://constantinos-k.git
hub.io/visual-perception-of-obstacles/
Visual Perception of Obstacles: Do Humans and Machines Focus on the Same Image Features?
359
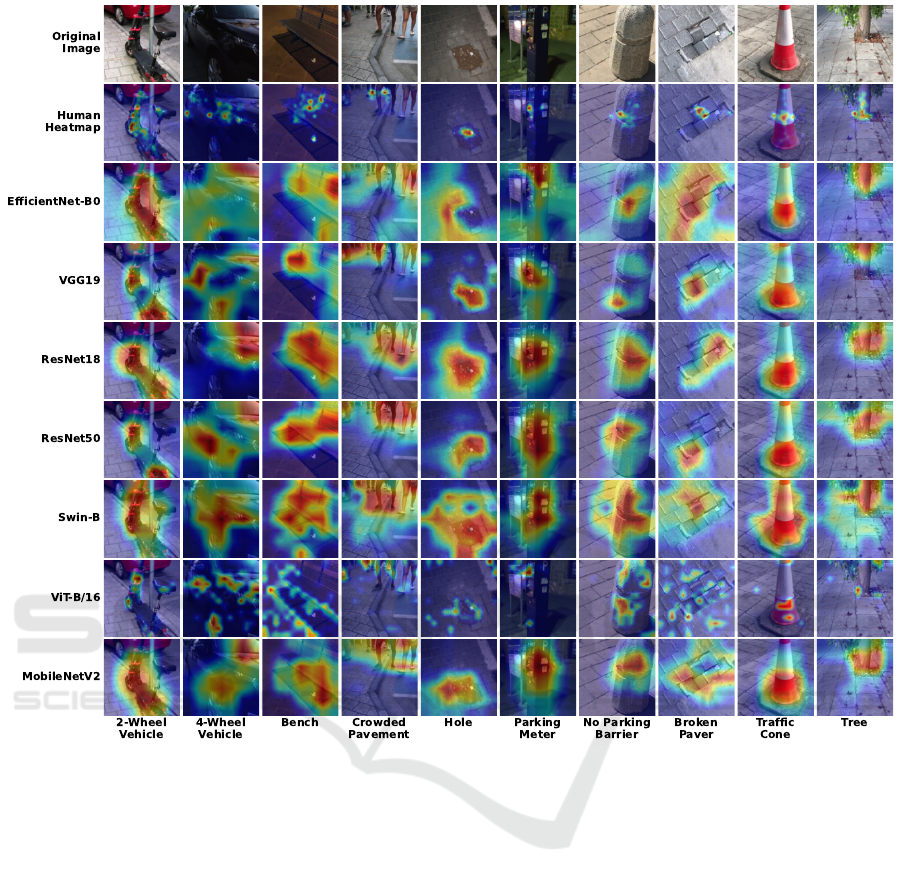
Figure 2: The human heatmaps (2nd row) and the machine heatmaps (from 3rd row and downwards) for the seven DL
architectures, for a subset of the 10 images (1st row) used in the experiments.
2.
Performing a comprehensive eye-tracking exper-
iment involving 35 university students, using the
same 20 images from step 1. Participants were
tasked with identifying specific urban obstacles
within the aforementioned dataset subset.
3.
Employing a multi-grid approach to perform a
quantitative comparison between the resulting
20 heatmaps per machine learning model and
those generated by human participants, with the
heatmaps aggregated across all participants for
each image.
For the comprehensive comparison of visual simi-
larities between the heatmaps generated by DL models
and those derived from human observations, we em-
ployed a 4-step multi-grid approach (see Figure 3). In
the initial step, the human-generated heatmaps under-
went resizing from a resolution of
1080 × 1080
pixels
to
224 × 224
pixels, to ensure uniformity in size with
the machine-generated heatmaps. Subsequently, both
machine and human heatmaps were segmented into
blocks of
16 × 16
pixels, resulting in 196 blocks per
heatmap by the end of this step. The average bright-
ness value of each block was computed within the
range
[0, 255]
. The next stage involved calculating the
brightness difference between corresponding blocks in
the human and machine heatmaps. Finally, the 196 in-
dividual brightness differences were summed to derive
a total visual difference value, providing a quantifi-
able measure of the dissimilarity between the pair of
heatmaps under comparison.
The devised methodology allows for a detailed
exploration of the similarities in attentional patterns
between machine and human observers in the context
of urban obstacle detection.
VISAPP 2024 - 19th International Conference on Computer Vision Theory and Applications
360
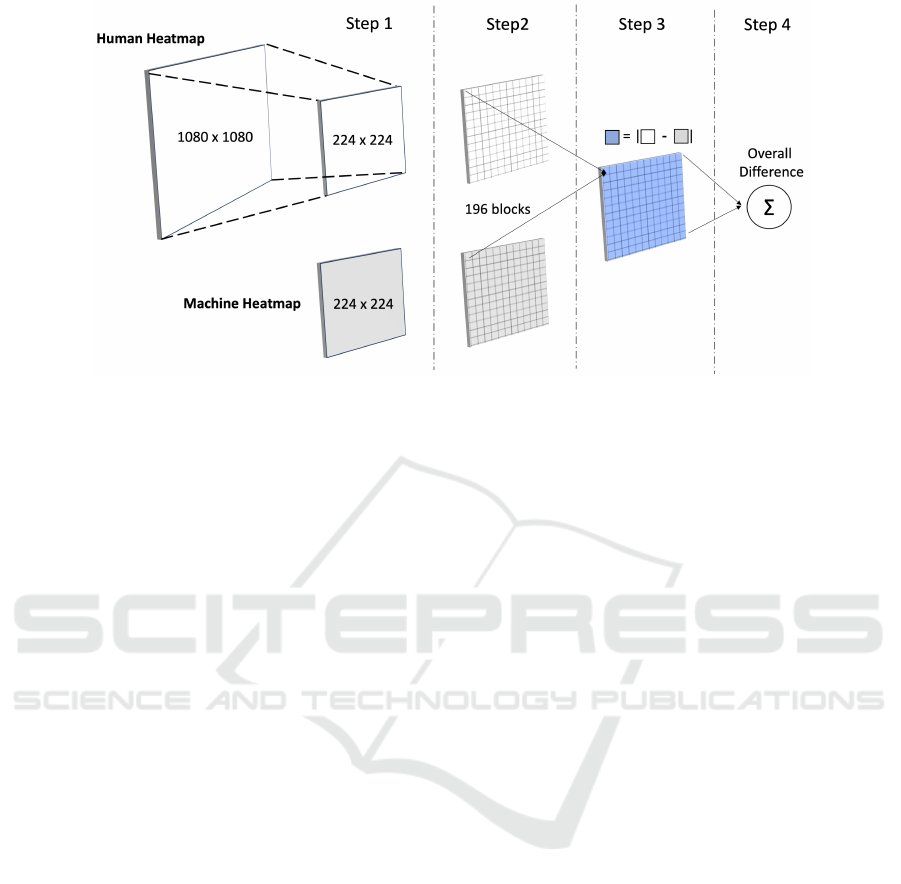
Figure 3: The steps followed for comparing the visual similarities between machine and human heatmaps.
4 EXPERIMENTAL RESULTS
In this section, we present the outcomes of our ex-
periments, focusing on the extraction and comparison
of machine- and human-generated heatmaps in the
domain of urban obstacle detection. In this context,
we used transfer learning to fine-tune pre-trained ma-
chine learning models for the task of obstacle detection.
Specifically, we used images depicting obstacles that
affect the safety of pedestrians on city sidewalks (Fig-
ure 1). The images are assigned into the following
10 categories: two-wheeled vehicle, four-wheeled ve-
hicle, bench, crowded sidewalk, hole, parking meter,
parking prevention barrier, broken pavement, traffic
cone, and tree.
To cover a broad spectrum of DL architectures,
this study employs a diverse set of models, specifically
VGG19 (Simonyan and Zisserman, 2014), ResNet18
and ResNet50 (He et al., 2015), MobileNetV2 (San-
dler et al., 2018), EfficientNet-B0 (Tan and Le, 2020),
Swin Transformer (Swin-B) (Liu et al., 2021), and
ViT-B/16 (Dosovitskiy et al., 2021). Subsequent to the
training process, we employ the Grad-CAM algorithm
to extract machine-generated heatmaps from a subset
of 20 images.
4.1 Machine-Generated Heatmaps
Grad-CAM is a DL visualization tool that produces
a heatmap that identifies what parts of an image con-
tribute most to the output of a model (Selvaraju et al.,
2017). At its core, Grad-CAM taps into the gradient
information flowing through the layers of the model.
By capturing the gradients of the sought class with
respect to the desired layer, Grad-CAM assigns im-
portance scores to different spatial locations. These
importance scores are then used to generate a weighted
combination of the feature maps, creating a heatmap
that illustrates the regions where the neural network fo-
cused during its decision-making process. In our exper-
iments, we employed the last layer before the output of
each model, which generates coherent heatmaps. Due
to the model-agnostic nature of Grad-CAM, it can be
easily applied to a broad spectrum of DL architectures.
In our methodology, heatmaps were generated by
providing Grad-CAM with the correct classification
label for each image, ensuring a systematic and con-
sistent approach across all seven models. To maintain
uniformity, all input images featured a resolution of
224 × 224
pixels. The resultant heatmaps were saved
for subsequent comparisons with heatmaps generated
from human observations. For visualization purposes,
the generated heatmaps were superimposed onto the
original input images, visually highlighting the identi-
fied regions that contributed to the output predictions.
The combined images can be viewed in Figure 2.
4.2 Human-Generated Heatmaps
Human heatmaps were acquired through eye-tracking
experiments conducted in a well-equipped laboratory
using the Nano Tobii Eye Tracker. Thirty-five partici-
pants, aged between 21 and 24 years with no reported
vision impairments, took part in the experiments. Each
participant was presented with the set of 20 images,
and their task was to detect the corresponding obsta-
cle in each image. The experimental process involved
displaying the images on the screen in sequence, with
participants progressing to the next image upon iden-
tifying the obstacle. Prior to each experiment, indi-
Visual Perception of Obstacles: Do Humans and Machines Focus on the Same Image Features?
361
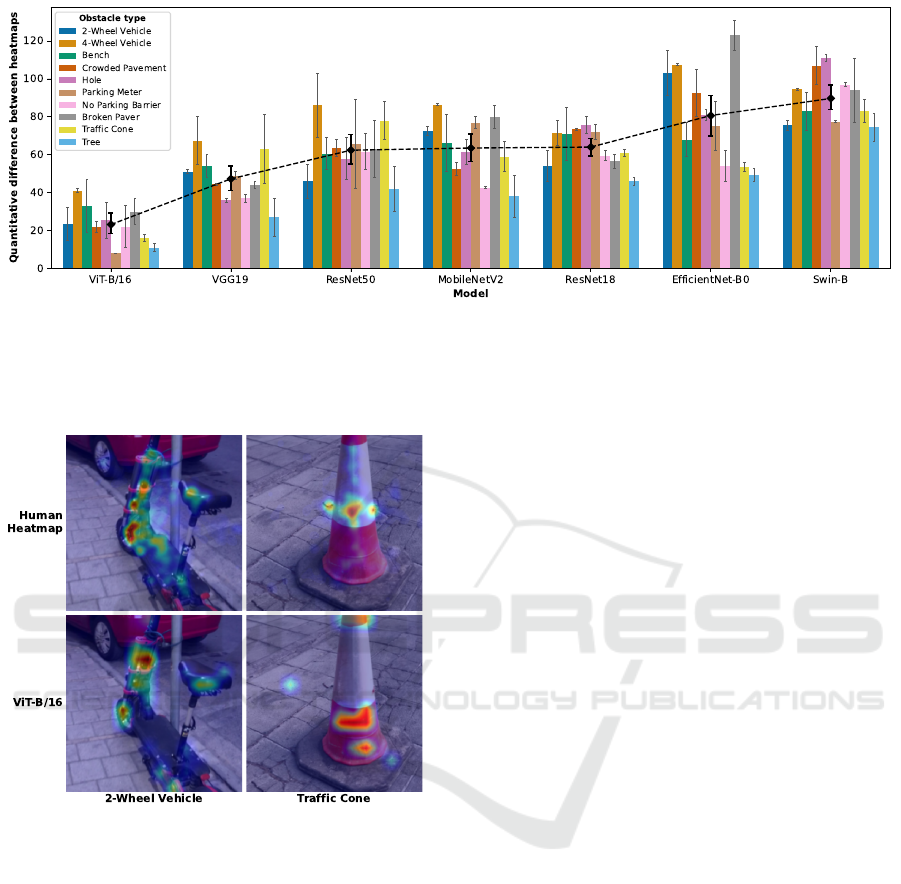
Figure 4: Quantitative differences between human eye-tracking heatmaps against the corresponding machine heatmaps for each
of the 7 vision models. Each model’s performance is averaged over the two distinct images per obstacle type. The models
are sorted from left-to-right, starting with the model that, on average, least deviates from the human heatmaps (ViT-B/16)
to the one with the highest deviation (Swin-B), as depicted by the black dashed trendline. The error bars represent the 95%
confidence intervals, calculated using bootstrapping to estimate the variability and uncertainty inherent in the sample means.
Figure 5: Detailed comparison for the human vs machine
heatmaps for two of the obstacle images, showing the simi-
larity of the ViT-B/16 heatmaps to their human counterparts.
vidualized calibration procedures were conducted to
ensure accurate eye-tracking data. All experiments
were conducted under daylight conditions, with each
session lasting approximately 15 minutes.
Following the experiments, heatmaps were ex-
ported for each image with dimensions of
1080×1080
pixels. The information within the heatmaps is repre-
sented using shades of gray within the range of
[0, 255]
.
The resulting eye-tracking heatmaps for 10 of the im-
ages are shown in the second row of Figure 2, super-
imposed on the original images, and using the same
colorscale as those from the vision model heatmaps.
4.3 Heatmap Comparison
After performing the multi-grid approach, the obtained
visual dissimilarity values provide a comprehensive
understanding of the convergence and divergence in
attentional patterns between the DL models and hu-
man observers. This quantitative analysis contributes
valuable insights into the explainability and alignment
of machine-generated heatmaps with human visual at-
tention, shedding light on the efficacy of these models
in the specific task of urban obstacle detection.
Our comparison of the seven machine learning
models revealed considerable variability in the extent
to which generated heatmaps resembled the averaged
human heatmaps. As shown in Figure 4, ViT-B/16
scored the lowest numerical differences on average
across all images and algorithms, indicating a closer
resemblance to human heatmaps (representative ex-
amples of the similarity between the ViT-B/16 and
human heatmaps can be seen on Figure 5). In con-
trast, the highest numerical differences were identified
for EfficientNet-B0 and the Swin-B models. This out-
come is arguably noteworthy, especially considering
that the Swin Transformer incorporates an attention
mechanism whose conception was inspired by human
attention, yet it did not align closely with the human
heatmaps.
The superior performance of ViT-B/16, which also
employs an attention mechanism, raises intriguing
questions about the specific elements of the ViT ar-
chitecture that contribute to its closer correlation with
human heatmaps and broader patterns of human visual
perception. These findings suggest that models with
smaller differences may more accurately resemble hu-
man perception, although this inference necessitates
further research. Such explorations could enhance our
VISAPP 2024 - 19th International Conference on Computer Vision Theory and Applications
362

understanding of the interplay between DL algorithms
and human processing styles and potentially drive the
development of future DL algorithms that better mirror
visual human processing.
5 CONCLUSIONS
In conclusion, our study focused on the extraction
and comparison of machine-generated and human-
generated heatmaps in the context of urban obstacle
detection. The experiments utilized a diverse set of
DL models fine-tuned on images depicting various
obstacles encountered on pavements that affect pedes-
trian safety. We employed the Grad-CAM algorithm to
extract machine-generated heatmaps, visualizing the
features learned by the models during obstacle detec-
tion. These heatmaps were systematically compared
with human-generated heatmaps obtained through eye-
tracking experiments involving 35 participants. The
visual dissimilarity values provided insights into the
alignment of machine-generated heatmaps with human
visual attention. ViT-B/16 demonstrated the closest
resemblance to human heatmaps. ViT-B/16’s supe-
rior performance prompts further investigation into
the specific architectural elements contributing to its
alignment with human perception.
By pulling back the veil on how these models are
attributing significance within images, we can better
understand and trust their outputs. If machine learning
models are designed to more closely resemble human
perception, their decision-making processes may be-
come inherently more understandable, sharing com-
mon ground with recognized human cognitive patterns.
Such an approach could not only improve the inter-
pretability of individual models, but also contribute to
a broader understanding of how to design models that
are both accurate and explainable, which is a signif-
icant goal in the field of artificial intelligence. Sim-
ilarly, when dealing with image interpretation tasks
where humans display increased accuracy, the use of
network architectures that resemble human perception
could lead to more accurate results whereas for tasks
that human performance is inferior, architectures that
resemble human perception should be avoided. The
findings pave the way for the development of more
explainable and more accurate models.
This paper presents the preliminary results of our
work that lay the foundations for further investigation.
Our future research plans include extracting and com-
paring the heatmaps of additional DL architectures as
well as investigating how the extracted results can be
used to improve the accuracy and explainability of the
generated models.
ACKNOWLEDGEMENTS
This project has received funding from the European
Union’s Horizon 2020 research and innovation pro-
gramme under grant agreement No 739578 comple-
mented by the Government of the Republic of Cyprus
through the Directorate General for European Pro-
grammes, Coordination and Development.
REFERENCES
Blascheck, T., Kurzhals, K., Raschke, M., Burch, M.,
Weiskopf, D., and Ertl, T. (2014). State-of-the-Art
of Visualization for Eye Tracking Data. In EuroVis -
STARs, page 29.
Chinu and Bansal, U. (2023). Explainable AI: To Reveal the
Logic of Black-Box Models. New Generation Comput-
ing.
Doherty, A. R., Hodges, S. E., King, A. C., Smeaton, A. F.,
Berry, E., Moulin, C. J. A., Lindley, S., Kelly, P., and
Foster, C. (2013). Wearable Cameras in Health: The
State of the Art and Future Possibilities. American
Journal of Preventive Medicine, 44(3):320–323.
Dosovitskiy, A., Beyer, L., Kolesnikov, A., Weissenborn, D.,
Zhai, X., Unterthiner, T., Dehghani, M., Minderer, M.,
Heigold, G., Gelly, S., Uszkoreit, J., and Houlsby, N.
(2021). An Image is Worth 16x16 Words: Transform-
ers for Image Recognition at Scale. In International
Conference on Learning Representations (ICLR 2021).
He, K., Zhang, X., Ren, S., and Sun, J. (2015). Deep Resid-
ual Learning for Image Recognition.
International Transport Forum (2012). Pedestrian Safety, Ur-
ban Space and Health. ITF Research Reports. OECD.
Kaufmann, V., Bergman, M. M., and Joye, D. (2004). Motil-
ity: Mobility as Capital. International Journal of Ur-
ban and Regional Research, 28(4):745–756.
Lee, K., Sato, D., Asakawa, S., Kacorri, H., and Asakawa, C.
(2020). Pedestrian Detection with Wearable Cameras
for the Blind: A Two-way Perspective. In Proceedings
of the 2020 CHI Conference on Human Factors in
Computing Systems, CHI ’20, pages 1–12. Association
for Computing Machinery.
Liu, Z., Lin, Y., Cao, Y., Hu, H., Wei, Y., Zhang, Z., Lin, S.,
and Guo, B. (2021). Swin Transformer: Hierarchical
Vision Transformer using Shifted Windows.
Maeda, H., Sekimoto, Y., Seto, T., Kashiyama, T., and
Omata, H. (2018). Road Damage Detection and Classi-
fication Using Deep Neural Networks with Smartphone
Images. Computer-Aided Civil and Infrastructure En-
gineering, 33(12):1127–1141.
Prabu, A., Shen, D., Tian, R., Chien, S., Li, L., Chen, Y.,
and Sherony, R. (2022). A Wearable Data Collection
System for Studying Micro-Level E-Scooter Behavior
in Naturalistic Road Environment.
Sandler, M., Howard, A., Zhu, M., Zhmoginov, A., and Chen,
L.-C. (2018). MobileNetV2: Inverted Residuals and
Visual Perception of Obstacles: Do Humans and Machines Focus on the Same Image Features?
363

Linear Bottlenecks. In Proceedings of the IEEE Con-
ference on Computer Vision and Pattern Recognition,
pages 4510–4520.
Selvaraju, R. R., Cogswell, M., Das, A., Vedantam, R.,
Parikh, D., and Batra, D. (2017). Grad-CAM: Visual
Explanations from Deep Networks via Gradient-based
Localization. In Proceedings of the IEEE International
Conference on Computer Vision, pages 618–626.
Simonyan, K. and Zisserman, A. (2014). Very Deep Convo-
lutional Networks for Large-Scale Image Recognition.
arXiv:1409.1556.
Springenberg, J. T., Dosovitskiy, A., Brox, T., and Ried-
miller, M. (2015). Striving for Simplicity: The All
Convolutional Net.
Studer, L., Paglino, V., Gandini, P., Stelitano, A., Triboli, U.,
Gallo, F., and Andreoni, G. (2018). Analysis of the Re-
lationship between Road Accidents and Psychophysi-
cal State of Drivers through Wearable Devices. Applied
Sciences, 8(8):1230.
Szarvas, M., Yoshizawa, A., Yamamoto, M., and Ogata,
J. (2005). Pedestrian Detection with Convolutional
Neural Networks. In IEEE Proceedings. Intelligent
Vehicles Symposium, 2005., pages 224–229.
Tan, M. and Le, Q. V. (2020). EfficientNet: Rethinking
Model Scaling for Convolutional Neural Networks.
Theodosiou, Z., Partaourides, H., Atun, T., Panayi, S., and
Lanitis, A. (2020). A First-person Database for De-
tecting Barriers for Pedestrians. In VISIGRAPP 2020 -
Proceedings of the 15th International Joint Conference
on Computer Vision, Imaging and Computer Graphics
Theory and Applications, volume 5, pages 660–666.
Thoma, M., Partaourides, H., Sreedharan, I., Theodosiou,
Z., Michael, L., and Lanitis, A. (2023). Performance
Assessment of Fine-Tuned Barrier Recognition Mod-
els in Varying Conditions. In Tsapatsoulis, N., Lanitis,
A., Pattichis, M., Pattichis, C., Kyrkou, C., Kyriacou,
E., Theodosiou, Z., and Panayides, A., editors, Com-
puter Analysis of Images and Patterns, Lecture Notes
in Computer Science, pages 172–181. Springer Nature
Switzerland.
Thoma, M., Theodosiou, Z., Partaourides, H., Tylliros, C.,
Antoniades, D., and Lanitis, A. (2021). A Smartphone
Application Designed to Detect Obstacles for Pedes-
trians’ Safety. In Paiva, S., Lopes, S. I., Zitouni, R.,
Gupta, N., Lopes, S. F., and Yonezawa, T., editors, Sci-
ence and Technologies for Smart Cities, Lecture Notes
of the Institute for Computer Sciences, Social Infor-
matics and Telecommunications Engineering, pages
358–371. Springer International Publishing.
Tung, Y.-C. and Shin, K. G. (2018). Use of Phone Sen-
sors to Enhance Distracted Pedestrians’ Safety. IEEE
Transactions on Mobile Computing, 17(6):1469–1482.
Wang, T., Cardone, G., Corradi, A., Torresani, L., and Camp-
bell, A. T. (2012). Walksafe: A Pedestrian Safety App
for Mobile Phone Users Who Walk and Talk While
Crossing Roads. In Proceedings of the Twelfth Work-
shop on Mobile Computing Systems & Applications,
HotMobile ’12, pages 1–6. Association for Computing
Machinery.
Wang, Z. (2021). Eye Movement Data Analysis and Visual-
ization. In Wang, Z., editor, Eye-Tracking with Python
and Pylink, pages 197–224. Springer International Pub-
lishing.
Zeiler, M. D. and Fergus, R. (2014). Visualizing and Under-
standing Convolutional Networks. In Fleet, D., Pajdla,
T., Schiele, B., and Tuytelaars, T., editors, Computer Vi-
sion - ECCV 2014, Lecture Notes in Computer Science,
pages 818–833. Springer International Publishing.
VISAPP 2024 - 19th International Conference on Computer Vision Theory and Applications
364
