
Assessment of the Detectability of Vulnerable Road Users:
An Empirical Study
Wentong Yang
1
, Shota Matsubayashi
2
, Kazuhisa Miwa
1
, Shinya Kitayama
3
, Manabu Otsuka
3
and Koji Hamada
3
1
Graduate School of Informatics, Nagoya University, Nagoya, 4648601, Japan
2
Institutes of Innovation for Future Society (InFuS), Nagoya University, Nagoya, 4648601, Japan
3
Advanced Research and Innovation Center, DENSO Corporation, Aichi, 4700111, Japan
Keywords: Traffic Safety, Advanced Driver Assistance System, Driver Cognition, Collision Risk, Vulnerable Road Users.
Abstract: This study analysed the detectability of vulnerable road users (VRUs) as a function of time to the closest point
of approach. We defined four patterns: Gradual Increasing Pattern and High Detectability Pattern as the safe
situation, Immediate Increasing Pattern and Low Detectability Pattern as the dangerous situation and
investigated empirically drivers’ detection patterns. The results showed that motorbikes in the same direction
showed the dangerous pattern, and pedestrians in the same direction also showed the dangerous patterns but
influenced by the distance of closest point of approach. Bicycles in the same direction showed higher
detectability due to their positioning in the driver's field of view for longer time. For the VRUs in the opposite
direction, and those in the left and right direction, participants also showed high detectability. The results give
implications for advanced driver assistance systems (ADAS) design.
1 INTRODUCTION
1.1 Traffic Accidents at Intersections
Urban safety is a pressing issue, and traffic accidents
are one of its major concerns. Intersections have been
identified as accident hotspots, and over half of all
accidents occurred at or near them (Japanese police
department, 2022). Drivers must be alert to the
movement of vehicles, pedestrians, bicycles, and
motorbikes from multiple directions. Hills (1980)
found that driving at intersections requires large
amounts of visual and cognitive resources to deal
with high-density visual stimuli. As accidents at
intersections occur frequently, and the resulting
cognitive challenges are significant, it is imperative
to promptly implement traffic safety measures.
One potential solution to the issue is to rapidly
introduce advanced driver assistance systems
(ADAS), which utilize numerous sensors and
cameras to scan the surrounding environment, and
which provide alerts and notifications to the driver.
However, drivers may not always be receptive to
these notifications. According to Lee et al. (2002),
early alerts may be seen as bothersome, especially for
vigilant drivers (Lee et al., 2002). Naujoks et al.
(2016) revealed that warnings that urge drivers to
respond quickly in urgent scenarios can be perceived
as irritating. Therefore, it is crucial for ADAS to work
effectively and match the attention levels of drivers.
Vulnerable Road Users (VRUs) refers to non-
motorised individuals, including pedestrians, cyclists,
motorbikes, and persons with disabilities. This study
examines scenarios in which a moving vehicle
approaches VRUs at intersections.
Intersections are significant meeting points for
VRUs. Tay (2015) observes that the high complexity
of traffic flow at intersections poses greater risks to
VRUs. Furthermore, Cantin et al. (2009) found that
driver’s distractible attention at intersections
threatens VRUs safety. Furthermore, Werneke and
Vollrath (2012) found that driver distraction was the
primary cause of accidents involving VRUs and
vehicles. Driver distraction could lead to accidents as
VRUs may not be detected successfully. Although
there have been numerous studies on the detection of
VRUs by drivers, most of them were mainly
concerned with the detection characteristics of single
VRUs. In this study, however, we developed a
framework in which the detection characteristics of
many types of VRUs can be examined based on a
unified format.
508
Yang, W., Matsubayashi, S., Miwa, K., Kitayama, S., Otsuka, M. and Hamada, K.
Assessment of the Detectability of Vulnerable Road Users: An Empirical Study.
DOI: 10.5220/0012451300003660
Paper published under CC license (CC BY-NC-ND 4.0)
In Proceedings of the 19th International Joint Conference on Computer Vision, Imaging and Computer Graphics Theory and Applications (VISIGRAPP 2024) - Volume 1: GRAPP, HUCAPP
and IVAPP, pages 508-515
ISBN: 978-989-758-679-8; ISSN: 2184-4321
Proceedings Copyright © 2024 by SCITEPRESS – Science and Technology Publications, Lda.

1.2 Objectives
This research aims to examine how detectability of
VRUs is influenced by an increase in collision risk.
Ascertaining the relationship between collision risk
and VRUs detectability is crucial to enhance road
safety for both drivers and other road users. When
collision risk is high, drivers must detect it with
concentration. Yoshitake et al. (2020) revealed that
drivers direct their visual attention towards the
surrounding of the intersection and detect pedestrians
early enhances the likelihood of avoiding a collision
when turning right at intersections. Such research
emphasises the importance of recognising VRUs in
high-risk collision situations. Further investigation is
necessary to examine the effect of collision risk on
detectability of VRUs. Understanding the
relationship between such variability and
detectability is crucial to improve traffic safety
measures.
1.3 Relationship Between Detectability
and Collision Risk
This study quantitatively measured detectability
using d' based on the signal detection theory. A higher
value of d' indicates better ability to distinguish target
from noise. For the calculation of d', the current study
used fuzzy signal detection theory (Parasuraman et
al., 2000).
Fuzzy signal detection theory modifies the
outcomes of hit, miss, false alarm, and correct
rejection in signal detection theory by distributing
each stimulus-response combination into categories
where they can be partially assigned to multiple
outcomes. In each trial, participants determine the
presence of a VRUs by providing a score of 0-1. Hit
rate, false alarm rate, miss rate, and correct rejection
rate are employed to calculate d', following the
procedure of traditional signal detection theory. The
formula for d' is as (1):
d' = Z (Hit rate) – Z (False Alarm rate) (1)
On the other hand, collision risk is calculated
based on t, until the driver and VRUs approach their
closest point of approach to each other. A shorter t
duration leads to a higher collision risk.
In the realm of shipping, objective index of
potential collisions has been developed, one of which
is the TCPA (Time to Closest Point of Approach) and
DCPA (Distance of Closest Point of Approach)
indicators (Chauvin and Lardjane, 2008).
TCPA corresponds to the time t to the reapproach
point in this study. In this study, two moderator
variables are assumed.
DCPA is considered the first moderator of this
function. Along with DCPA, the degree of traffic
congestion in the driving environment is considered
as another moderator. Bao and Boyle (2009) found
that high levels of traffic congestion led to an increase
in leftward visual scanning when approaching an
intersection to detect VRUs. Hence, these studies
suggest that the traffic congestion affects detectability
of VRUs.
This study analyses the change in detectability of
VRUs with increasing crash risk when drivers turn
right and left at intersections. We utilise the
detectability index d' as the dependent variable, while
the independent variable is the time t until the driver's
vehicle reaches the closest point of approach to
VRUs. In order to reveal these relationships, we
consider two moderators, DCPA and traffic
congestion. Our study formulates a classification of
functions that predict detectability during right and
left turns. Understanding this function is crucial for
the development of ADAS.
2 TYPOLOGIES OF
DETECTTABILITY TYPES
In this study, d' is viewed as a function of the time t
taken to reach the closest point of approach.
Correspondingly, we hypothetically classify four
patterns for this function.
Gradual Increasing Pattern
Figure 1: Gradual Increasing Pattern.
Figure 1 indicates the Gradual Increasing Pattern. As
the collision risk increases, d' increases gradually.
This suggests that detectability increases as the driver
approaches the VRUs. Since such an increase in
detectability is expected to contribute to avoidance of
traffic accidents and risk reduction, this pattern is
judged to be relatively safe.
Assessment of the Detectability of Vulnerable Road Users: An Empirical Study
509

Immediate Increasing Pattern
Figure 2: Immediate Increasing Pattern.
Figure 2 indicates the Immediate Increasing Pattern.
d' maintains at a low level and increases immediately
just before approaching VRUs. This pattern indicates
that the driver has not detected the VRUs
immediately before. It is considered a dangerous
pattern.
High Detectability Pattern
Figure 3: High Detectability Pattern.
Figure 3 indicates the High Detectability Pattern. The
driver maintains a consistently high d' regardless of t.
This suggests that the driver maintains persistently
high detectability. Therefore, in such situations, this
pattern is judged to be relatively safe.
Low Detectability Pattern
Figure 4: Low Detectability Pattern.
Figure 4 indicates the Low Detectability Pattern. The
driver maintains a consistently low d' regardless of t.
This suggests that the driver does not detect the
VRUs. Such a pattern is judged to be the most
dangerous because it is difficult to avoid accidents.
And this pattern may pose a significant risk to other
traffic participants.
3 EXPERIMENT
This study used driving videos to examine how
detectability of VRUs changes with increasing
collision risk.
3.1 Participants
A cloud service enrolled 320 participants (166 males,
153 females and 1 other), with a mean age of 41.9
years (SD = 8.71). 287 participants held a valid
driver's licence, and the average duration since the
licence was obtained was 18.1 years. fees were
provided to each participant.
3.2 Driving Video
The driving videos were produced using the Unity
software for 3D graphics by the following five
factors: evaluation targets, time to the closest point
(t), DCPA, traffic condition, and presence/absence of
the target.
To calculate the necessary false alarm rate for d'
calculation, additional videos were produced without
the evaluation target in each condition. As a result, a
total of 320 (10 x 4 x 2 x 2 x 2) operational videos
were prepared.
Evaluation Targets
Ten evaluation targets were adopted (see Figure 6).
When turning left,the evaluation targets included
pedestrians in opposite direction, pedestrians in same
direction, motorbikes in same direction, bicycles in
same direction and bicycle in left direction. When
turning right, the evaluation targets included
pedestrians in opposite direction, pedestrians in same
direction, motorbikes in opposite direction, bicycles
in opposite directions, and bicycles in right direction.
Speeds for pedestrians, bicycles, and motorbikes
were set to 3.6 km/h, 10.8 km/h, and 32.4 km/h,
respectively.
HUCAPP 2024 - 8th International Conference on Human Computer Interaction Theory and Applications
510
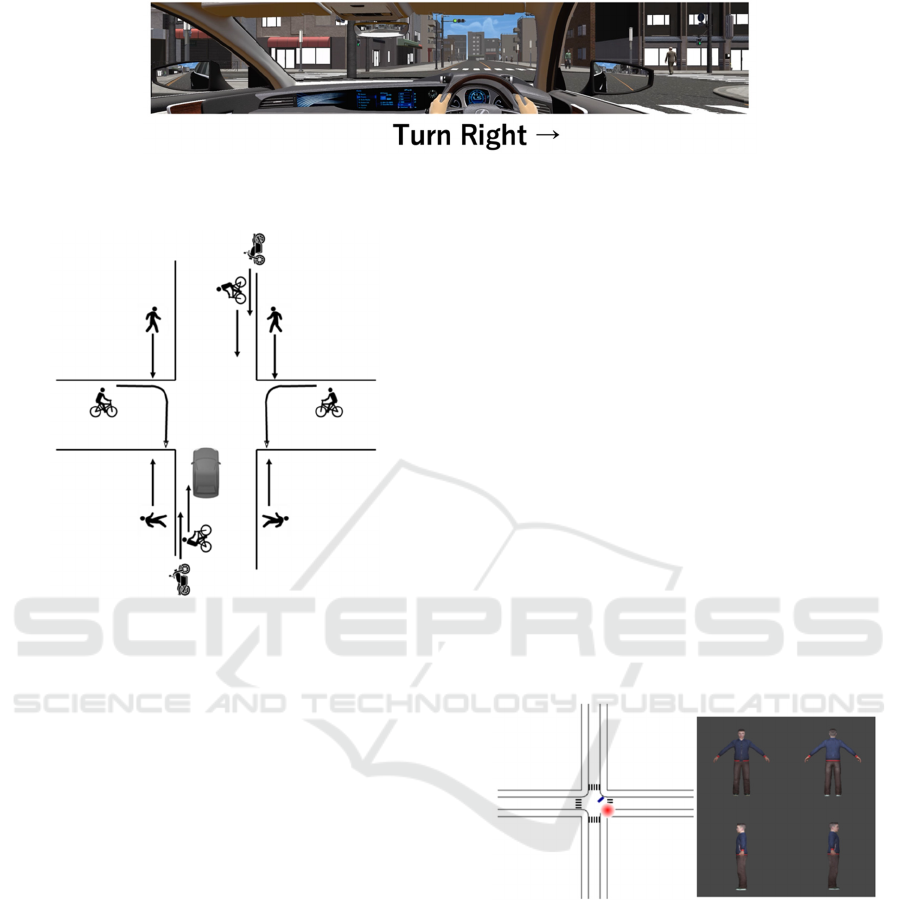
Figure 5: An example screenshot of observing phase. Text information was displayed at the bottom of the screen during the
video playback, signalling whether the turn was right or left.
Figure 6: 10 types of evaluation targets.
Time to Closest Point (t)
The time t was selected as an independent variable to
be 0s, 3s, 6s, and 9s before reaching the closest point
of approach.
DCPA
DCPA is the distance to evaluation targets when
drivers reached the closest point of approach. It
served as the first moderator with conditions set at 1
m and 5 m.
Traffic Congestion
Traffic congestion, as the second moderator, was
established in two conditions, quiet condition, and
crowded condition. This was achieved by
manipulating the number of traffic participants.
3.3 Procedures
The study comprised of two phases, the observing
phase, and the test phase. During the observing phase,
participants were instructed to watch a video from the
perspective of an actual driver. The video stopped at
seconds before reaching the closest point of approach.
For instance, if t is 3 seconds, the video paused when
there were 3 seconds remaining until the closest point
of approach. Figure 5 shows an example screenshot
of observing phase.
Subsequently, the test phase began. Participants
rated the detectability against the evaluation target as
it appeared in driving video. The evaluation target
image was positioned on the right side of the display
screen. On the left-hand side of the screen, an aerial
view displayed the positions of the participant's
vehicle and the evaluation target at the time of video
cessation. The blue rectangle denoted the participant's
vehicle, while the red circle marked the location of
the evaluation target. Figure 7 shows an example
screenshot of test phase. Participants were presented
with the question, "When the video stopped, was the
target shown on the right-hand side of the screen at
the point indicated by the red circle?" To respond,
participants used a slider bar. This rating scale
presented 'definitely not' on the left end and 'definitely
was' on the right end. Participants moved the slider to
indicate their level of confidence in their perception.
Figure 7: An example screenshot of test phase.
At the outset of the study, the participants were
randomly allocated into four distinct groups. Each
group was shown 80 videos from the total of 320. The
rationale behind dividing the participants into four
groups was to ensure that any of them rated only one
target, for instance, a motorbike approaching from the
opposite direction while turning right. Each of the
four groups received a video displaying a single
evaluation target approaching the closest point of
approach at one of four time-intervals, 0s, 3s, 6s or
9s.
Before the main task, participants performed four
practice trials. During the main task, 80 stimuli were
Assessment of the Detectability of Vulnerable Road Users: An Empirical Study
511
presented in a randomised order. A rest was set
following every 20 trials. Upon completion of the
main task, participants were asked to provide
demographic variables. The study parameters
encompassed age, gender, driving history, and the
duration since the individual acquired their driving
license.
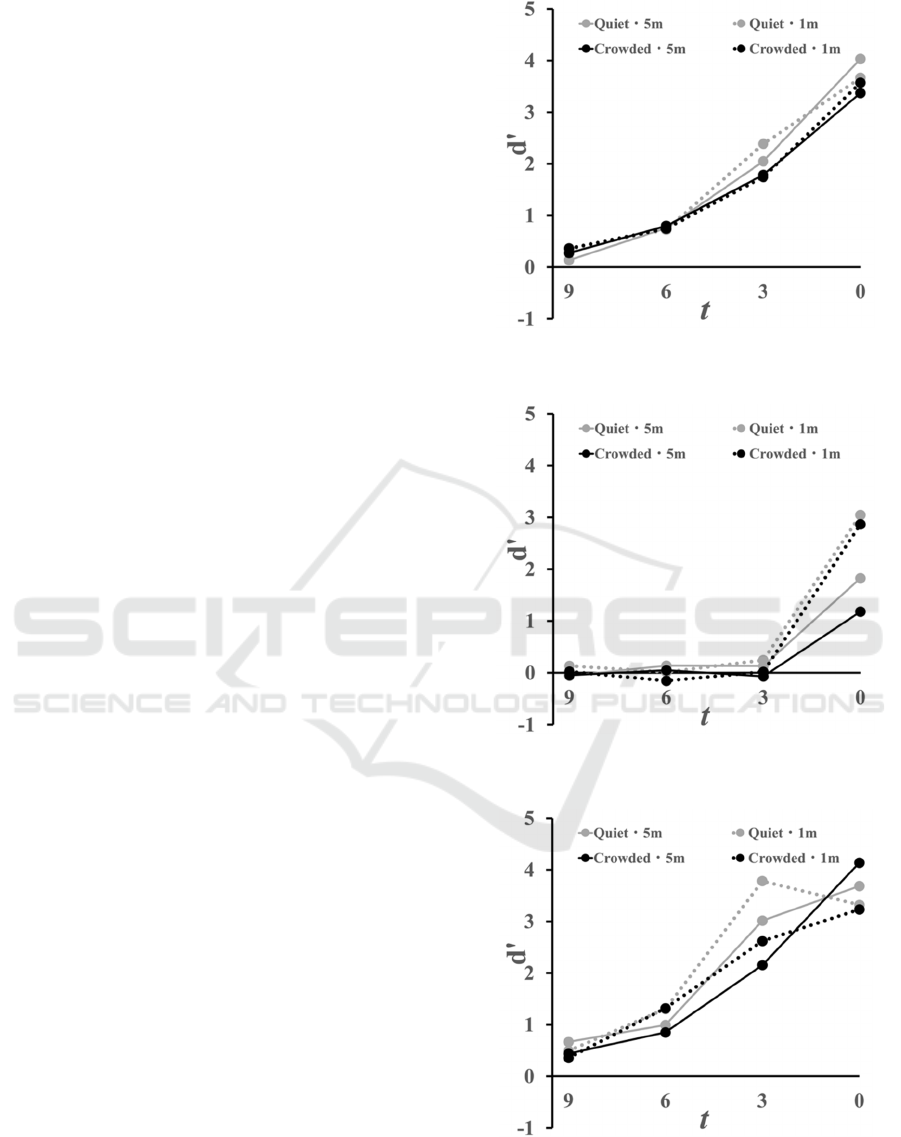
4 RESULTS
The results of the analysis, with the time t to the
closest point of approach as the independent variable
and d' as the dependent variable, are shown in the
figure (see Figure 8-17). Note that the moderator is
shown as a legend.
Gradual Increasing Pattern included motorbikes
in opposite direction when drivers turn left,
pedestrians in opposite direction when drivers turn
right and left, bicycles in opposite direction when
drivers turn right and bicycles in right and left
directions when drivers turn right and left. And High
Detectability Pattern included bicycles in same
direction when drivers turn left. These patterns
suggest that as the collision risk increases, the
detectability of the evaluated target also increases,
indicating a safer situation.
Low Detectability Pattern included pedestrians in
same direction in the DCPA 5m condition when
drivers turn right and left. And Immediate Increasing
Pattern included pedestrians in same direction in the
DCPA 1m condition when drivers turn right and left,
and motorbikes in same direction when drivers turn
left. These patterns suggest a hazardous situation
where there is low detectability over an extended
period, despite increased collision risk.
As mentioned before, when assessing pedestrians
in same direction, DCPA significantly adjusted the
patterns as a moderator, there was the Low
Detectability Pattern in DCPA 5m condition, and the
Immediate increasing Pattern in DCPA 1 m
condition. Both patterns have maintained low
detectability over the long term and are thereby
dangerous.
On the contrary, none of the assessment targets
were significantly affected by traffic congestion as a
moderator.
Figure 8: Patterns of motorbikes in opposite direction when
drivers turn right.
Figure 9: Patterns of motorbikes in same direction when
drivers turn left.
Figure 10: Patterns of bicycles in opposite direction when
drivers turn right.
HUCAPP 2024 - 8th International Conference on Human Computer Interaction Theory and Applications
512
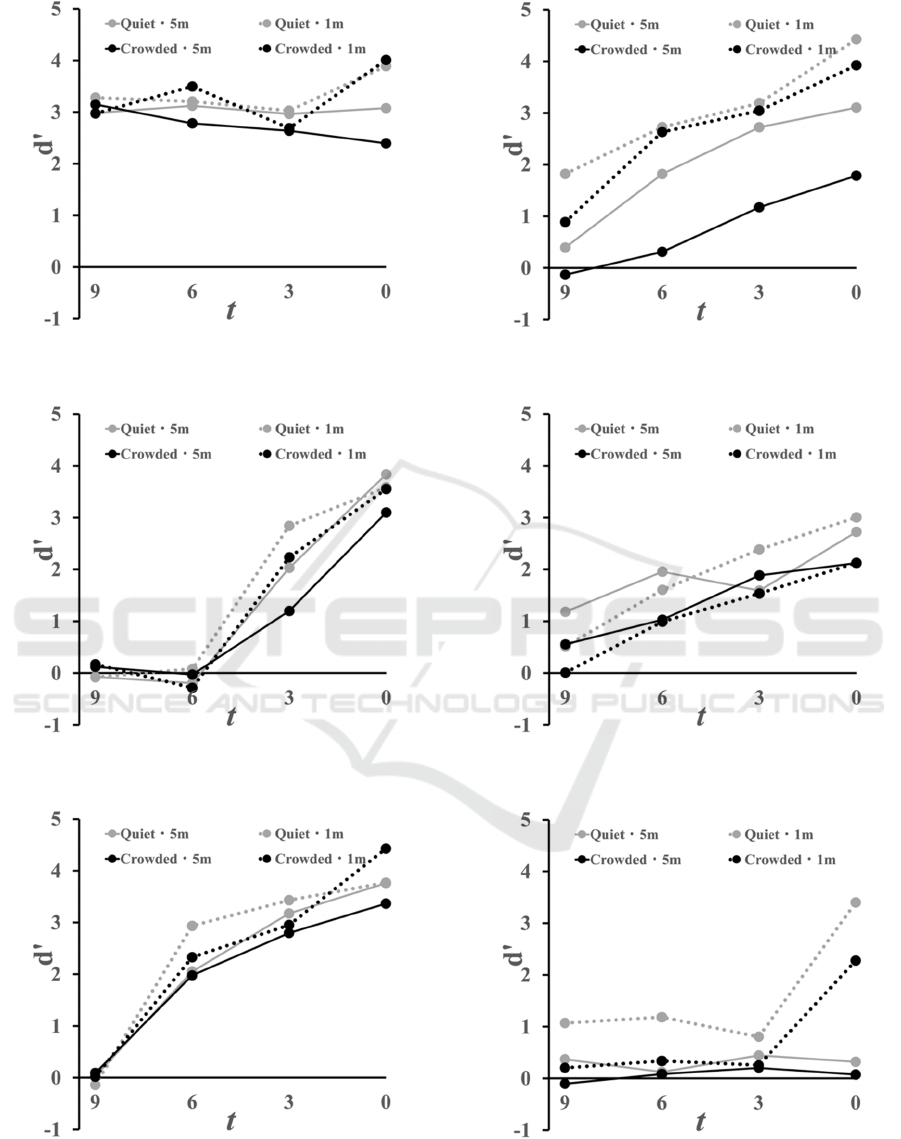
Figure 11: Patterns of bicycles in same direction when
drivers turn left.
Figure 12: Patterns of bicycles in right direction when
drivers turn right.
Figure 13: Patterns of bicycles in left direction when drivers
turn left.
Figure 14: Patterns of pedestrians in opposite direction
when drivers turn right.
Figure 15: Patterns of pedestrians in opposite direction
when drivers turn left.
Figure 16: Patterns of pedestrians in same direction when
drivers turn right.
Assessment of the Detectability of Vulnerable Road Users: An Empirical Study
513
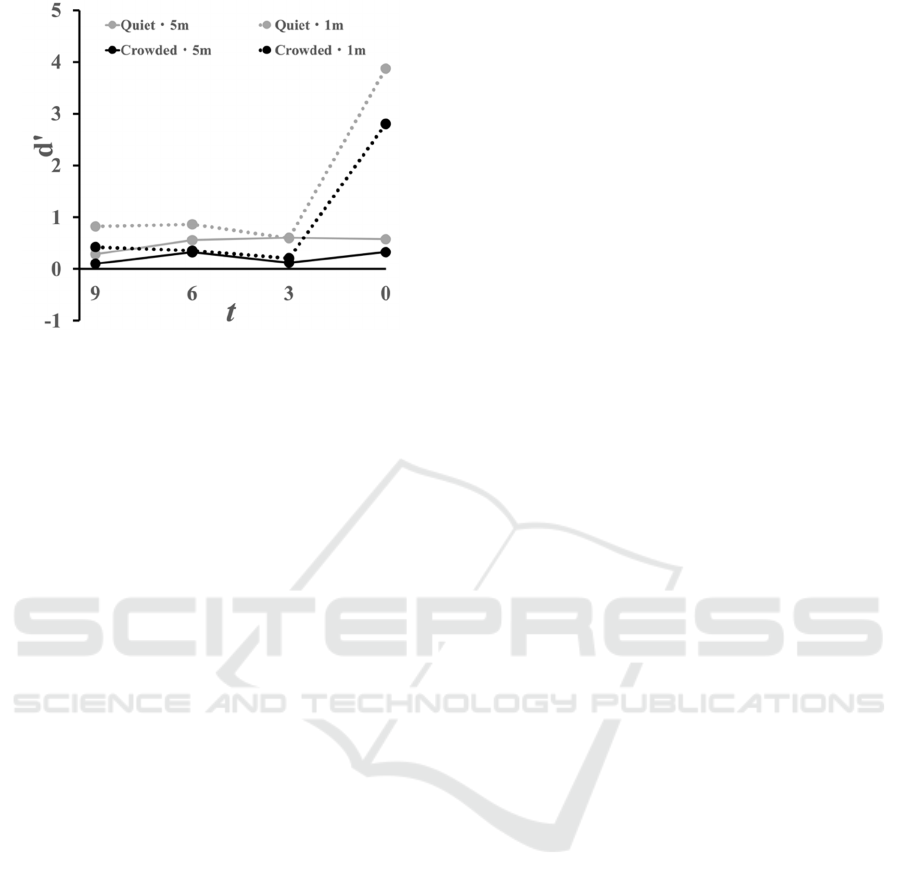
Figure 17: Patterns of pedestrians in same direction when
drivers turn left.
5 DISCUSSION AND
CONCLUSIONS
In this study, the detectability index d' is considered
as a function of the time t, and two dangerous patterns
are defined: the first is the Immediate Increase
Pattern. The second is the Low Detectability Pattern.
In these patterns, d' remains low regardless of t.
Consistently, the Immediate Increasing Pattern
was shown for the motorbikes in same direction when
turning left.
For the pedestrians in same direction, the effect of
the time t was adjusted by DCPA. For the pedestrians
in same direction, the pattern was the Immediate
Increasing Pattern when the DCPA was 1m. And
when the DCPA was 5m, the pattern was the Low
detectability pattern. In any case, these patterns
indicate a dangerous situation. The Low Detectability
Pattern when DCPA was 5m is particularly
dangerous.
As described above, the detectability of VRUs in
same direction decreased, whether they were turning
left or right. These VRUs approach driver from
behind. They had a shorter time in the driver's field of
view than the VRUs approaching from the front. So,
they were therefore considered more difficult to
detect.
Low visibility is also considered a reason for lack
of detectability. Low visibility is one of the most
important factors in accidents (Yousif et al., 2020). In
the present experiment, the motorbikes and pedestrian
in same direction were only visible in the side and
rear-view mirrors for a long time. So, the drivers
maintained a low detectability of such VRUs.
For the pedestrians in same direction, with a
DCPA of 5 m, the pedestrian was only visible in the
side and rear-view mirrors until the video stopped.
With a DCPA of 1 m, the pedestrian appeared next to
the car at the end of the video, which means that
visibility was higher and therefore detectability was
higher.
It is interesting to note that even in same direction,
the detectability was higher for bicycle. The bicycle
in same direction is always in the driver's front left
field of view. Driver passes the bicycle once and the
bicycle approaches again from behind. The long time
spent parallel to the bicycles is thought to be one of
the reasons for the high detectability. In addition, the
driver's experience with bicycles may also play a role
in the detectability of bicycles. A study by Kaya et al.
(2021) showed that drivers with more experience with
bicycles may have greater visual attention related to
the detection of bicycles while driving. The
penetration rate of bicycles in Japan is about 0.5 per
person, a relatively high proportion, so the
detectability of bicycles while driving is likely to be
higher.
The VRUs in opposite direction, and those in the
left and right direction, both showed the Gradual
Increase Pattern, indicating that the participants in
this experiment performed adequate detection.
In addition, the traffic congestion was
manipulated in this experiment, but the results
showed no effect of adjusting the traffic congestion in
any of the situations.
ADAS notifies the driver of warnings in
hazardous situations. This notification must be made
at the required time. Notification of such warnings in
relation to objects for which adequate attention has
been paid may encourage an inappropriate allocation
of cognitive resources to the driver.
Particularly in recent years, there has been a
proliferation of devices installed in cars, and it has
been suggested that the excessive information
displayed by these devices puts pressure on the
driver's cognitive resources. For example, early
warnings may be perceived by drivers as annoying
warnings (Lee et al., 2002), and it has been suggested
that warnings that prompt a quick response in
emergency situations may also be perceived as
unpleasant by drivers (Naujoks et al., 2016).
To address these issues, this study is expected to
provide important guidance for the design of ADAS.
Finally, the limitations of the present study and
future challenges are discussed. In this experiment,
the situation of bicycles in opposite direction when
turning left and motorbikes in same direction when
turning right was not included. This is because such
HUCAPP 2024 - 8th International Conference on Human Computer Interaction Theory and Applications
514

traffic is illegal under Japanese traffic law. In the
same way, there are many violations of the law in the
real scene. Discussion on the detectability of VRUs
that violate the law is an issue for the future.
Furthermore, in this study, experiments were
conducted by using driving videos and having the
participants observe them. In future research, it will
be necessary to follow up this experiment by
conducting experiments in more realistic
experimental environments such as VR and driving
simulation.
REFERENCES
Bao, S. and Boyle, L. (2009) Age-related differences in
visual scanning at median-divided highway
intersections in rural areas. Accident Analysis &
Prevention, 41(1): 146-152.
Catin, V., Lavalliere M., Simoneau, M. and Teasdale N.
(2009) Mental workload when driving in a simulator:
Effects of age and driving complexity. Accident
Analysis & Prevention, 41(4): 763-771.
Chauvin, C. and Lardjane, S. (2008) Decision making and
strategies in an interaction situation: Collision
avoidance at sea. Transportation Research Part F:
Traffic Psychology and Behaviour, 11: 259-269.
Dhamecha, T.I., Singh, R., Vatsa, M., Kumar, A. (2014).
Recognizing Disguised Faces: Human and Machine
Evaluation. PLoS ONE, 9(7): e99212.
Girgis, J., Powell, M., Donmez, B., Pratt, J. and Hess, P.
(2023) How do drivers allocate visual attention
to vulnerable road users when turning at
urban intersections? Transportation Research
Interdisciplinary Perspectives, 19: 100822.
Hills, B. L. (1980) Vision, visibility, and perception in
driving. Perception, 9(2): 183-216.
Japanese police department. (2022) About the
characteristics of the traffic fatal accidents over 4 years
in Reiwa era.
Kaya, N., Girgis, J., Hansma, B. and Donmez, B. (2021)
Hey, watch where you’re going! An on-road study of
driver scanning failures towards pedestrians and
cyclists. Accident Analysis & Prevention, 162: 106380.
Lee, J.D., McGehee, D.V., Brown, T.L.and Reyes, M.L.
(2002) Collision warning timing, driver distraction, and
driver response to imminent rear-end collisions in a
high-fidelity driving simulator. Human Factors, 44:
314-334.
Lemonnier, S., Desire, L., Bremond R., and Baccino, T.
(2020) Drivers’ visual attention: A field study at
intersections. Transportation Research Part F: Traffic
Psychology and Behaviour, 69: 206-221.
Naujoks, F., Kiesel, A. and Neukum, A. (2016) Cooperative
warning systems: The impact of false and unnecessary
alarms on drivers’ compliance. Accident Analysis &
Prevention, 97: 162-175.
Parasuraman, R., Masalonis, A. J. and Hancock, P. A.
(2000) Fuzzy signal detection theory: basic postulates
and formulas for analyzing human and machine
performance. Human Factors, 42(4): 636-659.
Schindler, R. and Piccinini, G. B. (2021) Truck drivers’
behavior in encounters with vulnerable road users at
ubtersections: Results from a test-track experiment.
Accident Analysis & Prevention,159: 106289.
Tay, R. (2015) A random parameters probit model of urban
and rural intersection crashes. Accident Analysis &
Prevention, 84: 38-40.
Werneke, J., and Vollrath, M. (2012) What does the driver
look at? The influence of intersection characteristics on
attention allocation and driving behavior. Accident
Analysis & Prevention, 45: 610-619.
Yousif, M. T., Sadullah, A. F. M. and Kassim K. A. A.
(2020) A review of behavioural issues contribution to
motorcycle safety. IATSS Research, 44(2): 142-154.
Assessment of the Detectability of Vulnerable Road Users: An Empirical Study
515
