
Parkinson’s Disease Detection Through Inertial Signals and
Posture Insights
Manuel Gil-Martín, Sergio Esteban-Romero, Fernando Fernández-Martínez and Rubén San-Segundo
Grupo de Tecnología del Habla y Aprendizaje Automático (T.H.A.U. Group), Information Processing and
Telecommunications Center, E.T.S.I. de Telecomunicación, Universidad Politécnica de Madrid, Madrid, Spain
Keywords: Parkinson’s Disease Detection, Inertial Signals, Fast Fourier Transform, Posture Insights, Lying, Sitting,
Convolutional Neural Networks.
Abstract: In the development of deep learning systems aimed at detecting Parkinson's Disease (PD) using inertial
sensors, some aspects could be essential to refine tremor detection methodologies in realistic scenarios. This
work analyses the effect of the subjects’ posture during tremor recordings and the required amount of data
to assess a proper PD detection in a Leave-One-Subject-Out Cross-Validation (LOSO CV) scenario. We
propose a deep learning architecture that learns a PD biomarker from accelerometer signals to classify
subjects between healthy and PD patients. This study uses the PD-BioStampRC21 dataset, containing
accelerometer recordings from healthy and PD participants equipped with five inertial sensors. An
increment of performance was obtained when using sitting windows compared to using lying windows for
Fast Fourier Transform (FFT) input signal domain. Moreover, using 5 minutes per subject could be
sufficient to properly evaluate the PD status of a patient without losing performance, reaching a window-
level accuracy of 77.71 ± 1.07 % and a user-level accuracy of 87.10 ± 11.80 %. Furthermore, a knowledge
transfer could be performed when training the system with sitting instances and testing with lying examples,
indicating that the sitting activity contains valuable information that allows an effective generalization to
lying instances.
1 INTRODUCTION
Biometrics research has experienced substantial
expansion in recent years, particularly finding
increased applications in the healthcare sector. The
scope of healthcare biometrics extends beyond
controlling access to electronic medical records and
patient identification; it encompasses medical
decision support tools designed for patient care.
These tools extract biomarkers that define patient
health, contributing to illness detection, analysis of
medication response, and the management of
chronic conditions such as Parkinson's Disease (PD).
PD is a neurodegenerative disorder characterized
by motor impairments like tremor, bradykinesia,
rigidity, and postural instability (Jankovic, 2008).
These impairments impact various motor functions,
including planning, programming, sequencing,
movement initiation, and execution (José, 1995).
Deep learning algorithms have being employed
for human motion recognition to model physical
activities using wearables or cameras (Manuel Gil-
Martin, San-Segundo, Fernandez-Martinez, &
Ferreiros-Lopez, 2020, 2021; Gil-Martín, San-
Segundo, Fernández-Martínez, & de Córdoba, 2020;
Zhang et al., 2017). Consequently, these
technologies can also be utilized to model tremor
movements associated with PD.
This work proposes a PD detection system based
on a deep learning architecture that allows analyzing
the effect of the subject’s posture performed while
recording the motion from inertial signals.
Additionally, this analyzes the recording time
required from each subject to evaluate the tremor
and distinguish between healthy people and PD
patients. The primary contributions of this research
are as follows:
Analysis of the inertial signal domain and
sensors for PD detection.
Assessment of different postures to detect PD
based on tremor symptom.
Study of the required recording time to test a
patient and obtain an accurate detection.
1144
Gil-Martín, M., Esteban-Romero, S., Fernández-Martínez, F. and San-Segundo, R.
Parkinson’s Disease Detection Through Inertial Signals and Posture Insights.
DOI: 10.5220/0012451100003636
Paper published under CC license (CC BY-NC-ND 4.0)
In Proceedings of the 16th International Conference on Agents and Artificial Intelligence (ICAART 2024) - Volume 3, pages 1144-1151
ISBN: 978-989-758-680-4; ISSN: 2184-433X
Proceedings Copyright © 2024 by SCITEPRESS – Science and Technology Publications, Lda.

Analysis of knowledge transfer for training
and testing the PD detection system using
different postures.
This paper is organized as follows. Section 2
reviews the literature of PD detection using inertial
sensors. Section 3 reviews the material and methods
used in this study, including a description of the
dataset, the signal processing, the deep neural
network, and the evaluation methodology. Section 4
describes the experiments and the obtained results.
Finally, section 5 summarizes the main conclusions
of the paper.
2 RELATED WORKS
Several researchers have explored the application of
machine learning for detecting motor symptoms
associated with PD through the use of wearable
sensors (Channa, Ifrim, Popescu, & Popescu, 2021;
Lang et al., 2019). However, there remain several
factors that could enhance PD detection systems in
real-world scenarios that could benefit the patients.
Concerning the extraction of features from
inertial signals, different features have used
proposed in previous works for PD detection based
on tremor. Most of these features are based on
measurements in the time domain (such as mean,
range, or cross-correlation) (Cole, Roy, De Luca,
Nawab, & Ieee, 2010; Garcia-Magarino, Medrano,
Plaza, & Olivan, 2016), in the frequency domain
(such as dominant frequency, energy content in a
particular band, or signal entropy) (Rigas et al.,
2012), or a combination of both domains (Dai,
Zhang, & Lueth, 2015). Moreover, other previous
works have concluded that features traditionally
used for speech processing (e.g., frequency analysis
using the Mel scale, cepstral coefficients) are also
effective in classifying human motion from
accelerometer data (San-Segundo, Manuel Montero,
Barra-Chicote, Fernandez, & Manuel Pardo, 2016;
San-Segundo, Navarro-Hellin, Torres-Sanchez,
Hodgins, & De la Torre, 2019; Vanrell, Milone, &
Rufiner, 2018).
As for tremor detection algorithms, previous
works have used a wide variety of machine learning
algorithms, such as decision trees (Garcia-Magarino
et al., 2016), random forests, hidden Markov models
(Rigas et al., 2012), and neural networks (Hathaliya
et al., 2022). For example a previous work
(Hathaliya et al., 2022) used a deep learning
architecture to model tremor obtaining a 92.4% of
accuracy using 6.4-second windows of raw samples
using a single sensor on the left anterior forearm.
However, the data distribution used in this work
seems to simulate a too optimistic scenario since
data from the same subjects were included in both
training and testing subsets and no distinction
between physical activities was performed. In
addition, there exists a lack of a study of the amount
of data required to properly assess unseen patients’
PD status.
Literature which mixes physical activity and PD
assessment is predominantly focused on
investigating whether an individual's likelihood of
developing PD is influenced by the extent of their
physical activity. Notably, prior studies have yielded
insights suggesting a correlation between higher
levels of physical activity and a lower incidence of
PD, particularly among women, with findings
underscoring the importance of these results in
strategic planning for interventions aimed at PD
prevention (Portugal et al., 2023). While the
literature has extensively explored the link between
overall physical activity and PD risk, a noticeable
gap exists in research focused on determining the
specific types of physical activities during which PD
detection is most discernible. Unlike general
physical activity assessments, postures offer a
unique perspective, as they involve more fixed
positions where tremors could become distinctly
noticeable, and other movements are less likely to
mask tremor signals in acceleration data.
This work proposes the use of a deep network for
both feature learning and tremor detection in a
realistic scenario and aims to analyse the effect of
different factors to develop a proper PD detection
system, such as the subjects’ posture or the test time
required per subject, rather than focusing solely on
obtaining the best detection performance. The
selection of an appropriate type and amount of data
collection could improve the overall assessment
during medical visits.
3 MATERIALS AND METHODS
This section includes information about the dataset
used in this work, the signal processing applied, and
the deep neural network used in the PD detection
system and the followed evaluation methodology.
3.1 Dataset
The PD-BioStampRC21 dataset (Adams et al., 2021;
Adams et al., 2017) comprises tri-axial
accelerometer data obtained from five wearable
sensors, encompassing participants with both
Parkinson’s Disease Detection Through Inertial Signals and Posture Insights
1145

Parkinson's disease (PD) and healthy controls. The
data collection utilized lightweight MC 10 BioStamp
RC sensors, with each participant wearing five
sensors affixed to specific body parts—chest, left
anterior thigh, right anterior thigh, left anterior
forearm, and right anterior forearm, as depicted in
Figure 1. The samples were acquired at a sampling
rate of 31.25 Hz. The dataset encompasses
recordings from 34 subjects: 17 healthy controls and
17 PD participants. Upon analysis, it was observed
that some sensors from control participants with IDs
007, 014, and 060 had missing data, prompting their
exclusion from the study.
Figure 1: A study participant wearing the sensors at five
different locations on the chest and each limb (Adams et
al., 2017).
3.2 Signal Pre-Processing
In this work, we used the information from each
inertial sensor isolated or from all together using two
possible input formats to feed the deep neural
networks: Raw data and Fast Fourier Transform
(FFT) magnitude coefficients. Moreover, we
analysed the amount of data from each user that we
need to properly assess his PD status: 1, 5, 10, and
15 minutes for each participant along with their
status in order to feed the classification system.
Initially, the recordings were segmented into
overlapping windows, with a shift equal to half the
window size between consecutive windows. All
windows from each participant were labelled as
either healthy control or PD based on the respective
participant's health status. The classification system
then categorizes each window as either belonging to
a healthy control or a person with PD. In this work,
we evaluated the classification performance when
considering a window size of 3.2 seconds
corresponding to 100 time samples. We obtained the
best classification performance using this window
size over this dataset in preliminary studies.
Next, for each window, we analysed time and
frequency domain signals as inputs for a deep neural
network, incorporating two distinct preprocessing
approaches based on the signal domain. For Raw
data, the original signal suffered no preprocessing,
and the inputs for the deep neural network consisted
directly of the time samples encompassed within
each window. For the FFT, the inputs comprised the
coefficients of the FFT magnitude. These
coefficients were computed in advance for each
analysis window, representing the spectrum from 0
Hz to 15.625 HZ (half of the sampling frequency in
the PD-BioStampRC21 dataset). We decided to
compute this input format because the energy in
tremor motion mostly concentrates in low
frequencies (M. Gil-Martin, Montero, & San-
Segundo, 2019). This paper analyses and compares
both alternatives for tremor modelling and detection.
In addition, this work is focused on analysing the
effect of the posture performed during the motion
recording in order to study which activity is better to
detect the tremor and generalize to new recordings.
We labelled the 3.2-second windows as ‘lying’ or
‘sitting’ using the information from the chest and
thigh sensors (Adams et al., 2017). For each
window, we determined the dominant axis for each
sensor (the axis direction along which the mean
acceleration was largest) and labelled the window
considering the orientation and location of the
sensors.
3.3 Deep Learning Architecture
The deep learning architecture used in this study is a
Convolutional Neural Network (CNN) consisting of
two main components: a feature learning subnet and
a classification subnet. The first subnet acquires
insights from raw data or FFT magnitude
coefficients extracted from inertial signals through
two convolutional layers (32 kernels of dimensions
(1, 5)) and two max-pooling layers (kernels of
dimensions (1, 2)). The second subnet uses fully
connected layers to categorize the learned features
into the predicted classes: a healthy person or a PD
patient. Dropout layers (0.3) were incorporated after
max-pooling and fully connected layers to prevent
overfitting during training. The final layer employes
a SoftMax activation function to provide predictions
for each class in every analysis frame, while
intermediate layers used ReLU to mitigate the
gradient vanishing effect. Categorical cross-entropy
serves as the loss metric, and the Adaptive Moment
Estimation (Adam) optimizer dynamically adjusted
the learning rate during training. The deep learning
structure was trained during 30 epochs and a batch
size of 100. Figure 2 illustrates the architecture
ICAART 2024 - 16th International Conference on Agents and Artificial Intelligence
1146
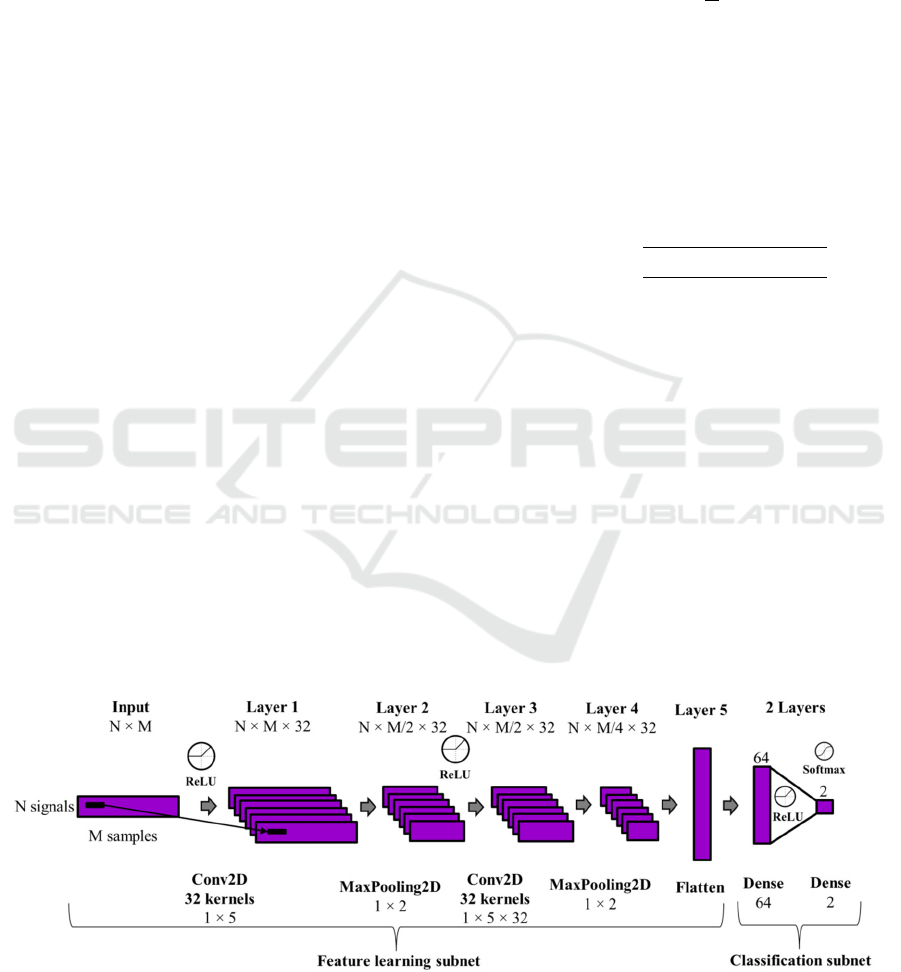
utilized in this study for modelling and classifying
analysis windows as either belonging to a healthy
person or a PD patient.
As depicted in the figure, the inputs of the CNN
are structured in a 2D matrix with dimensions N x
M. N represented the number of input signals, which
is 3 when utilizing a single sensor (X, Y, and Z
signals) or 15 when incorporating all five sensors
available in the dataset (3 x 5). M denotes the
number of analysed samples from each sensor
signal, depending on the signal domain in each
experiment. When using raw data as input, M is
equal to the size of the analysis window (100).
However, in the frequency domain, M represents the
number of FFT coefficients obtained from each
window, equating to half the window size (50).
3.4 Evaluation Methodology
In this work, a specific data distribution has been
used to create the most realistic scenario for a PD
detection system: the Leave-One-Subject-Out
(LOSO) Cross Validation (CV) strategy.
This strategy is a specific type of K-fold CV
where the system is evaluated with the data from one
subject and is trained with the data from the rest of
the K-1 subjects. In this case, the process is repeated
several times leaving a different subject for testing
and the results are also the average of the partial
results obtained for all repetitions.
This strategy avoids using recordings from the
same subjects in both training and testing subsets,
which pursues a more realistic scenario where a new
unseen patient’s data will be modelled without using
data from that subject. LOSO CV allows
generalizing to new, unseen subjects, while
capturing a wide variability of tremor motions from
the training subjects.
As evaluation metric, we used accuracy, which
defines the ratio between the number of correctly
classified examples and the number of total
examples. This way, for a classification problem
with N testing examples and C classes, accuracy is
defined in Equation (1).
Accurac
y
1
N
P
(1)
In addition, we used confidence intervals, which
include plausible values for a specific metric, to
show assure a significant difference between results
of two experiments (when their confidence intervals
do not overlap). Equation (2) represents the
computation of confidence intervals attached to a
specific metric value and N samples when the
confidence level is 95%.
CI
95%
1.96
metric 100 metric
N
(2)
In this study, we characterized PD tremor at the
window level, as the input examples for the deep
neural architecture were based on windows.
Nonetheless, we also presented performance at the
user level, where the prediction for an individual
was determined by the mode of predictions across
all the windows associated with that subject. This
methodology enables the incorporation of
information from all windows into a unified
prediction, offering a more holistic perspective from
a medical standpoint. Such an approach facilitates
the identification of overarching health patterns
instead of solely concentrating on the existence or
non-existence of tremors during short time intervals,
thereby mitigating the potential for incomplete or
inaccurate assessments.
Figure 2: Convolutional Neural Network Architecture for PD detection where N denotes the number of input signals (3 or
15) and M denotes the number of samples for each analysis window or example (100 or 50).
Parkinson’s Disease Detection Through Inertial Signals and Posture Insights
1147

4 RESULTS AND DISCUSSION
This section contains details about the experiments
performed in this work, including results and
discussion about the posture performed, the required
time for testing a subject and the possibility of
training and testing the system using recordings
from different postures.
4.1 Posture Insights
Regarding the posture insights, we decided to
evaluate the PD detection performance of the system
when using Lying and Sitting activities windows and
different sensors separately. Moreover, we analysed
the effect of the signal domain (Raw or FFT) over
this detection. Figure 3 shows a comparison of
performance at window-level when using 15
minutes per subject for different input signal
domains, performed activity, and sensor(s).
We observed a significant increment of
performance when using signals in the frequency
domain for most of the sensors when using each of
the activities. An increase in visibility of PD tremor
may be attributed to its intensified presence in the
frequency domain. Information regarding the energy
associated with the tremor frequency (between 3–9
Hz (Deuschl, Fietzek, Klebe, & Volkmann, 2003;
M. Gil-Martin et al., 2019)) and its harmonics can be
observed in the spectrum of the X, Y, and Z signals
recorded by the inertial sensor. Consequently, using
a CNN with FFT magnitude coefficients as inputs
has proven to achieve superior results when
compared to employing raw data samples directly.
Comparing the activities performed while
recording the data, we observed an increment of
performance when using sitting windows compared
to using lying windows for both input signal
domains (employing the same amount of data, i.e. 15
minutes per subject for these experiments). Sitting
activity emerges as a potentially more helpful setting
for detecting PD tremor using inertial sensors. This
may be attributed to the muscle engagement
necessary for maintaining an upright sitting position,
making tremors more pronounced, compared to a
relaxed lying posture. Furthermore, the sitting
posture offers a consistent and distinctive structure
across various subjects. Individuals tend to sustain
relatively fixed sitting positions, ensuring a uniform
and easily recognizable posture. In contrast, lying
down introduces, especially during sleeping,
postural changes, leading to significant alterations in
the representations along the x, y, and z axes of
inertial sensors. The standardization of sitting
posture stands in contrast to the variability in lying
posture, where alterations in body orientation during
sleep could hinder the maintenance of consistent
sensor data representations. When using 15 minutes
per subject, we obtained a maximum performance of
73.92 ± 0.65 % employing the FFT of sitting activity
and all the sensors, compared to 60.39 ± 0.73 %
when using the lying activity in the same setup.
Moreover, the exploration of isolated sensors,
both in the upper and lower limbs, presents a
promising avenue for the creation of biomarkers
associated with tremors manifesting in distinct parts
of the body. This nuanced analysis allows for a more
granular understanding of the tremor patterns
specific to each limb, potentially leading to the
development of targeted biomarkers. Such
biomarkers could offer valuable insights into the
severity and characteristics of tremors across
different body regions, as the Unified Parkinson's
Disease Rating Scale (UPDRS) assessment. Figure 3
also informs that chest sensor is the most
informative location to detect PD but the rest sensors
also achieve reasonable performance for the
classification task. However, since we obtained
better performance with all the sensors, we decided
to use all of them for the rest of experiments of this
study.
Figure 3: Accuracy at window-level using 15 minutes per
subject depending on the input signal domain, the activity
performed while recording the tremor and the sensor(s)
used.
4.2 Required Time for Testing a
Subject
Concerning the test time used from each subject to
build a proper PD detection biomarker, we decided
to analyse how much we could reduce the test time
used from each subject without losing significant
performance. We analysed 1, 5, 10, and 15 minutes
from each subject for testing the system. We kept
the 15 minutes per subject for training the system
ICAART 2024 - 16th International Conference on Agents and Artificial Intelligence
1148
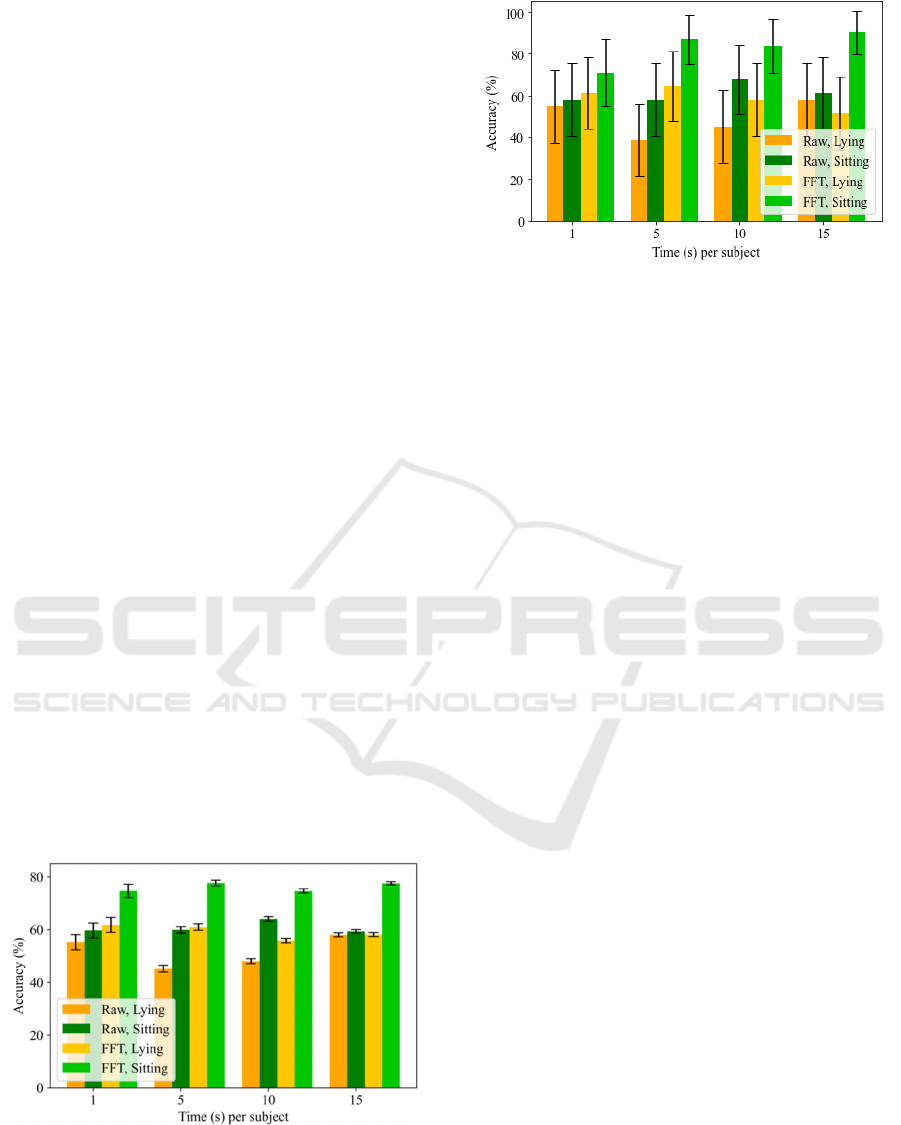
(which corresponds to 465 minutes considering the
remaining 31 subjects).
Figure 4 shows a comparison of performance at
window-level when using 15 minutes per subject for
training for different input signal domains and
activity performed during recording when evaluating
unseen subjects using different amount of data (1, 5,
10 and 15 minutes). Figure 5 shows the same
comparison of performance at user-level. These
figures show that using 5 minutes from each subject
at testing stage would be enough to properly assess
unseen subjects’ PD status (accuracies of 77.71 ±
1.07 % at window-level and 87.10 ± 11.80 % at
user-level using the FFT while sitting). Despite of
the fact that assessing 1 minute could be sufficient
(accuracies of 74.72 ± 2.52 % at window-level and
70.97 ± 15.98 % at user-level using the FFT while
sitting) since there is no significant difference
between both results, using 5 minutes could offer a
more robust solution since 1 minute could be a short
interval during a patient could not manifest a PD
tremor.
Clinical visits intended to assess the progression
of PD are often constrained by their brevity, making
it challenging to draw conclusive and accurate
insights into PD detection. Contrary to this common
limitation, the findings presented in this paper
underscore a notable advance: 5 minutes of
recording proves sufficient for achieving a robust
PD detection. The results indicate that extending the
recording time from a new subject beyond this
threshold does not yield discernible improvements in
classification performance. This revelation
challenges the conventional notion of requiring long
recording periods, emphasizing the capability of a
concise data collection approach for accurate PD
detection.
Figure 4: Accuracy at window-level using 15 minutes per
subject for training depending on the input signal domain,
the activity performed and the time per subject used for
testing.
Figure 5: Accuracy at user-level using 15 minutes per
subject for training depending on the input signal domain,
the activity performed and the time per subject used for
testing.
4.3 Transfer Knowledge Between
Postures
In the pursuit of refining the robustness and
generalizability of a PD detection system, this work
also explored the idea of training the system with
data collected in a lying posture and subsequently
testing it with recordings from a sitting posture, and
vice versa. This way, we could inspect the capacity
of generalization across distinct postures by
knowledge transferring between lying and sitting
postures.
Figure 6 shows a comparison of performance
when using lying and sitting activities to train the
system (X axis) and to evaluate it (legend). In these
experiments, 15 minutes per subject were used for
training and 5 minutes per subject were used for
testing. In this figure, the columns of the same
colours are directly comparable because the testing
data are exactly the same. As a general comment, we
can say that there is not huge degradation in
performance. That means that the tremor appears in
the limbs involuntarily in different positions, but
there are significant differences. This way, we could
observe that when training a system with lying and
testing with sitting (green columns of left bars) the
performance drops compared to the scenario of also
training with sitting data (green columns of right
bars) for both input signal domains. This aspect
reflects that lying activity does not incorporate
sufficient information to generalize to sitting
instances. However, training a system with sitting
and testing with lying (yellow columns of right bars)
the performance remains similar compared to the
scenario of also training with lying data (yellow
columns of left bars). This aspect reveals that sitting
activity incorporates valuable information to
generalize to lying instances.
Parkinson’s Disease Detection Through Inertial Signals and Posture Insights
1149
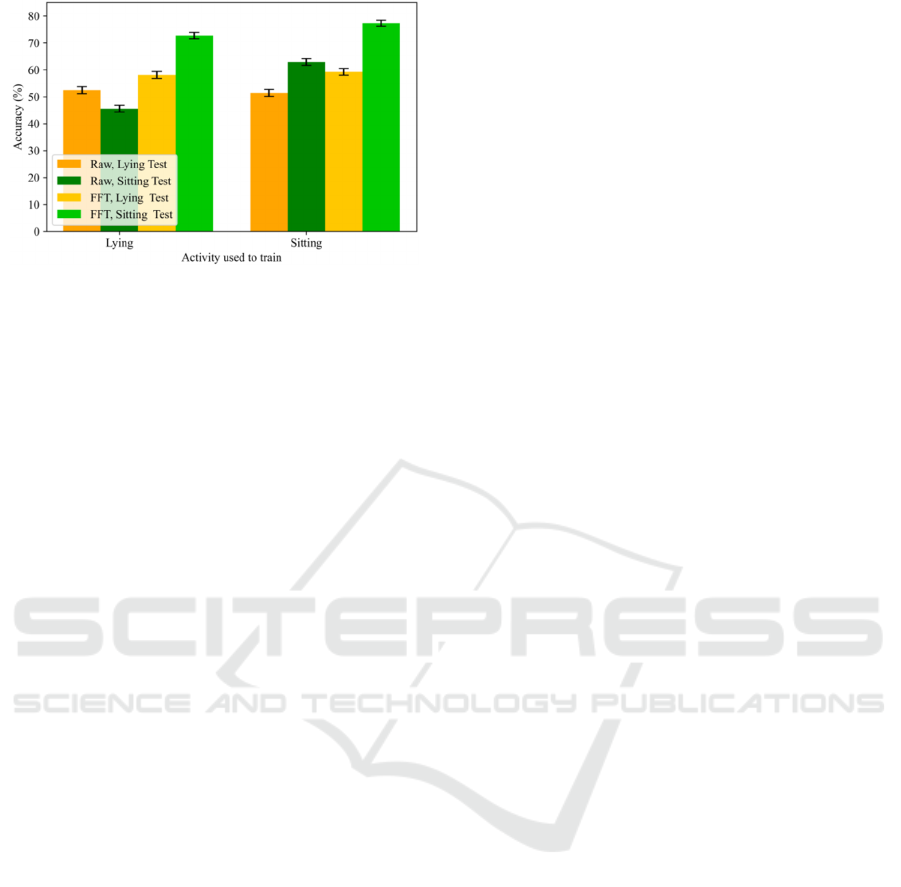
Figure 6: Accuracy at window-level using 15 minutes per
subject for training and 5 minutes per subject for testing
depending on the input signal domain, the activities
performed during training (X axis) and testing (legend).
5 CONCLUSIONS
A broad data analysis in realistic scenarios is
necessary when detecting PD through a deep
learning system using inertial sensors to highlight
key factors to the refinement of tremor detection.
This work uses the PD-BioStampRC21 dataset
including healthy control and PD participants
wearing five inertial sensors to make an exhaustive
study concerning the posture performed during the
data collection.
Ensuring an appropriate distribution of data is
crucial in PD detection to prevent data overlap
between training and testing subsets and create
systems that could generalize to unseen subjects.
The LOSO CV technique emerges as a robust
solution, achieving model generalizability.
Sitting activity becomes a crucial recording
setting for detecting PD tremor using inertial
sensors. The standardization of sitting activity
among different subjects compared to lying activity,
especially during sleeping, could benefit the tremor
detection for unseen subjects. The proposed system
obtained an accuracy of 73.92 ± 0.65 % when using
15 minutes per subject from all sensors and the FFT
of sitting activity compared to 60.39 ± 0.73 % when
using lying activity.
Concerning the required amount of data from a
testing subject, we observed that using 5 minutes
while sitting could be sufficient to provide a robust
solution. This way, it is not necessary to record a
large amount of data from a patient to properly
assess his PD status.
When training a system with lying and testing
with sitting, there is a significant decrease in
performance compared to training and testing with
sitting data. This suggests that lying activity lacks
sufficient information to generalize to sitting
instances. However, when training with sitting and
testing with lying, the performance remains similar
to the scenario of training with lying data. This
indicates that sitting activity contains valuable
information that allows for effective generalization
to lying instances.
As future work, there is potential for further
refinement in the data analysis. More specifically,
enhancing the selection of windows characterized by
high energy levels could prove helpful in identifying
examples where tremors are more noticeable,
thereby enhancing the overall performance of PD
detection. Moreover, the creation of a regression
system capable of precisely estimating UPDRS
scores could provide valuable insights into the
disease progression. The incorporation of these
aspects could contribute to the development of more
effective diagnostic and monitoring tools for PD.
Regarding the limitations of this study, it is
relevant to remark that the PD detection proposed is
based on motion symptoms. Although these
symptoms appear in many patients, they do not
appear with the same intensity. The system proposed
can be completed with other AI-based system
extracting information from other signals like EEG.
ACKNOWLEDGEMENTS
The work was supported by the project “TremorDetect -
Detección de la enfermedad de Parkinson a través de
señales inerciales”, funded by “Primeros Proyectos” call
from ETSIT, UPM, by projects AMIC-PoC (PDC2021-
120846-C42), GOMINOLA (PID2020-118112RB-C21
and PID2020-118112RB-C22) and BeWord (PID2021-
126061OB-C43), supported by the Spanish Ministry of
Science and Innovation (MCIN/AEI/10.13039/
501100011033) and by the European Union
“NextGenerationEU/PRTR”, and ASTOUND (101071191
HORIZON-EIC-2021-PATHFINDERCHALLENGES-01)
funded by the European Commission.
REFERENCES
Adams, J. L., Dinesh, K., Snyder, C. W., Xiong, M.,
Tarolli, C. G., Sharma, S., . . . Sharma, G. (2021). A
real-world study of wearable sensors in Parkinson’s
disease. npj Parkinson's Disease, 7(1), 106.
doi:10.1038/s41531-021-00248-w
Adams, J. L., Dinesh, K., Xiong, M., Tarolli, C. G.,
Sharma, S., Sheth, N., . . . Sharma, G. (2017). Multiple
Wearable Sensors in Parkinson and Huntington
ICAART 2024 - 16th International Conference on Agents and Artificial Intelligence
1150

Disease Individuals: A Pilot Study in Clinic and at
Home. Digital biomarkers, 1(1), 52-63.
doi:10.1159/000479018
Channa, A., Ifrim, R.-C., Popescu, D., & Popescu, N.
(2021). A-WEAR Bracelet for Detection of Hand
Tremor and Bradykinesia in Parkinson's Patients.
Sensors, 21(3). doi:10.3390/s21030981
Cole, B. T., Roy, S. H., De Luca, C. J., Nawab, S. H., &
Ieee. (2010, 2010
Aug 30-Sep 04). Dynamic Neural Network Detection of
Tremor and Dyskinesia from Wearable Sensor Data.
Paper presented at the 32nd Annual International
Conference of the IEEE Engineering-in-Medicine-and-
Biology-Society (EMBC 10), Buenos Aires,
ARGENTINA.
Dai, H., Zhang, P., & Lueth, T. C. (2015). Quantitative
Assessment of Parkinsonian Tremor Based on an
Inertial Measurement Unit. Sensors, 15(10), 25055-
25071. doi:10.3390/s151025055
Deuschl, G., Fietzek, U., Klebe, S., & Volkmann, J.
(2003). Chapter 24 Clinical neurophysiology and
pathophysiology of Parkinsonian tremor. In M. Hallett
(Ed.), Handbook of Clinical Neurophysiology (Vol. 1,
pp. 377-396): Elsevier.
Garcia-Magarino, I., Medrano, C., Plaza, I., & Olivan, B.
(2016). A smartphone-based system for detecting hand
tremors in unconstrained environments. Personal and
Ubiquitous Computing, 20(6), 959-971. doi:10.
1007/s00779-016-0956-2
Gil-Martin, M., Montero, J. M., & San-Segundo, R.
(2019). Parkinson's Disease Detection from Drawing
Movements Using Convolutional Neural Networks.
Electronics, 8(8), 10. doi:10.3390/electronics8080907
Gil-Martin, M., San-Segundo, R., Fernandez-Martinez, F.,
& Ferreiros-Lopez, J. (2020). Improving physical
activity recognition using a new deep learning
architecture and post-processing techniques.
Engineering Applications of Artificial Intelligence, 92.
doi:10.1016/j.engappai.2020.103679
Gil-Martin, M., San-Segundo, R., Fernandez-Martinez, F.,
& Ferreiros-Lopez, J. (2021). Time Analysis in
Human Activity Recognition. Neural Processing
Letters. doi:10.1007/s11063-021-10611-w
Gil-Martín, M., San-Segundo, R., Fernández-Martínez, F.,
& de Córdoba, R. (2020). Human activity recognition
adapted to the type of movement. Computers &
Electrical Engineering, 88, 106822. doi:https://doi.
org/10.1016/j.compeleceng.2020.106822
Hathaliya, J. J., Modi, H., Gupta, R., Tanwar, S., Sharma,
P., & Sharma, R. (2022). Parkinson and essential
tremor classification to identify the patient?s risk
based on tremor severity. Computers & Electrical
Engineering, 101. doi:10.1016/j.compeleceng.
2022.107946
Jankovic, J. (2008). Parkinson’s disease: clinical features
and diagnosis. Journal of Neurology, Neurosurgery &
Psychiatry, 79(4), 368-376. doi:10.1136/jnnp.
2007.131045
José, L. C.-V. a. G. E. S. (1995). Effects of parkinsonism
on motor control. Life Sciences, 58(3), 165-176.
doi:https://doi.org/10.1016/0024-3205(95)02237-6
Lang, M., Pfister, F. M. J., Frohner, J., Abedinpour, K.,
Pichler, D., Fietzek, U., . . . Hirche, S. (2019). A
Multi-Layer Gaussian Process for Motor Symptom
Estimation in People With Parkinson's Disease. Ieee
Transactions on Biomedical Engineering, 66(11),
3038-3049. doi:10.1109/tbme.2019.2900002
Portugal, B., Artaud, F., Degaey, I., Roze, E., Fournier, A.,
Severi, G., . . . Elbaz, A. (2023). Association of
Physical Activity and Parkinson Disease in Women.
Long-term Follow-up of the E3N Cohort Study,
101(4), e386-e398. doi:10.1212/wnl.00000000002074
24
Rigas, G., Tzallas, A. T., Tsipouras, M. G., Bougia, P.,
Tripoliti, E. E., Baga, D., . . . Konitsiotis, S. (2012).
Assessment of Tremor Activity in the Parkinson's
Disease Using a Set of Wearable Sensors. Ieee
Transactions on Information Technology in
Biomedicine, 16(3), 478-487. doi:10.1109/titb.2011.
2182616
San-Segundo, R., Manuel Montero, J., Barra-Chicote, R.,
Fernandez, F., & Manuel Pardo, J. (2016). Feature
extraction from smartphone inertial signals for human
activity segmentation. Signal Processing, 120, 359-
372. doi:10.1016/j.sigpro.2015.09.029
San-Segundo, R., Navarro-Hellin, H., Torres-Sanchez, R.,
Hodgins, J., & De la Torre, F. (2019). Increasing
Robustness in the Detection of Freezing of Gait in
Parkinson's Disease. Electronics, 8(2). doi:10.
3390/electronics8020119
Vanrell, S. R., Milone, D. H., & Rufiner, H. L. (2018).
Assessment of Homomorphic Analysis for Human
Activity Recognition From Acceleration Signals. Ieee
Journal of Biomedical and Health Informatics, 22(4),
1001-1010. doi:10.1109/jbhi.2017.2722870
Zhang, S., Wei, Z., Nie, J., Huang, L., Wang, S., & Li, Z.
(2017). A Review on Human Activity Recognition
Using Vision-Based Method. Journal of Healthcare
Engineering, 2017. doi:10.1155/2017/3090343
Parkinson’s Disease Detection Through Inertial Signals and Posture Insights
1151
