
Sample Size Estimation of Transfer Learning for Colorectal Cancer
Detection
Ruihao Luo
1,2 a
, Shuxia Guo
1,2 b
and Thomas Bocklitz
1,2,3 c
1
Leibniz Institute of Photonic Technology, Albert-Einstein-Straße 9, 07745 Jena, Germany
2
Institute of Physical Chemistry and Abbe Center of Photonics, Friedrich-Schiller-Universität Jena,
Helmholtzweg 4, 07743 Jena, Germany
3
Institute of Computer Science, Faculty of Mathematics, Physics & Computer Science, Universität Bayreuth,
Universitätsstraße 30, 95447 Bayreuth, Germany
Keywords: Transfer Learning, Sample Size Estimation, Colorectal Cancer.
Abstract: Nowadays, deep learning has been widely implemented into biomedical applications, but it is problematic to
acquire large annotated medical datasets to train the models. As a technique for reusing knowledge obtained
from one domain in another domain, transfer learning can be used with only small datasets. Despite of some
current research about model transfer methods for medical images, it is still unclear how sample size
influences the model performance. Therefore, this study focuses on the estimation of required sample size for
a satisfactory performance, and also compares transfer methods with only 200 images randomly chosen from
a colorectal cancer dataset. Firstly, based on a K-fold cross-validation, the balanced accuracies of 3 transfer
learning networks (DenseNet121, InceptionV3 and MobileNetV2) were generated, and each network used 3
model transfer methods, respectively. Afterwards, by curve fitting with inverse power law, their learning
curves were plotted. Furthermore, the estimation of required sample size as well as the prediction of final
performance were calculated for each model. In addition, to investigate how many images are needed for
curve fitting, the maximum number of images also changed from 200 to smaller numbers. As a result, it is
shown that there is a trade-off between predicted final performance and estimated sample size, and suggested
model transfer methods for large datasets do not automatically apply to small datasets. For small datasets,
complicated networks are not recommended despite of high final performance, and simple transfer learning
methods are more feasible for biomedical applications.
1 INTRODUCTION
As a popular machine learning technique, deep
learning has been widely applied into the field of
biomedical research (Lecun et al., 2015). For
example, Cheung et al. developed a deep learning
model for Alzheimer’s disease detection (Cheung et
al., 2022); Foersch et al. used deep learning for
colorectal cancer therapy (Foersch et al., 2023);
Placido et al. predicted pancreatic cancer by deep
learning (Placido et al., 2023); Narayan et al. built up
an Enhance-Net to boost performance on real-time
medical images (Narayan et al., 2023); Wang et al.
created a deep learning toolkit called PyMIC for
a
https://orcid.org/0000-0002-8291-4927
b
https://orcid.org/0000-0001-8237-8936
c
https://orcid.org/0000-0003-2778-6624
annotation-efficient medical image segmentation
(Wang et al., 2023).
However, it is practically difficult to obtain large
amounts of annotated medical data to train deep
learning models due to legal restrictions, ethical
reasons and workload. Therefore, the model
performance is limited (Rajpurkar et al., 2022).
Because of the ability of reusing knowledge from
different domains, transfer learning has prevailed in
this area (Zhuang et al., 2021). In the recent study of
Luo and Bocklitz, different model transfer methods
were compared on a colorectal cancer dataset, and
some of them demonstrated satisfactory performance
(Luo & Bocklitz, 2023). For instance, using pre-
Luo, R., Guo, S. and Bocklitz, T.
Sample Size Estimation of Transfer Learning for Colorectal Cancer Detection.
DOI: 10.5220/0012449500003654
Paper published under CC license (CC BY-NC-ND 4.0)
In Proceedings of the 13th International Conference on Pattern Recognition Applications and Methods (ICPRAM 2024), pages 841-851
ISBN: 978-989-758-684-2; ISSN: 2184-4313
Proceedings Copyright © 2024 by SCITEPRESS – Science and Technology Publications, Lda.
841
trained transfer learning networks with added
convolutional layers could achieve validation
accuracies above 0.95 on a dataset with more than
9,000 images regardless of computational
complexity. Besides, Soekhoe and Putten revealed
that dataset size influences classification accuracy of
transfer learning with general images (Soekhoe &
Putten, 2016); Samala et al. studied the effects of
training sample size on multi-stage transfer learning
for digital breast tomosynthesis (Samala et al., 2019);
Zhu et al. investigated from plastics manufacturing
images that training sample size could influence
classification performance for transfer learning
models (Zhu et al., 2021).
Despite of current research about classification
models as well as model transfer methods for
biomedical images, how sample size influences the
model performance remains to be investigated
further. So, this study focuses on the estimation of
required sample size for an acceptable performance,
and also compares model transfer methods with only
200 limited images randomly chosen from a
colorectal cancer dataset (Kather et al., 2019).
2 TRANSFER LEARNING FOR
BIOMEDICAL IMAGES
Although data scarcity poses a real threat in the field
of biomedicine, transfer learning models have already
showed the efficacy by reusing the knowledge gained
from other domains (Kim et al., 2022). Based on the
research of Yu et al., transfer learning models are
already applied for biomedical image analysis of
brain, lung, breast cancer, kidney diseases as well as
other diseases (Yu et al., 2022). And these transfer
learning models mostly reuse the knowledge obtained
from ImageNet, which is a large-scale visual database
containing more than 14 million images
(Russakovsky et al., 2015).
In this study, 3 transfer learning base models were
chosen based on their popularity (Morid et al., 2021):
DenseNet121 (Huang et al., 2017), InceptionV3
(Szegedy et al., 2016) and MobileNetV2 (Sandler et
al., 2018). DenseNet121 has a 7*7 convolutional
layer, 58 3*3 convolutional layers, 61 1*1
convolutional layers, 4 average pooling layers and a
fully-connected layer at the end. InceptionV3 is made
up of 42 layers, which contains 3 inception modules,
6 convolutional layers as well as final pooling and
fully-connected layers. MobileNetV2 consists of the
initial fully convolution layer with 32 filters, followed
by 19 inverted residual bottleneck layers. There are
different options of model transfer methods for these
transfer learning models, and it has been studied that
adding convolutional layers (‘add’) outperforms
simply using the original networks (‘ori’) or fine-
tuning some last layers (‘ft’) (Luo & Bocklitz, 2023).
However, this study was only conducted with enough
images, the model performance still needs to be
checked with very limited images.
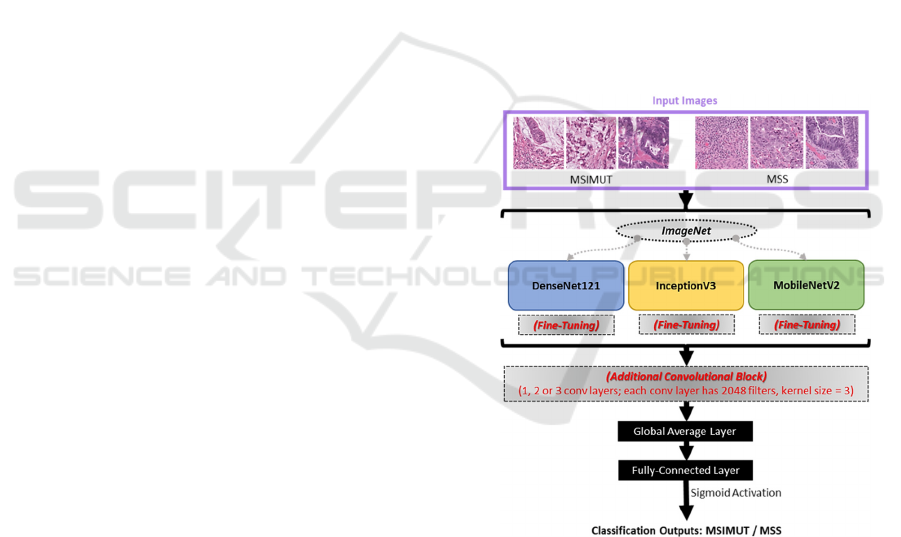
Therefore, with maximal sample size of 200,
containing both microsatellite unstable or
hypermutated (MSIMUT) and microsatellite stable
(MSS) images randomly selected with equal amounts
(Kather et al., 2019), 3 model transfer methods (‘ori’,
‘ft’ and ‘add’) as well as 3 base models
(DenseNet121, InceptionV3 and MobileNetV2) were
analysed in this study without data augmentation.
Notably, ‘ft1’, ‘ft2’ and ‘ft3’ refer to fine-tuning the
last 1, 2 or 3 convolutional layers, respectively;
likewise, ‘add1’, ‘add2’, ‘add3’ refer to adding 1, 2,
or 3 convolutional layers at the end, but before the
SoftMax layer, respectively. The study workflow is
shown in Figure 1.
Figure 1: Transfer learning model architectures.
3 LEARNING CURVE
GENERATION BASED ON
K-FOLD CROSS VALIDATION
By separating a dataset into a training part and a
validation part, K-fold cross-validation is commonly
used as a method against over-fitting or under-fitting,
and it can also be implemented to evaluate the model
ICPRAM 2024 - 13th International Conference on Pattern Recognition Applications and Methods
842
generalisation ability (Kohavi, 1995). In this study,
firstly image subsets were generated by randomly
sampling from a colorectal cancer dataset.
Afterwards, for each image subset (sample), it was
sent to an external K-fold cross-validation loop.
Inside the loop, the training part was used for model
training, and the validation part was used for model
validation. Finally, the model performance was
evaluated based on validation balanced accuracies.
In machine learning, a usual method to assess
classification performance as a function of sample
size is to build empirical scaling models called
learning curves (Cortes et al., 1994). Thus, with
sample sizes varying from 20 to 200, a learning curve
for each trained model was generated in this study.
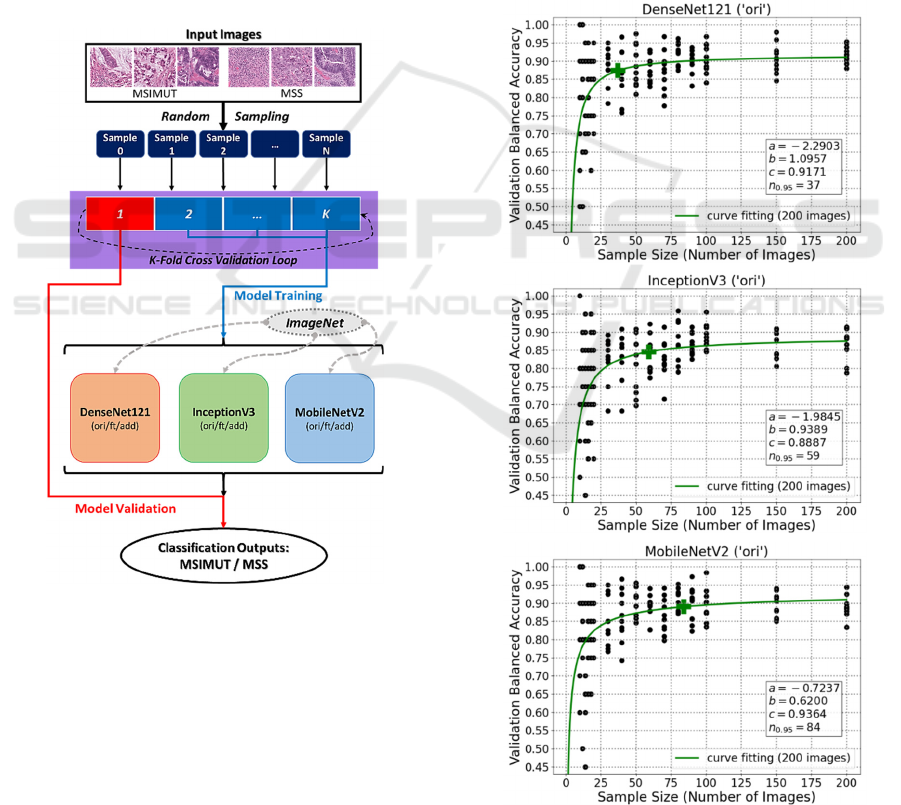
The overall dataflow of learning curve generation
based on K-fold cross-validation is demonstrated in
Figure 2.
Figure 2: Overall dataflow based on K-fold cross-
validation.
4 LEARNING CURVE FITTING
USING INVERSE POWER LAW
For a given classification problem, fitted learning
curves can be utilised for selecting models, predicting
the effectiveness of using more data, as well as
reducing computational complexity. Although there
exist various parametric forms to fit learning curves,
recent studies have shown that most deep neural
networks have power law behaviour with solid
empirical evidence (Viering & Loog, 2023).
Therefore, similar as some previous studies
(Mukherjee et al., 2003; Ali et al., 2018), the inverse
power law was applied to this study:
𝐼𝑃
𝑛
𝑎𝑛
𝑐
(1)
where 𝑎∈
∞, ∞
, 𝑏∈
∞, ∞
and 𝑐∈
0, 1. In this equation, c represents the estimated
final performance; and 𝑛
.
means the number of
images needed to reach 95%c, which is the estimated
sample size. Besides, the trust region reflective
algorithm was chosen for optimisation (Voglis &
Lagaris, 2004). During the optimisation process, a, b
and c initial values all set to 1.
Figure 3: Curve fitting plots for original DenseNet121,
InceptionV3 and MobileNetV2.
Sample Size Estimation of Transfer Learning for Colorectal Cancer Detection
843
As illustrated in Figure 3, the fitted learning curves
of simply using original networks (‘ori’) are plotted for
DenseNet121, InceptionV3 and MobileNetV2,
respectively. It can be found that for DenseNet121
(‘ori’), the estimated final validation balanced accuracy
(c) is 0.9171, and 37 images are needed to reach 95%
of this performance (𝑛
.
). Besides, for InceptionV3
(‘ori’) and MobileNetV2 (‘ori’), their c values are
0.8887 and 0.9364, respectively; and their 𝑛
.
values
are 59 and 84, respectively. The plots show that simply
using the original networks can have an acceptable
performance when there are only limited data.
5 EXPERIMENT RESULTS WITH
DIFFERENT MODEL
TRANSFER METHODS
To investigate how other model transfer methods
perform with limited available data, the curve fitting
experiments were also conducted based on ‘ft’ and
‘add’ methods. Their results are introduced in the
following.
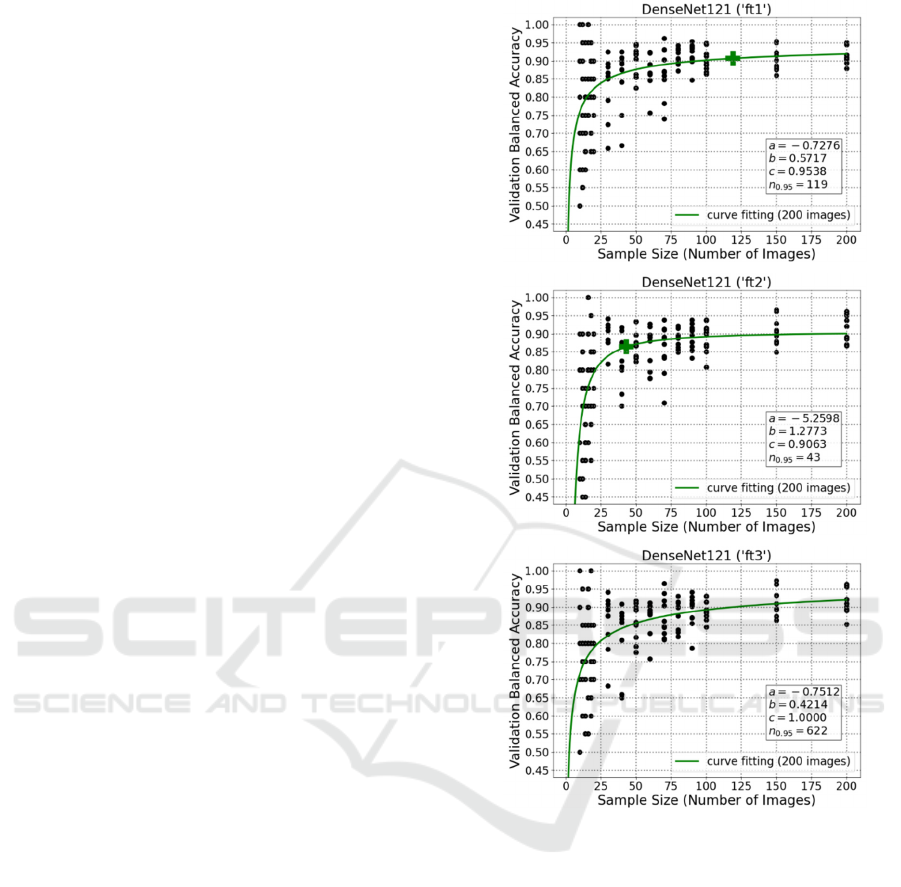
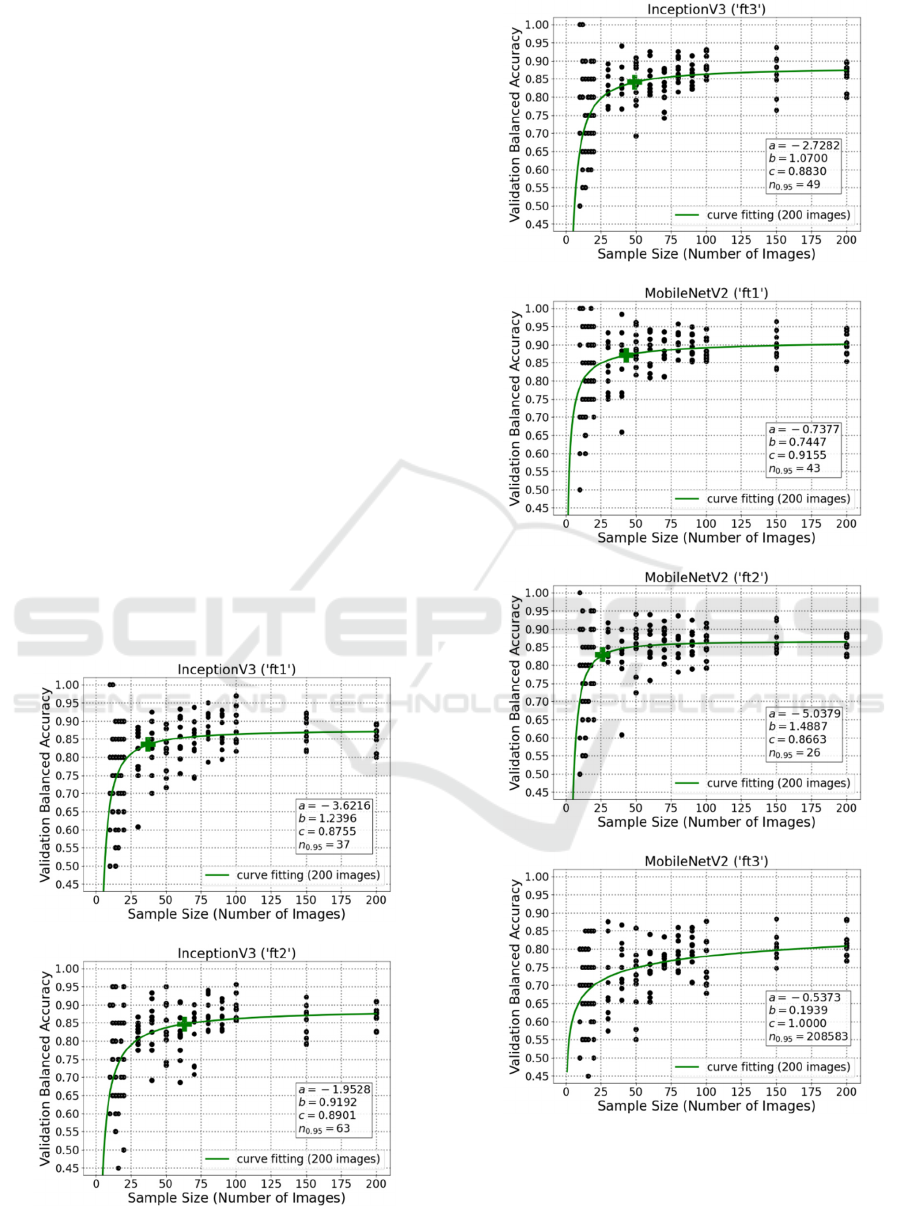
5.1 Results Using Fine-Tuning
Firstly, the methods of fine-tuning 1 (‘ft1’), 2 (‘ft2’)
or 3 (‘ft3’) last layers at the end of network were
applied. These results for DenseNet121 are illustrated
in Figure 4. And these plots for InceptionV3 and
MobileNetV2 are attached in the appendix section.
As demonstrated in the plots, DenseNet121 (‘ft1’)
has a prediction of final performance with 0.9538
validation balanced accuracy; and it needs 119 image
samples to achieve 95% of that accuracy. Besides,
DenseNet121 (‘ft2’) needs 43 images to achieve 95%
of the validation balanced accuracy 0.9063. In
addition, for DenseNet121 (‘ft3’), 622 images are
required for 95% of a perfect predicted final
performance (100%).
It is quite clear that the ‘ft1’ and ‘ft2’ could also
deal well with limited number of images, but it might
be challenging for the more complicated method
‘ft3’. Although ‘ft3’ had high predicted final
performance (even 100%), the required number of
images is beyond the limitation of this study and too
high for a medical pre-study.
5.2 Results Using Additional
Convolutional Layers
Beside the aforementioned fine-tuning experiments,
additional convolutional layers were also added to the
Figure 4: Curve fitting plots for DenseNet121 fine-tuning
the last 1, 2, and 3 layers, respectively.
transfer learning networks for further comparison.
With a kernel size of 3, 2048 filters were contained in
each additional convolutional layer. And for this
study, the numbers of additional convolutional layers
were 1 (‘add1’), 2 (‘add2’) or 3 (‘add3’). Afterwards,
learning curve fitting was also carried out in the same
way as previously introduced for each model. Figure
5 consists of the curve fitting plots for DenseNet121
using ‘add1’, ‘add2’ as well as ‘add3’.
From these plots, it is visible that the predicted
final performance of DenseNet121 (‘add1’) is 0.8871,
while 17 images are necessary to reach its 95%.
Besides, despite DenseNet121 (‘add2’) and
DenseNet121 (‘add3’) apparently have very high
predicted final performance (1 and 0.9759), due to
network complexity, their estimated sample size
ICPRAM 2024 - 13th International Conference on Pattern Recognition Applications and Methods
844
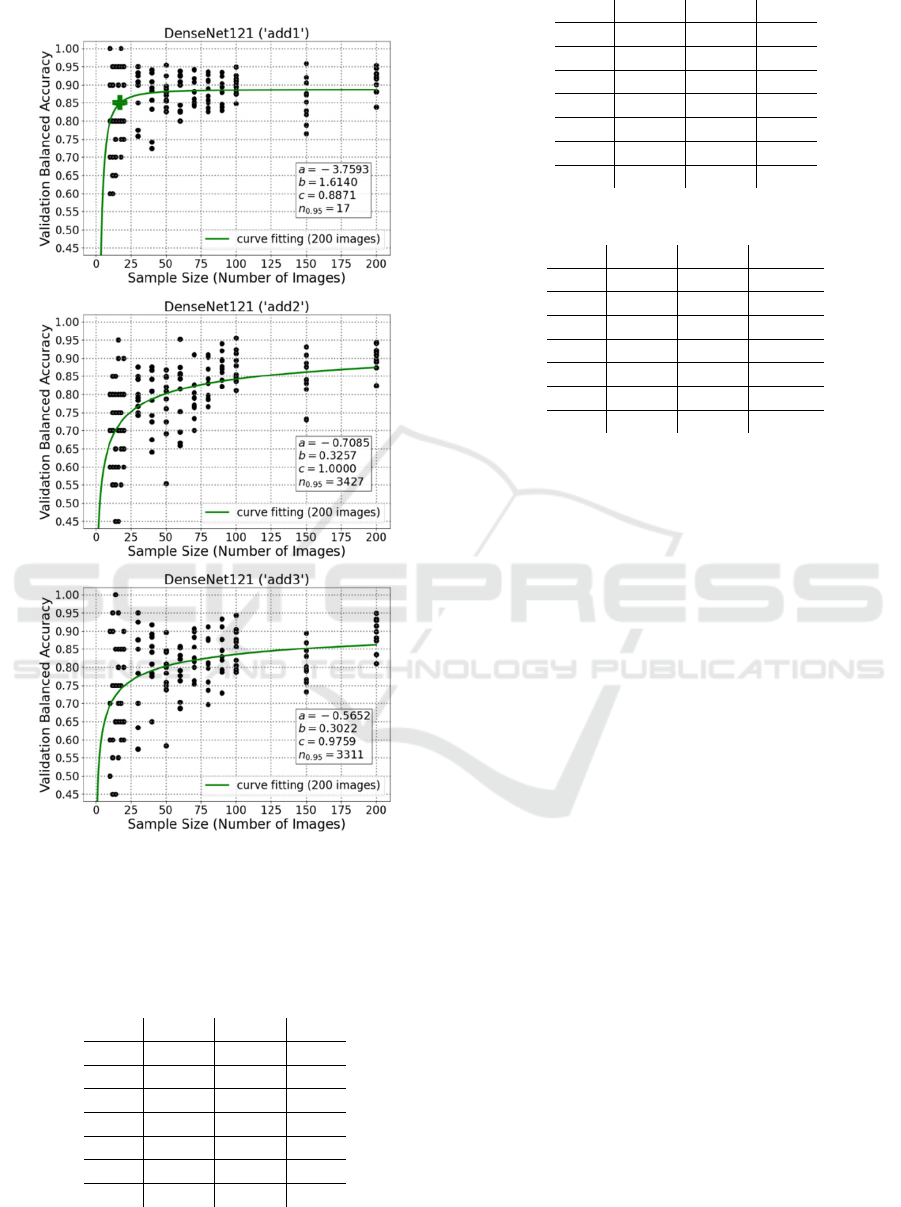
values are both more than 3000, which could be
impractical for plenty of biomedical applications.
Figure 5: Curve fitting plots for DenseNet121 using 1, 2,
and 3 additional convolutional layers, respectively.
5.3 Summary of Learning Curve
Fitting Results
Table 1: Experiment results for DenseNet121.
c 95%c
𝒏
𝟎.𝟗𝟓
ori 0.9171 0.8712 37
ft1 0.9538 0.9061 119
ft2 0.9063 0.8610 43
ft3 1.0000 0.9500 622
add1 0.8871 0.8427 17
add2 1.0000 0.9500 3427
add3 0.9759 0.9271 3311
Table 2: Experiment results for InceptionV3.
c 95%c
𝒏
𝟎.𝟗𝟓
ori 0.8887 0.8443 59
ft1 0.8755 0.8317 37
ft2 0.8901 0.8456 63
ft3 0.8830 0.8389 49
add1 0.8601 0.8171 28
add2 0.8555 0.8127 47
add3 0.8276 0.7862 66
Table 3: Experiment results for MobileNetV2.
c 95%c
𝒏
𝟎.𝟗𝟓
ori 0.9364 0.8896 84
ft1 0.9155 0.8697 43
ft2 0.8633 0.8201 26
ft3 1.0000 0.9500 208583
add1 0.9252 0.8789 75
add2 1.0000 0.9500 13119
add3 1.0000 0.9500 12514
As shown in Tables 1-3, some methods although have
very high performances, e.g. 95% of the c value, but
their 𝑛
.
values are too high to be realistic in small
scale studies. For example, the 95%c values of
DenseNet121 (‘add2’) and MobileNetV2 (‘add3’) are
both 0.95, but their 𝑛
.
values are 3427 and 12514.
On the other hand, some methods just have tolerable
95%c values and their 𝑛
.
values are acceptable for
limited available data: for example, the 95%c values
of DenseNet121 (‘ft1’), InceptionV3 (‘ft2’), and
MobileNetV2 (‘ori’) are 0.9061, 0.8456 and 0.8896,
while their 𝑛
.
values are 37, 63 and 84,
respectively. They outperformed the state-of-art
methods using transfer learning as feature extractor
with PCA-LDA and PCA-SVM (just around 0.50),
‘ori’ (around 0.80) and ‘ft’ (mostly below 0.85) even
with over 9,000 images from the same dataset (Luo &
Bocklitz, 2023).
Therefore, it is found that the model transfer
methods for large datasets do not automatically apply
to small datasets, and there is a trade-off between
predicted final performance (c) and estimated sample
size (𝑛
.
). Besides, despite of possible high final
performance, complicated networks are not
recommended for small datasets, while simple
transfer learning methods are more practical, e.g. ‘ori’
and ‘ft1’ for all 3 networks in Tables 1-3.
6 FITTED CURVE PREDICTION
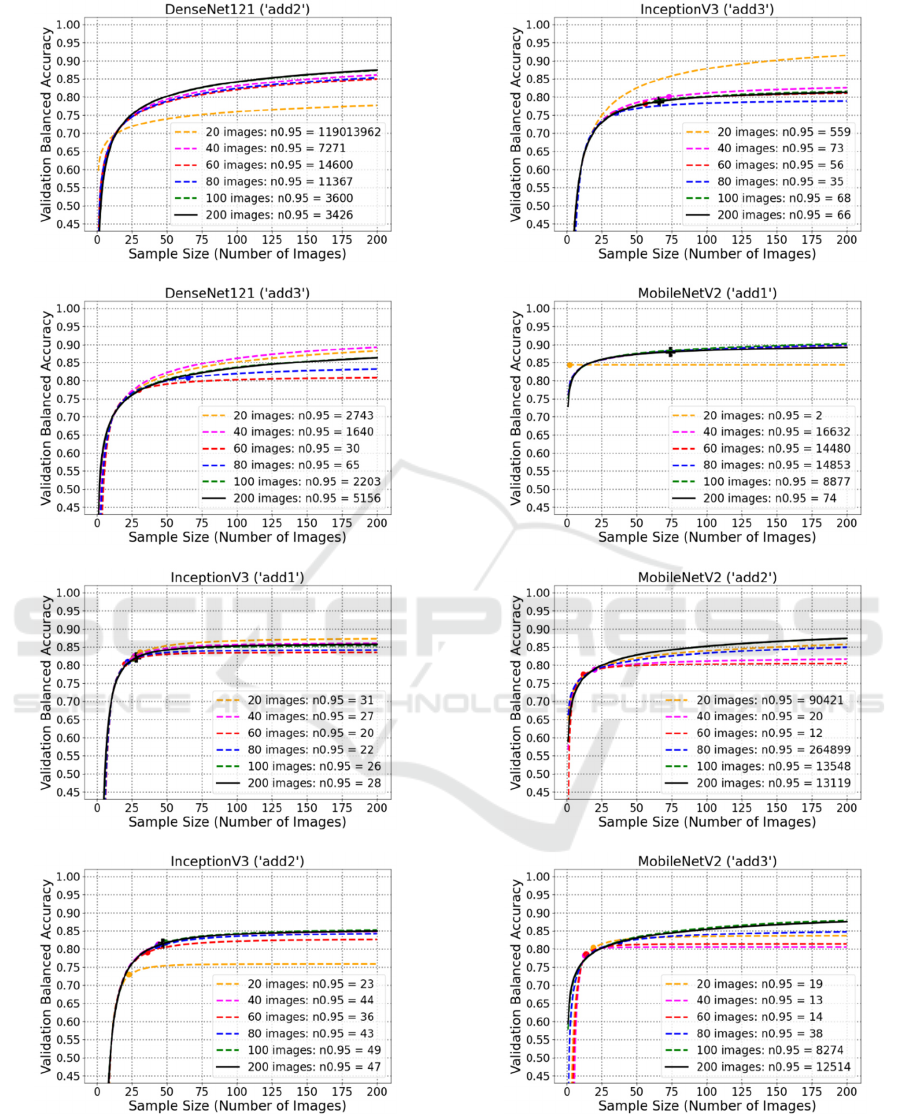
Afterwards, to investigate how many images are
needed for curve fitting, the maximum number of
Sample Size Estimation of Transfer Learning for Colorectal Cancer Detection
845
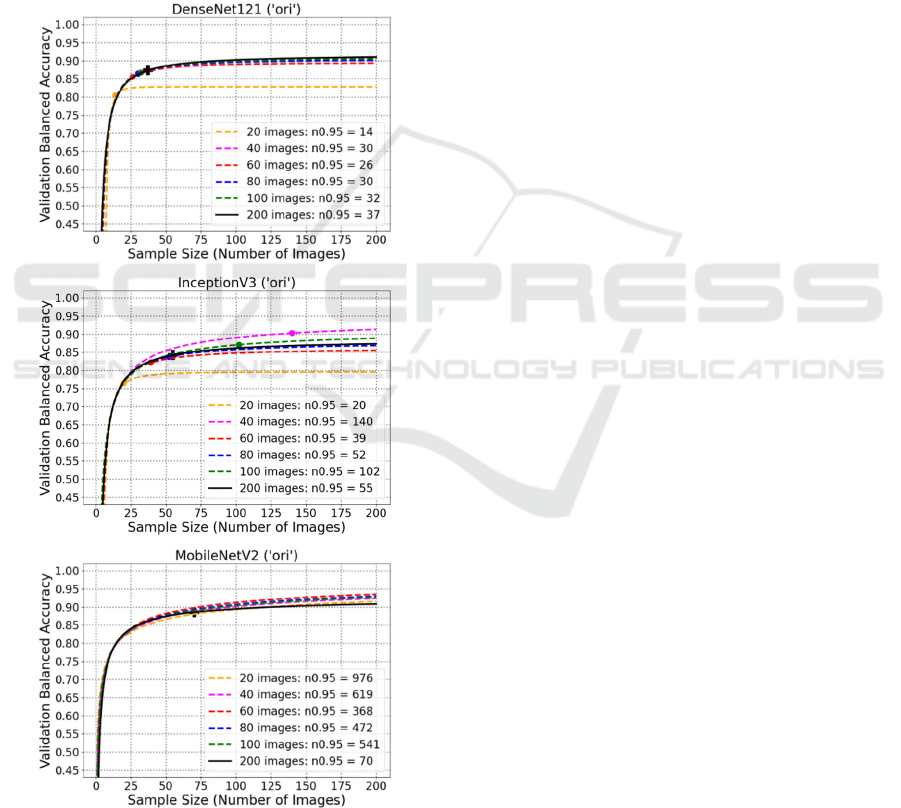
images changed from 200 to smaller numbers: 100,
80, 60, 40 and 20. Figure 6 shows the examples of
fitted curve predictions for DenseNet121 (‘ori’),
InceptionV3 (‘ori’), and MobileNetV2 (‘ori’),
respectively. And the rest plots for ‘ft’ and ‘add’
model transfer methods are in the appendix. As
shown in the plots, very small datasets usually lead to
problematic prediction of learning curve, e.g. 20
images. Besides, at least 80 images are necessary to
obtain an acceptable prediction of learning curve.
Additionally, it can also be found that complicated
networks still are not recommended for small datasets
because of too many required images, e.g. ‘ft3’,
‘add2’, ‘add3’.
Figure 6: Plots of fitted curve prediction for original
DenseNet121, InceptionV3 and MobileNetV2.
7 CONCLUSIONS
With only 200 limited images randomly chosen from
a colorectal cancer dataset, this study conducted the
experiments to estimate required sample sizes for
satisfactory performance. In this study, three deep
learning networks (DenseNet121, InceptionV3 and
MobileNetV2) and different transfer methods (‘ori’,
‘ft’ and ‘add’) were compared by their validation
balanced accuracies, which were generated from an
external K-fold cross-validation loop. With these
accuracies, learning curves were then fitted by
inverse power law to obtain the values for final
prediction performance (c) and the number of
required images to reach of the final performance
95%c ( 𝑛
.
). Based on experiment results, well-
performed model transfer methods for large datasets
cannot be automatically applied to small datasets, and
a trade-off has been found between predicted final
performance (c) and estimated sample size (𝑛
.
).
Besides, complicated networks are not recommended
for small datasets regardless of possible high final
performance, instead simple transfer learning
methods are more feasible for medical applications
with only limited images. Afterwards, by reducing the
maximum number of images, fitted learning curves
were predicted. From these experiments, it is
discovered that very small datasets (e.g. 20 images)
can cause seriously erroneous predictions, and at least
80 images should be contained for an acceptable
prediction of learning curve. Additionally, due to
model complexity and limited available data,
complicated networks (e.g. ‘ft3’, ‘add2’, ‘add3’) also
did not perform desirably for predicting learning
curves.
Future works are planned to be done to further
improve this study. For example, this study procedure
is planned to be implemented to other datasets beyond
colorectal cancer detection for verifying
generalisability. In addition, various data
augmentation techniques will be tested for their
ability to improve model performance, but also for
their effect on the sample size.
ACKNOWLEDGEMENTS
This work is supported by the BMBF, funding
program Photonics Research Germany (13N15466
(LPI-BT1), 13N15710 (LPI-BT3)) and is integrated
into the Leibniz Center for Photonics in Infection
Research (LPI). The LPI initiated by Leibniz-IPHT,
Leibniz-HKI, Friedrich Schiller University Jena and
ICPRAM 2024 - 13th International Conference on Pattern Recognition Applications and Methods
846

Jena University Hospital is part of the BMBF national
roadmap for research infrastructures. Co-funded by
the European Union (ERC, STAIN-IT, 101088997).
Views and opinions expressed are however those of
the author(s) only and do not necessarily reflect those
of the European Union or the European Research
Council. Neither the European Union nor the granting
authority can be held responsible for them.
REFERENCES
Ali, N., Girnus, S., Rösch, P., Popp, J., & Bocklitz, T.
(2018). Sample-size planning for multivariate data: a
Raman-spectroscopy-based example. Analytical
Chemistry, 90(21), 12485-12492. Doi: 10.1021/acs.
analchem.8b02167.
Cheung, C. Y., Ran, A. R., Wang, S., Chan, V. T. T., Sham,
K., Hilal, et al. (2022). A deep learning model for
detection of Alzheimer’s disease based on retinal
photographs: a retrospective, multicentre case-control
study. Lancet Digital Health, 4(11), 806-815. Doi:
10.1016/S2589-7500(22)00169-8.
Cortes, C., Jackel, L. D., Solla, S. A., Vapnik, V., &
Denker, J. S. (1993). Learning Curves: Asymptotic
Values and Rate of Convergence. In Proceedings of
Advances in Neural Information Processing Systems 6
(NIPS 1993), 327-334.
Foersch, S., Glasner, C., Woerl, A. C., Eckstein, M.,
Wagner, D. C., Schulz, S., Kellers, F., Fernandez, A.,
Tserea, K., Kloth, M., Hartmann, A., Heintz, A.,
Weichert, W., Roth, W., Geppert, C., Kather, J. N., &
Jesinghaus, M. (2023). Multistain deep learning for
prediction of prognosis and therapy response in
colorectal cancer. Nature Medicine, 29(2), 430-439.
Doi:10.1038/s41591-022-02134-1.
Huang, G., Liu, Z., van der Maaten, L., & Weinberger, K.
Q. (2017). Densely connected convolutional networks.
In Proceedings of 2017 IEEE Conference on Computer
Vision and Pattern Recognition (CVPR). 4700-4708.
Doi: 10.1109/CVPR.2017.243.
Kather, J. N., Pearson, A. T., Halama, N., Jäger, D., Krause,
J., Loosen, S. H., Marx, A., Boor, P., Tacke, F.,
Neumann, U. P., Grabsch, H. I., Yoshikawa, T.,
Brenner, H., Chang-Claude, J., Hoffmeister, M.,
Trautwein, C., & Luedde, T. (2019). Deep learning can
predict microsatellite instability directly from histology
in gastrointestinal cancer. Nature Medicine, 25(7),
1054-1056. Doi: 10.1038/s41591-019-0462-y.
Kim, H. E., Cosa-Linan, A., Santhanam, N., Jannesari, M.,
Maros, M. E., & Ganslandt, T. (2022). Transfer
learning for medical image classification: a literature
review. BMC Medical Imaging, 22(1), 1-13. Doi:
10.1186/s12880-022-00793-7.
Kohavi, R. (1995). A study of cross-validation and
bootstrap for accuracy estimation and model selection.
In Proceedings of the 14th International Joint
Conference on Artificial Intelligence, 2, 1137-1143.
Lecun, Y., Bengio, Y., & Hinton, G. (2015). Deep learning.
Nature 521, 436-444. Doi:10.1038/nature14539.
Luo, R., & Bocklitz, T. (2023). A systematic study of
transfer learning for colorectal cancer detection.
Informatics in Medicine Unlocked, 40, 1-11. Doi:
10.1016/j.imu.2023.101292.
Morid, M. A., Borjali, A., & Fiol, D. G. (2021). A scoping
review of transfer learning research on medical image
analysis using ImageNet. Computers in Biology and
Medicine, 128, 1-14. Doi: 10.1016/j.compbiomed.
2020.104115.
Mukherjee, S., Tamayo, P., Rogers, S., Rifkin, R., Engle,
A., Campbell, C., Golub, T. R., & Mesirov, J. P. (2003).
Estimating dataset size requirements for classifying
DNA microarray data. Journal of Computational
Biology, 10(2), 119-142. Doi: 10.1089/10665270
3321825928.
Narayan, V., Mall, P. K., Alkhayyat, A., Abhishek, K.,
Kumar, S., & Pandey, P. (2023). Enhance-Net: an
approach to boost the performance of deep learning
model based on real-time medical images.
Journal of
Sensors, 2023, 1-15. Doi: 10.1155/2023/8276738.
Placido, D., Yuan, B., Hjaltelin, J. X., et al. (2023). A deep
learning algorithm to predict risk of pancreatic cancer
from disease trajectories. Nature Medicine, 29(5),
1113–1122. Doi: 10.1038/s41591-023-02332-5.
Rajpurkar, P., Chen, E., Banerjee, O., & Topol, E. J. (2022).
AI in health and medicine. Nature Medicine, 28(1), 31-
38. Doi: 10.1038/s41591-021-01614-0.
Russakovsky, O., Deng, J., Su, H., Krause, J., Satheesh, S.,
Ma, S., Huang, Z., Karpathy, A., Khosla, A., Bernstein,
M., Berg, A. C., & Fei-Fei, L. (2015). ImageNet large
scale visual recognition challenge. International
Journal of Computer Vision, 115(3), 211-252. Doi:
10.1007/s11263-015-0816-y.
Samala, R.K., Chan, H.P., Hadjiiski, L., et al. (2019). Breast
cancer diagnosis in digital breast tomosynthesis: effects
of training sample size on multi-stage transfer learning
using deep neural nets. In Proceedings of the IEEE
Transactions on Medical Imaging, 38(3), 686-696. Doi:
TMI.2018.2870343.
Sandler, M., Howard, A., Zhu, M., Zhmoginov, A., & Chen,
L. C. (2018). MobileNetV2: inverted residuals and
linear bottlenecks. In Proceedings of the IEEE
Computer Society Conference on Computer Vision and
Pattern Recognition, 4510-4520. Doi:
10.1109/CVPR.2018.00474.
Soekhoe, D., & Putten, P.V.D. (2016). On the impact of
data set size in transfer learning using deep neural
networks. In Proceedings of Advances in Intelligent
Data Analysis XV (IDA 2016), 9897, 50-60. Doi:
10.1007/978-3-319-46349-0.
Szegedy, C., Vanhoucke, V., Ioffe, et al. (2016).
Rethinking the Inception architecture for computer
vision. In Proceedings of 2016 IEEE Conference on
Computer Vision and Pattern Recognition (CVPR),
2818-2826. Doi: 10.1109/CVPR.2016.308.
Viering, T., & Loog, M. (2023). The shape of learning
curves: a review. IEEE Transactions on Pattern
Sample Size Estimation of Transfer Learning for Colorectal Cancer Detection
847
Analysis and Machine Intelligence, 45(6), 7799-7819.
Doi: 10.1109/TPAMI.2022.3220744.
Voglis, C., & Lagaris, I. E. (2004). A rectangular trust
region dogleg approach for unconstrained and bound
constrained nonlinear optimization. In Proceedings of
International Conference on Applied Mathematics, 1-7.
Wang, G., Luo, X., Gu, R., et al. (2023). PyMIC: a deep
learning toolkit for annotation-efficient medical image
segmentation. Computer Methods and Programs in
Biomedicine, 231, 1-11. Doi: j.cmpb.2023.107398.
Yu, X., Wang, J., Hong, Q. Q., Teku, R., Wang, S. H., &
Zhang, Y. D. (2022). Transfer learning for medical
images analyses: a survey. Neurocomputing, 489, 230-
254. Doi: 10.1016/j.neucom.2021.08.159.
Zhuang, F., Qi, Z., Duan, et al. (2021). A comprehensive
survey on transfer learning. Proceedings of the IEEE
109(1), 43-76. Doi: 10.1109/JPROC.2020.3004555.
Zhu, W., Braun, B., Chiang, L. H., & Romagnoli, J. A.
(2021). Investigation of transfer learning for image
classification and impact on training sample size.
Chemometrics and Intelligent Laboratory Systems, 211,
1-9. Doi: 10.1016/j.chemolab.2021.104269.
APPENDIX
A: Plots of Learning Curve Fitting
Using Fine-Tuning for InceptionV3
and MobileNetV2
ICPRAM 2024 - 13th International Conference on Pattern Recognition Applications and Methods
848
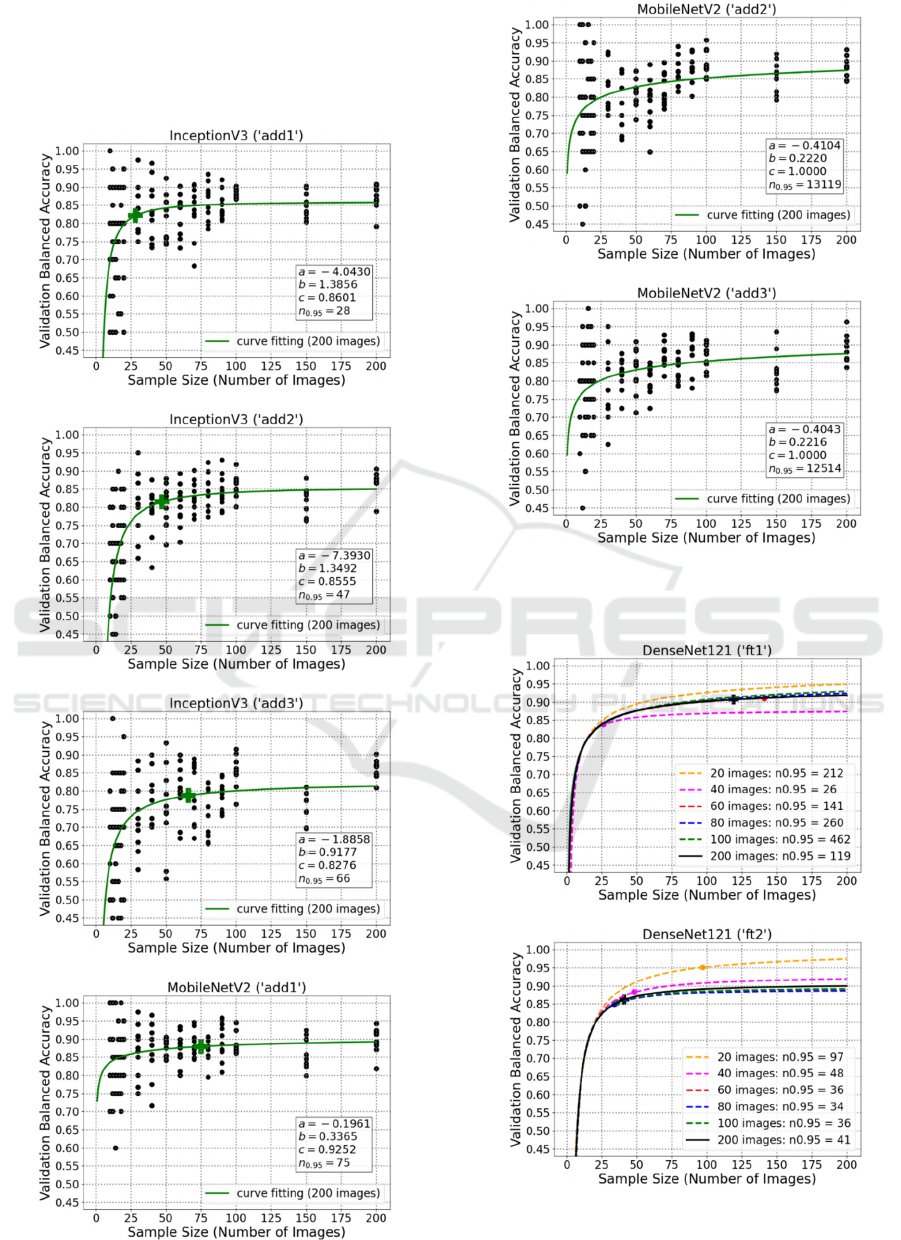
B: Plots of Learning Curve Fitting
Using Additional Convolutional
Layers for InceptionV3 and
MobileNetV2
C: Plots of Fitted Curve Prediction
Using Fine-Tuning
Sample Size Estimation of Transfer Learning for Colorectal Cancer Detection
849
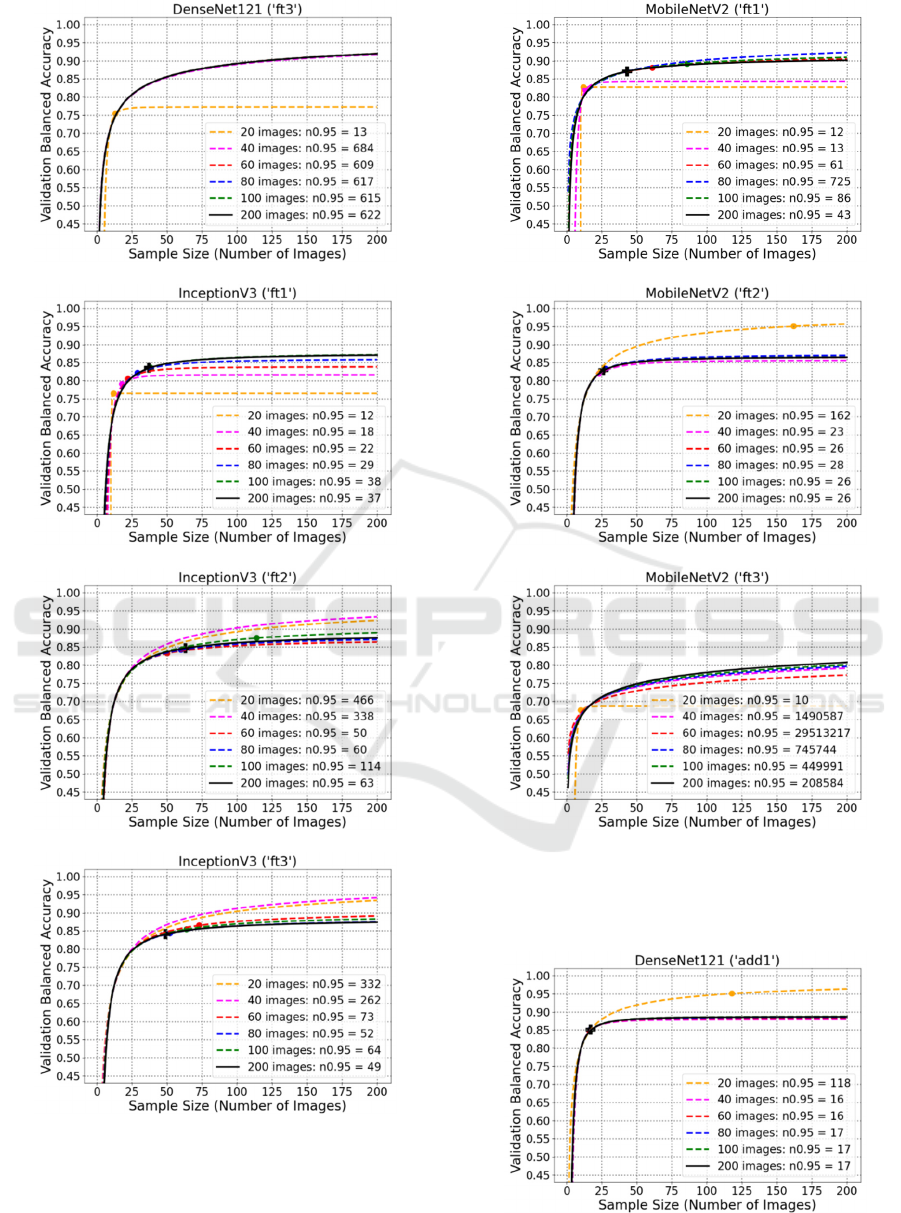
D: Plots of Fitted Curve Prediction
Using Additional Convolutional
Layers
ICPRAM 2024 - 13th International Conference on Pattern Recognition Applications and Methods
850
Sample Size Estimation of Transfer Learning for Colorectal Cancer Detection
851
