
Performance Comparison of Gyrocardiogram and Seismocardiogram
Signals in Valvular Heart Disease Assessment
Ecem Erin
1
and Beren Semiz
2 a
1
Department of Physics, Bogazici University, Istanbul, Turkey
2
Department of Electrical and Electronics Engineering, Koc University, Istanbul, Turkey
Keywords:
Valvular Heart Disease, Seismocardiogram, Gyrocardiogram, Cardiovascular Health Monitoring, Biomedical
Signal Processing.
Abstract:
Cardiovascular diseases have been identified as one of the leading causes of mortality worldwide. Among
these diseases, valvular heart diseases (VHDs) have a greater impact on the population. The existing methods
for VHD assessment are expensive and only applicable within clinical environments. Hence, there is a need for
accessible and cost-efficient systems to provide continuous VHD monitoring. As stenosis and regurgitation
are characterized by the change in the blood flow patterns, it was hypothesized that angular acceleration
(gyrocardiogram, GCG) could capture the differences in blood flow and changes in cardiovascular parameters
better than linear acceleration (seismocardiogram, SCG). In this work, a publicly available dataset including
36 patients with stenosis and 44 patients with regurgitation was used. The SCG and GCG signals were first
divided into 10- second long segments. From each segment, five features were extracted from all axes and
used to train the SCG- and GCG-based XGBoost models. Overall, the GCG-based model resulted in better
performance in distinguishing between the stenosis and regurgitation cases: the precision, recall and accuracy
values were 94.7, 94.5, and 94.5 for the SCG, and 96.0, 95.9 and 95.9 for the GCG, respectively. Predictive
performances of SCG and GCG models on the cardiovascular parameters were also investigated and resulted
in (SCG, GCG) mean absolute percent errors of (19.4, 20.6), (15.5, 14.5), (12.0, 13.1) for ejection fraction,
left ventricular end diastolic dimension and left ventricle posterior wall thickness, respectively. These results
showed that in addition to SCG, GCG could also be used for VHD evaluation and potentially be employed in
continuous monitoring systems.
1 INTRODUCTION
According to the 2020 report by the World Health Or-
ganization (WHO), cardiovascular diseases have been
identified as one of the leading causes of mortality
worldwide (WHO, 2020). Among cardiovascular dis-
eases, valvular heart diseases (VHDs) have a greater
impact on the population and result in higher mortal-
ity rates (Go et al., 2013). In the heart, four main
heart valves are present: tricuspid valve, aortic valve,
mitral valve, and pulmonary valve (Klabunde, 2011;
Svensson, 2008). VHDs primarily emerge due to the
impairments in these valves. These impairments can
be group under two main categories: stenosis and re-
gurgitation, which can affect any of the aforemen-
tioned valves. In the case of stenosis, the valve open-
ing narrows, leading to inadequate blood outflow. On
the other hand, regurgitation refers to the valve’s fail-
a
https://orcid.org/0000-0002-7544-5974
ure to prevent the backward flow of blood (Svensson,
2008).
While echocardiography, magnetic resonance
imaging, cardiac catheterization, and computed to-
mography can be used to monitor VHDs, these meth-
ods are costly and only available in clinical settings
(Svensson, 2008). Hence, there is a need for accessi-
ble and cost-efficient systems to provide non-invasive
and continuous VHD monitoring. Recent advance-
ments in wearable sensor research have paved the way
to collect physiological signals from the body non-
invasively. As these signals directly originate from
the underlying anatomy, they can provide valuable in-
formation regarding the current physiological status
of the subject. Among these physiological signals,
seismocardiogram (SCG) has been widely leveraged
in wearable system design. SCG originates from the
contraction of the heart and corresponds to the result-
ing micro chest vibrations (Inan et al., 2014). Mostly,
786
Erin, E. and Semiz, B.
Performance Comparison of Gyrocardiogram and Seismocardiogram Signals in Valvular Heart Disease Assessment.
DOI: 10.5220/0012441700003657
Paper published under CC license (CC BY-NC-ND 4.0)
In Proceedings of the 17th International Joint Conference on Biomedical Engineering Systems and Technologies (BIOSTEC 2024) - Volume 1, pages 786-792
ISBN: 978-989-758-688-0; ISSN: 2184-4305
Proceedings Copyright © 2024 by SCITEPRESS – Science and Technology Publications, Lda.
tri-axial accelerometers are used to collect the SCG
signal in three directions: lateral, head-to-foot and
dorso-ventral. On the other hand, recent studies have
shown that utilizing gyroscope-based vibrations could
offer enhanced capabilities in detecting heart activ-
ity and blood movement compared to accelerometers
(Yang et al., 2017; Yang and Tavassolian, 2017; Ja-
fari Tadi et al., 2017; Shandhi et al., 2019). However,
the performance of gyrocardiogram (GCG) in VHD
assessment is still an open research question.
From physics perspective, accelerometers mea-
sure linear acceleration; whereas gyroscope can cap-
ture dynamic angular velocity in three axes (yaw,
pitch, and roll) (Faisal et al., 2019). Considering that
the stenosis and regurgitation impairments exhibit dif-
ferent blood flow characteristics, it was hypothesized
that GCG could capture the differences in blood flow
and changes in cardiovascular parameters better than
SCG. The contributions of this study can thus be listed
as follows: for the first time to the best of our knowl-
edge, (i) the performance of GCG in VHD assess-
ment was studied and compared with the SCG perfor-
mance, (ii) contributions of the spectral features and
individual SCG and GCG axes (X, Y, and Z) in VHD
assessment were investigated, (iii) predictive perfor-
mances of SCG and GCG models on the cardiovascu-
lar parameters (ejection fraction, left ventricular end
diastolic dimension and left ventricle posterior wall
thickness) under stenosis and regurgitation conditions
were investigated.
2 METHODS
2.1 Dataset Description
In this study, An Open-Access Database for the Eval-
uation of Cardio-Mechanical Signals From Patients
With Valvular Heart Disease, which includes seismo-
cardiogram (SCG), gyrocardiogram (GCG) and elec-
trocardiogram (ECG) signals, was used (Yang et al.,
2021). The participants were identified as having dif-
ferent forms of valvular heart diseases (VHD), includ-
ing mitral valve stenosis (MS), aortic stenosis (AS),
aortic valve regurgitation (AR), mitral valve regurgi-
tation (MR), and tricuspid valve regurgitation (TR).
Each specific VHD was indicated by a label whether
if the disease is present.
The SCG, ECG and GCG signals were col-
lected using commercially available Shimmer system
(Shimmer 3 ECG module, Shimmer Sensing, United
Kingdom) while the subject was in supine position.
For the analysis, only the tri-axial SCG and GCG sig-
nals were used. The X, Y, and Z directions of the SCG
and GCG signals were representing the vibrations in
the lateral, head-to-foot, and dorso-ventral directions,
respectively.
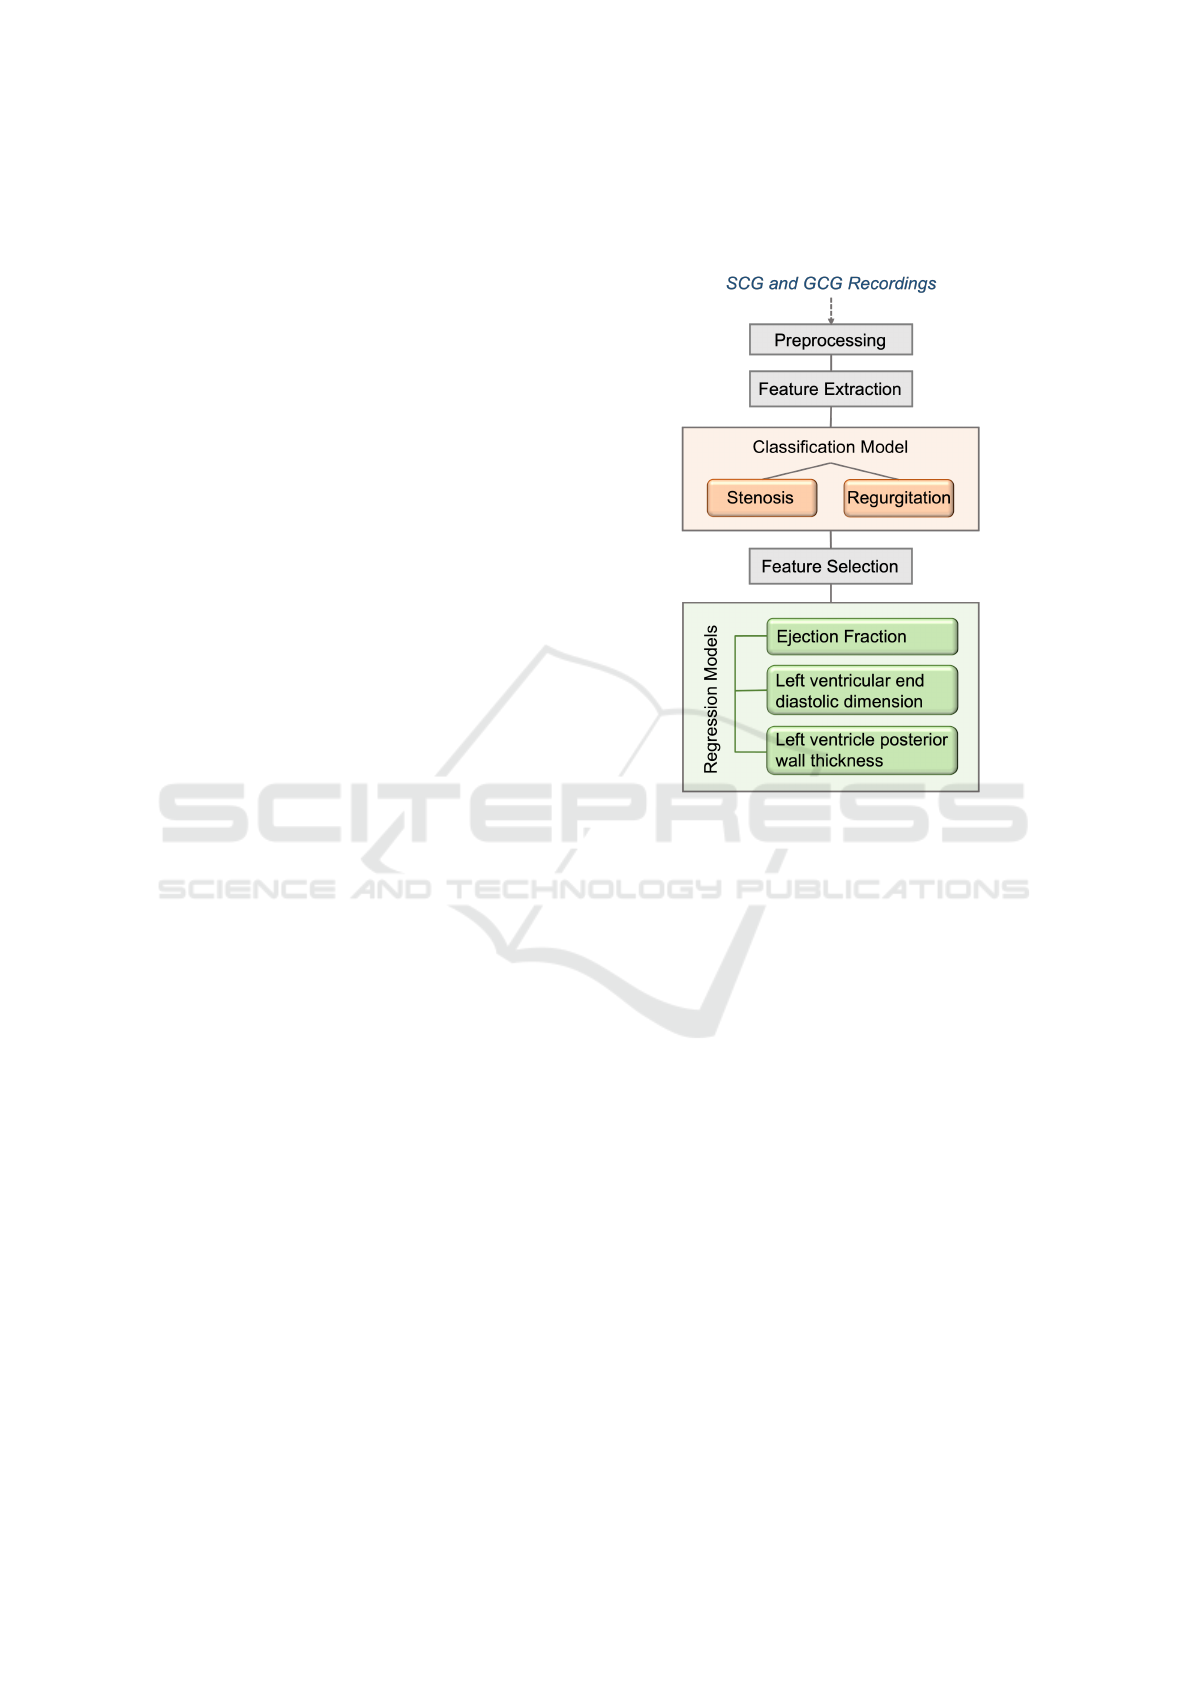
Figure 1: Study Overview.
2.2 Pre-Processing and Data
Preparation
As the goal was to investigate the performance of
SCG and GCG in stenosis and regurgitation assess-
ment, two different sub-datasets were generated: one
having only SCG signals, the other one including only
the GCG signals. In both sub-datasets, there were 36
patients with stenosis and 44 patients with regurgita-
tion present either of the valves. It should be noted
that these signals were simultaneously acquired from
the same subjects and the classification and regression
tasks were employed on the same samples. Thus the
data was comparable. However, some GCG signals
were shorter in duration.
In the datasets, some recordings had a sampling
rate of 256 Hz while the others had a rate of 512 Hz.
To ensure standardization, all sampling rates were set
to 256 Hz. Each signal was then divided into 10-
second long segments to have higher number of in-
stances for model training. For the GCG dataset, this
resulted in 1070 samples for stenosis and 2017 sam-
ples for regurgitation; whereas for the SCG dataset,
there were 1521 samples for stenosis, and 2017 for
regurgitation. No other pre-processing step was ap-
plied on the signals.
Performance Comparison of Gyrocardiogram and Seismocardiogram Signals in Valvular Heart Disease Assessment
787

2.3 Feature Extraction
Considering that the stenosis and regurgitation im-
pairments exhibit different blood flow characteristics,
it was hypothesized that there would be differences in
the information encoded in the spectral content of the
acquired signals. In addition, previous studies showed
that VHD assessment can highly benefit from spec-
tral analysis of the SCG signals through spectrogram,
wavelet, chromagram and tempogram features (Erin
and Semiz, 2023). In this work, a similar approach
was inherited, however instead of using a high num-
ber of features (and to prevent the possibility of over-
fitting), only five features (one from the time domain,
four from the spectral domain) were extracted from
each of the 10-second-long X, Y, Z segments.
• Entropy: Entropy quantifies the abrupt energy
changes in the time domain of the signal. When
the signal exhibits sudden changes, it is expected
to observe relatively reduced entropy at the onset
of these changes (Hersek et al., 2017).
• Spectral Entropy: The interpretation behind
spectral entropy is similar to the energy entropy.
However computation is carried out in the fre-
quency domain. The resulting value represents
how complex the spectrum is, i.e., the larger the
complexity, the higher the spectral entropy value
(Hersek et al., 2017).
• Spectral Rolloff: It measures the frequency at
which a specific portion of the signal’s energy is
concentrated below. Based on the literature, this
ratio is usually chosen as 90% (Giannakopoulos
and Pikrakis, 2014).
• Spectral Centroid: It computes the center of
mass of the spectrum. If the signal mostly in-
cludes high frequencies, centroid is expected to be
relatively higher (Giannakopoulos and Pikrakis,
2014).
• Spectral Spread: Spread corresponds to the dis-
tribution of the frequencies around the centroid.
If the frequencies are tightly gathered around the
center frequency, a lower spectral spread value is
expected (Giannakopoulos and Pikrakis, 2014).
As there were 5 different features extracted from
each of the 10-second-long segments in the X, Y, Z di-
rections, the dataframe was consisting of 15 features,
i.e. columns. Segments corresponding to stenosis and
regurgitation were labeled as 0 and 1, respectively.
2.4 Model Training and Validation
2.4.1 Stenosis and Regurgitation Classification
Model Selection and Training: In the first task, the
aim was to compare the performances of the GCG-
and SCG-based stenosis and regurgitation classifica-
tion models. As the classification model, extreme gra-
dient boosting trees (XGBoost) was chosen. Rather
than relying on a single estimator, XGBoost involves
employing multiple estimators concurrently. During
training, multiple decision trees are trained in an iter-
ative manner, enabling the prediction and refinement
of residual errors from the preceding iteration as the
training progresses (Dietterich et al., 2002).
For GCG- and SCG-based classification, two dif-
ferent XGBoost models were trained. Before split-
ting each dataframe into train and test sets, the fea-
tures were scaled using standard scaler. Following
that, the datasets were split into training (80%) and
testing (20%) portions. As the dataset had some in-
balance regarding the number of samples available in
each group, leave-one-out methodology could not be
used. During training, the objective function was de-
termined as binary:logistic. On the other hand, the de-
fault values were used for the remaining parameters.
The performance of the model was assessed using ac-
curacy, precision, recall, and f1-score metrics. These
equations are presented in Equations 1, 2, 3 and 4, re-
spectively (TP: true positives, FP: false positives, TN:
true negatives and FN: false negatives). In addition,
the area under the receiver operating characteristics
curve (ROC AUC) was computed.
Accuracy =
T P + T N
T P + T N + FP + FN
(1)
Precision =
T P
T P + FP
(2)
Recall =
T P
T P + FN
(3)
f
1
score = 2 ∗
precision ∗ recall
precision + recall
(4)
Investigating the Performance of the Individual
Axes: In addition to investigating the performance
of SCG and GCG signals in distinguishing between
stenosis and regurgitation cases, the performances of
the individual GCG and SCG axes (X, Y and Z) were
assessed. To that aim, similar feature extraction and
model training steps were implemented. Performance
assessment was again employed through accuracy,
precision, recall, f1-score metrics.
BIOSIGNALS 2024 - 17th International Conference on Bio-inspired Systems and Signal Processing
788

Investigating the Importance of the Spectral Fea-
tures: To investigate which features contribute the
most in regurgitation and stenosis classification, XG-
Boost feature importance ranking was leveraged. In
this approach, for each split point, the significance of
each attribute in improving the performance measure
is computed. The importance scores are then aver-
aged across all decision trees available in the XG-
Boost model. The resulting scores are used to rank
the features, which represent the importance of the
features. Following that, the minimum number of
features sufficient was determined to be used in the
regression tasks and the redundant features were ex-
cluded from the feature set.
2.4.2 Investigating the Cardiovascular
Parameter Prediction Performances
After determining the top five most important features
in classification of regurgitation and stenosis, those
features were used to predict the ejection fraction, left
ventricular end diastolic dimension and left ventric-
ular posterior wall thickness values, which were in-
cluded in the referred database. The reason why only
top five features were used was that adding additional
features was not increasing the model performances
any further. Below, the definition of each cardiovas-
cular parameter and their relationship with the steno-
sis and regurgitation conditions are detailed.
• Ejection fraction: It represents how well the heart
pumps blood and is defined as the ratio of the
stroke volume and end diastolic left ventricular
volume. In case of stenosis and regurgitation, the
primary compensatory mechanism required to up-
hold a normal effective stroke volume is an eleva-
tion in left ventricular end-diastolic volume. An
increase in end-diastolic volume, results in a de-
crease in ejection fraction (Maurer, 2006; Cham-
bers, 2006).
• Left Ventricular Posterior Wall Thickness
(LVPW): Specifically under aortic stenosis con-
dition, an increase in wall thickness typically
occurs to compensate the elevated intracavitary
pressure (Chambers, 2006; Mehrotra et al., 2015;
Borow et al., 1985).
• Left Ventricular End Diastolic Dimension
(LVEDD): Similar to LVPW, an increase is
observed in LVEDD in regurgitation (Maurer,
2006), however studies found no significant rela-
tionship between LVEDD and stenosis (Mehrotra
et al., 2015; Borow et al., 1985).
Using the top five features, separate SCG- and
GCG-based XGBoost regression models were trained
Table 1: Performance Metrics for SCG and GCG.
Signal Precision Recall Accuracy AUC
SCG 94.7 94.5 94.5 0.99
GCG 96.0 95.9 95.9 0.99
Table 2: Performance Metrics for the individual GCG Axes
in Classification Task.
Axis Precision Recall Accuracy f1-score
X 87.5 87.5 87.5 87.5
Y 87.3 87.4 87.4 87.4
Z 72.3 73.0 73.0 72.1
for each cardiovascular parameter. First, similar to the
previous task, the SCG and GCG datasets were split
into training (80%) and testing (20%) portions. Dur-
ing training, the objective function was determined as
reg:squarederror and the remaining parameters were
kept as the default values. The performance of the
models was assessed using the root mean squared
error (RMSE) and mean absolute percentage error
(MAPE) metrics. The corresponding equations are
presented in Equations 5 and 6, respectively ( ˆy
i
: pre-
dicted, y
i
: actual).
RMSE(y, ˆy) =
s
∑
N−1
i=0
(y
i
− ˆy
i
)
2
N
(5)
MAPE(y, ˆy) =
100%
N
N−1
∑
i=0
|y
i
− ˆy
i
|
|y
i
|
. (6)
3 RESULTS AND DISCUSSION
3.1 Stenosis and Regurgitation
Classification
Classification Performance: To compare the perfor-
mance of SCG and GCG in stenosis and regurgitation
assessment, two different XGBoost models were
trained. The performance results and confusion
matrices for both models are presented in Table 1
and Fig. 2. As expected, the GCG-based model
resulted in slightly better performance compared
to the SCG-based model. Overall, the precision,
recall and accuracy values were 94.7, 94.5, and 94.5
for the SCG, and 96.0, 95.9 and 95.9 for the GCG,
respectively. On the other hand, both models resulted
in an ROC AUC of 0.99.
Assessment of Axes Contributions: Additionally,
the performance of the individual GCG and SCG
axes in the classification task was investigated. The
Performance Comparison of Gyrocardiogram and Seismocardiogram Signals in Valvular Heart Disease Assessment
789
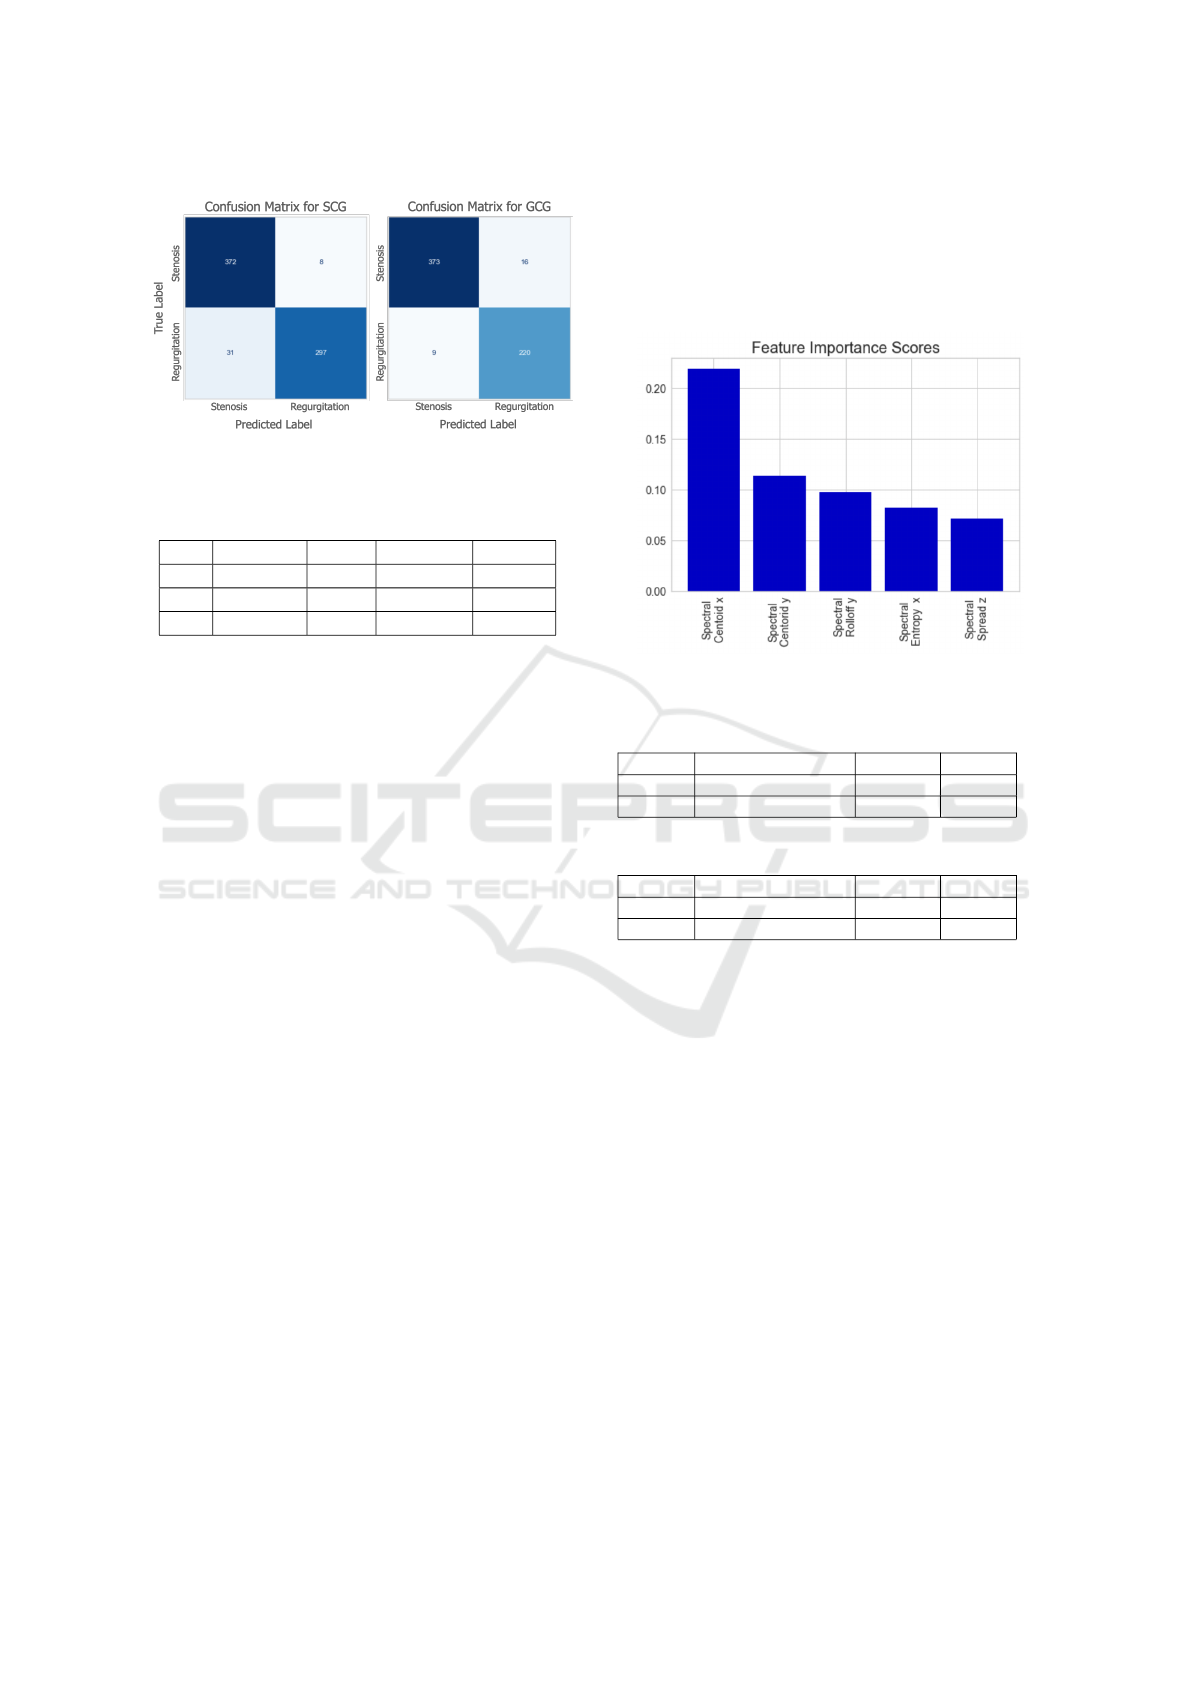
Figure 2: Confusion matrices for the classification models.
Table 3: Performance Metrics for the individual SCG Axes
in Classification Task.
Axis Precision Recall Accuracy f1-score
X 86.9 86.9 87.2 86.8
Y 86.7 86.7 86.9 86.7
Z 81.6 81.6 81.7 81.6
performance results are presented in Tables 2 and 3
for the GCG- and SCG-based models, respectively.
The accuracy values of the models trained with
the GCG signals were 87.5 and 87.4 for the X
(lateral) and Y (head-to-foot) axes, whereas for the
SCG-based models, these values were 87.2 and
86.9, respectively. These findings were indeed in
parallel with the previous study (Shandhi et al.,
2019). The model trained with the Z (dorso-ventral)
axis of the GCG signals resulted in a relatively lower
performance compared to the one trained with the
SCG signals, with accuracy and f1-score being 73.0
and 72.1, respectively. On the other hand, the one
with the SCG signals resulted in an accuracy score
of 81.7 and f1 score of 81.6, which is in parallel
with the results presented in (Erin and Semiz, 2023).
These findings could be attributed to the fact that the
flow characteristics of blood can be captured better in
the lateral and head-to-foot axes by the GCG as they
represent the ejection direction and path; whereas the
beating of the heart results in a linear acceleration
in the dorso-ventral direction, hence could be better
captured by the SCG.
Importance Ranking of Spectral Features: In ad-
dition to assessing the performance of the individual
axes, importance ranking of the features was also in-
vestigated. The top five features for both GCG-based
model and SCG-based model are presented in Fig. 3.
Indeed, both signal types resulted in the same top five
features. The spectral centroid in the lateral and head-
to-foot directions appeared as the top two features,
showing that the center frequency for blood flow has
a distinguishable effect in stenosis and regurgitation
classification. In addition, entropy, which is a time
domain feature, did not appear among the top fea-
tures. Another important observation was that fea-
tures from the dorso-ventral axis have relatively lower
importance compared to the features from the lateral
and head-to-foot directions.
Figure 3: Feature importance scores for the SCG and GCG
models.
Table 4: Performance Metrics for SCG Regression Task.
SCG Ejection Fraction
LVEDD
LVPW
RMSE 11.5 10.6 1.71
MAPE 19.4 15.5 12.0
Table 5: Performance Metrics for GCG Regression Task.
GCG Ejection Fraction
LVEDD
LVPW
RMSE 11.9 10.0 1.85
MAPE 20.6 14.5 13.1
3.2 Cardiovascular Parameter
Prediction Results
Using the top five features, separate SCG- and GCG-
based XGBoost regression models were trained for
each of ejection fraction (EF), left ventricular pos-
terior wall thickness (LVPW) and left ventricular
end diastolic dimension (LVEDD). The RMSE and
MAPE values for the SCG- and GCG-based models
are presented in Table 4 and 5, respectively. The re-
sults show that the SCG and GCG have comparable
performance in the estimation of all three parameters.
While the (RMSE, MAPE) values were (11.5, 19.4),
(10.6, 15.5), (1.71, 12.0) for the SCG-based models,
these values were (11.9, 20.6), (10.0, 14.5), (1.85,
13.1) for the GCG-based models for ejection fraction,
LVEDD and LVPW, respectively. SCG-based models
performed slightly better than the GCG ones in the
estimation of ejection fraction and LVPW, whereas
LVEDD estimation resulted in relatively lower error
BIOSIGNALS 2024 - 17th International Conference on Bio-inspired Systems and Signal Processing
790

when GCG was used. Overall, it can be deduced that
both SCG and GCG can potentially be leveraged in
the estimation of cardiovascular parameters.
4 CONCLUSION
In this work, the performances of the SCG- and GCG-
based models in stenosis and regurgitation assessment
were investigated. Additionally, the predictive per-
formances of SCG- and GCG-based models on the
cardiovascular parameters (ejection fraction, left ven-
tricular end diastolic dimension and left ventricle pos-
terior wall thickness) under stenosis and regurgita-
tion conditions were studied. Overall, it was found
that the GCG-based model performs slight better than
the SCG-based model in distinguishing between the
stenosis and regurgitation cases, most probably as
the GCG could capture the angular characteristics of
the blood flow better than the SCG. Additionally, the
best performing axes were found to be the lateral and
head-to-foot axes.
For the regression tasks, the SCG and GCG had
comparable performance in the estimation of ejec-
tion fraction, left ventricular posterior wall thickness
and left ventricular end diastolic dimension. Models
based on SCG demonstrated slightly higher perfor-
mance compared to those based on GCG in estimat-
ing ejection fraction and LVPW. On the other hand,
the estimation of LVEDD showed a relatively lower
error when GCG-based model was used. In conclu-
sion, it can be inferred that both SCG and GCG can
potentially be used in estimating various cardiovascu-
lar parameters.
Future work will focus on improving the current
pipelines further to enable real-time monitoring of
VHDs and validating these pipelines in larger datasets
to ensure generalizability.
REFERENCES
Borow, K. M., Colan, S., and Neumann, A. (1985). Al-
tered left ventricular mechanics in patients with valvu-
lar aortic stenosis and coarction of the aorta: effects on
systolic performance and late outcome. Circulation,
72(3):515–522.
Chambers, J. (2006). The left ventricle in aortic steno-
sis: evidence for the use of ace inhibitors. Heart,
92(3):420–423.
Dietterich, T. G. et al. (2002). Ensemble learning.
The handbook of brain theory and neural networks,
2(1):110–125.
Erin, E. and Semiz, B. (2023). Spectral analysis of cardio-
genic vibrations to distinguish between valvular heart
diseases.
Faisal, I. A., Purboyo, T. W., and Ansori, A. S. R. (2019). A
review of accelerometer sensor and gyroscope sensor
in imu sensors on motion capture. J. Eng. Appl. Sci,
15(3):826–829.
Giannakopoulos, T. and Pikrakis, A. (2014). Introduction
to audio analysis: a MATLAB® approach. Academic
Press.
Go, A. S., Mozaffarian, D., Roger, V. L., Benjamin, E. J.,
Berry, J. D., Borden, W. B., Bravata, D. M., Dai, S.,
Ford, E. S., Fox, C. S., et al. (2013). Heart disease
and stroke statistics—2013 update: a report from the
american heart association. Circulation, 127(1):e6–
e245.
Hersek, S., Pouyan, M. B., Teague, C. N., Sawka, M. N.,
Millard-Stafford, M. L., Kogler, G. F., Wolkoff, P.,
and Inan, O. T. (2017). Acoustical emission analysis
by unsupervised graph mining: A novel biomarker of
knee health status. IEEE Transactions on Biomedical
Engineering, 65(6):1291–1300.
Inan, O. T., Migeotte, P.-F., Park, K.-S., Etemadi, M.,
Tavakolian, K., Casanella, R., Zanetti, J., Tank, J.,
Funtova, I., Prisk, G. K., et al. (2014). Ballistocardio-
graphy and seismocardiography: A review of recent
advances. IEEE journal of biomedical and health in-
formatics, 19(4):1414–1427.
Jafari Tadi, M., Lehtonen, E., Saraste, A., Tuominen, J.,
Koskinen, J., Ter
¨
as, M., Airaksinen, J., P
¨
ank
¨
a
¨
al
¨
a, M.,
and Koivisto, T. (2017). Gyrocardiography: A new
non-invasive monitoring method for the assessment
of cardiac mechanics and the estimation of hemody-
namic variables. Scientific reports, 7(1):1–11.
Klabunde, R. (2011). Cardiovascular physiology concepts.
Lippincott Williams & Wilkins.
Maurer, G. (2006). Aortic regurgitation. Heart, 92(7):994–
1000.
Mehrotra, P., Flynn, A. W., Jansen, K., Tan, T. C., Mak, G.,
Julien, H. M., Zeng, X., Picard, M. H., Passeri, J. J.,
and Hung, J. (2015). Differential left ventricular out-
flow tract remodeling and dynamics in aortic stenosis.
Journal of the American Society of Echocardiography,
28(11):1259–1266.
Shandhi, M. M. H., Semiz, B., Hersek, S., Goller, N.,
Ayazi, F., and Inan, O. T. (2019). Performance
analysis of gyroscope and accelerometer sensors for
seismocardiography-based wearable pre-ejection pe-
riod estimation. IEEE journal of biomedical and
health informatics, 23(6):2365–2374.
Svensson, L. (2008). Aortic valve stenosis and regurgita-
tion: an overview of management. Journal of Cardio-
vascular Surgery, 49(2):297.
WHO (2020). The top 10 causes of death. Geneva: World
Health Organization. https://www.who.int/news- r
oom/fact-sheets/detail/the-top-10-causes-of-death
(visited: 2022-09).
Yang, C., Fan, F., Aranoff, N., Green, P., Li, Y., Liu, C., and
Tavassolian, N. (2021). An open-access database for
the evaluation of cardio-mechanical signals from pa-
Performance Comparison of Gyrocardiogram and Seismocardiogram Signals in Valvular Heart Disease Assessment
791

tients with valvular heart diseases. Frontiers in Phys-
iology, 12.
Yang, C., Tang, S., and Tavassolian, N. (2017). Utilizing
gyroscopes towards the automatic annotation of seis-
mocardiograms. IEEE Sensors Journal, 17(7):2129–
2136.
Yang, C. and Tavassolian, N. (2017). Combined seismo-and
gyro-cardiography: A more comprehensive evaluation
of heart-induced chest vibrations. IEEE journal of
biomedical and health informatics, 22(5):1466–1475.
BIOSIGNALS 2024 - 17th International Conference on Bio-inspired Systems and Signal Processing
792
