
AI-Supported Diagnostic of Depression Using Clinical Interviews: A
Pilot Study
Bakir Had
ˇ
zi
´
c
1,∗ a
, Julia Ohse
2,∗ b
, Michael Danner
3 c
, Nicolina Peperkorn
2 d
,
Parvez Mohammed
1 e
, Youssef Shiban
2 f
and Matthias R
¨
atsch
1 g
1
ViSiR, Reutlingen University, Reutlingen, Germany
2
Private University of Applied Sciences, G
¨
ottingen, Germany
3
CVSSP, University of Surrey, Guildford, U.K.
Keywords:
Deep Learning, Depression Diagnostics, Mental Health, NLP, BERT, GPT.
Abstract:
In the face of rising depression rates, the urgency of early and accurate diagnosis has never been more
paramount. Traditional diagnostic methods, while invaluable, can sometimes be limited in access and sus-
ceptible to biases, potentially leading to underdiagnoses. This paper explores the innovative potential of AI
technology, specifically machine learning, as a diagnostic tool for depression. Drawing from prior research,
we note the success of machine learning in discerning depression indicators on social media platforms and
through automated interviews. A particular focus is given to the BERT-based NLP transformer model, previ-
ously shown to be effective in detecting depression from simulated interview data. Our study assessed this
model’s capability to identify depression from transcribed, semi-structured clinical interviews within a general
population sample. While the BERT model displayed an accuracy of 0.71, it was surpassed by an untrained
GPT-3.5 model, which achieved an impressive accuracy of 0.88. These findings emphasise the transformative
potential of NLP transformer models in the realm of depression detection. However, given the relatively small
dataset (N = 17) utilised, we advise a measured interpretation of the results. This paper is designed as a pilot
study, and further studies will incorporate bigger datasets.
1 INTRODUCTION
Depression is a common mental disorder affecting
around 280 million people worldwide (point preva-
lence in 2019), according to the (Institute for Health
Metrics and Evaluation, 2023). While a survey car-
ried out between 2007-2014 found a prevalence of de-
pression in US adults of 15.08% (Liu et al., 2017),
a meta-analysis found a pooled prevalence of 25%
during the COVID-19 outbreak (Bueno-Notivol et al.,
2021). Early identification and intervention are essen-
tial since prolonged untreated depression is associated
with poorer treatment results (Kraus et al., 2019). Yet,
many people suffering from depression remain with-
out a diagnosis (Berner et al., 2008; Jacob et al., 2012;
a
https://orcid.org/0009-0003-1197-7255
b
https://orcid.org/0009-0005-3344-4753
c
https://orcid.org/0000-0002-8652-6905
d
https://orcid.org/0009-0008-9481-9354
e
https://orcid.org/0009-0001-7448-7857
f
https://orcid.org/0000-0002-6281-0901
g
https://orcid.org/0000-0002-8254-8293
∗
Both authors contributed equally
Jacobi et al., 2002) or show unmet needs regarding
mental health treatment (Coley and Baum, 2022).
1.1 Diagnostic Methods
Depression is traditionally diagnosed by deploying
self-report measures like questionnaires (e.g. PHQ-9,
HADS, BDI-II) (Smarr and Keefer, 2011) or in semi-
structured clinical interviews (e.g. SCID (First, 2014),
MINI (Sheehan et al., 1998)) and/or by external rating
scales (e.g. HRSD (Hamilton, 1960)). Research ex-
plores the diagnostic utility of physiological sensory
markers (e.g. heart rate (Roh et al., 2014), sleep phys-
iological data (Zhang et al., 2020) or skin conduc-
tance (Smith et al., 2020)) and/or movement data from
phones and wearables (Roberts et al., 2018; Torous
et al., 2015). Traditional methods for depression di-
agnostics as well as emergent ones, are not without
their challenges and limitations: One of the limita-
tions of traditional diagnostic methods is availabil-
ity. Traditional methods require access to standard-
ised questionnaires/scales and trained clinicians, po-
tentially limiting their utility in resource-constrained
settings (Thom et al., 2015).
500
Hadži
´
c, B., Ohse, J., Danner, M., Peperkorn, N., Mohammed, P., Shiban, Y. and Rätsch, M.
AI-Supported Diagnostic of Depression Using Clinical Interviews: A Pilot Study.
DOI: 10.5220/0012439700003660
Paper published under CC license (CC BY-NC-ND 4.0)
In Proceedings of the 19th International Joint Conference on Computer Vision, Imaging and Computer Graphics Theory and Applications (VISIGRAPP 2024) - Volume 1: GRAPP, HUCAPP
and IVAPP, pages 500-507
ISBN: 978-989-758-679-8; ISSN: 2184-4321
Proceedings Copyright © 2024 by SCITEPRESS – Science and Technology Publications, Lda.

1.1.1 Emergent Technologies
Promising tools in the recent decade for overcom-
ing difficulties present in traditional diagnostic pro-
cedures are coming from the field of machine learn-
ing. According to the literature review conducted
by (Zhang et al., 2022), in the past decade, research
on NLP-driven mental health issue detection was on
the rapid rise, which points to the promising future
of automated mental health screening. This applies
in particular to the detection of depression and suici-
dality, with these two areas of research covering more
than 60% of research papers on NLP use in mental
health issues detection. Very apparent growth is no-
ticeable since the release of BERT-(Bidirectional En-
coder Representations from Transformers) by (De-
vlin et al., 2019) whose groundbreaking architecture
significantly advanced the field of natural language
processing (NLP). Since then, plenty of researchers
have employed BERT architecture for the detection of
mental health issues (Villatoro-Tello et al., 2021; Ro-
drigues Makiuchi et al., 2019; Senn et al., 2022). In
the near future, it is reasonable to anticipate an even
greater focus of researchers on the area of NLP con-
sidering the recent release of the GPT model by Ope-
nAI which has generated significant enthusiasm and
attention among both scholars and practitioners.
1.1.2 The Potential of Machine Learning
Contemporary approaches aim at deploying Artificial
Intelligence/Machine learning systems for depression
diagnostics to overcome the challenges and limita-
tions of traditional diagnostic systems and to utilise
the potential of the aforementioned systems. In par-
ticular, the detection of depression from social net-
work data has been of scientific interest, with studies
such as (Islam et al., 2018; Deshpande and Rao, 2017)
achieving an accuracy of between 60% and 80% in
detecting posts indicative of depression from Face-
book and Twitter posts and comments by analysing
emotional processes, linguistic styles and temporal
processes. However, it is worth highlighting one per-
tinent aspect: In these cases, the ground truth was ”de-
pression suggestive comments”, a classification that
may not correspond to psychological diagnostic cri-
teria for depression. In contrast to previously men-
tioned studies, (Victor et al., 2019) used a validated
self-report depression scale (PHQ-9 (Kroenke et al.,
2001)) as ground truth for their Artificial intelligence
Mental Evaluation (AiME). In a multi-channel ap-
proach, facial expressions, tone of voice and vocabu-
lary used during the interview were used to infer a de-
pressive state. A specificity of 87.77% and sensitivity
of 86.81% was reached. However, some other stud-
ies have shown that a multichannel approach might
not even be necessary. More economic models have
demonstrated sufficient accuracy. As (Shin et al.,
2022) have demonstrated that extraction of textual
markers from a clinical interview (in their case the
MINI (Sheehan et al., 1998)) using a Naive-Bayes
Classifier can yield adequate results reached a sensi-
tivity of 69.9%, specificity of 96.4% while having an
accuracy of 83.1%.
This pilot study is driven by the research ques-
tion of whether a speech-to-text approach utilising
valid clinical interviews can effectively diagnose in-
dividuals experiencing unipolar depression within the
broader population. In our preliminary study (Dan-
ner et al., 2023), a BERT model was fine-tuned on
clinical interview data related to depression. So fine-
tuned BERT classifier and zero-shot prompted GPT-
3.5 are compared, and results have demonstrated that
GPT-3.5 even without any fine-tuning training, signif-
icantly outperforms the BERT classifier. This study
aims to verify whether this effect persists also when a
truthful respondent dataset, coming from the general
population obtained through human-interacted clin-
ical interviews, is used. Additionally, it compares
benchmark results of other approaches and evaluates
the efficacy of this newly introduced dataset.
2 MATERIALS AND METHODS
2.1 Materials
2.1.1 Clinical Interview for Depression
The GRID-HAMD (Itai et al., 1982) is an upgraded
version of the Hamilton Depression Rating Scale
(HDRS) (Hamilton, 1960), consisting of three com-
ponents: the GRID scoring system, the manual of
scoring conventions and a semi-structured-interview-
guide. GRID-HAMD-17 refers to the 17-item version
of the GRID-HAMD in which emotional symptoms are
addressed. Responses provided by participants dur-
ing the GRID-HAMD-17 interview are scored on two
dimensions, with a) intensity making up the vertical
axis and b) frequency making up the horizontal axis.
These two dimensions comprise the scoring grid in
which each intersection is attributed a numerical value
contributing to the overall score. A validation study
of the GRID-HAMD (Williams et al., 2008) showed a
high internal consistency (Cronbach’s α = 0.78) and
high interrater-reliability (ICC = 0.94). In the case
of our experiment, the German version of the GRID-
HAMD-17 was deployed (Schmitt et al., 2015).
AI-Supported Diagnostic of Depression Using Clinical Interviews: A Pilot Study
501

2.1.2 Depression Screening
Participants’ subjective levels of depression were
evaluated using a German language version of the
9-item depression scale of the Patient Health Ques-
tionnaire (PHQ-9, (Kroenke et al., 2001; Gr
¨
afe et al.,
2004)), provided as an online questionnaire. The 9
items involve different depressive symptoms and are
scored on a 4-point Likert scale ranging from 0 = ”not
at all” to 3 = ”nearly every day”. The PHQ-9 has high
reliability (Cronbach’s α = 0.88 (Gr
¨
afe et al., 2004))
and has been validated in multiple studies (Kroenke
et al., 2001; Gr
¨
afe et al., 2004). Total scores can vary
from 0-27, with higher values indicating a higher fre-
quency of depressive symptoms. The PHQ-8 refers
to the same questionnaire with item number 9 (sui-
cidal ideation) omitted (Kroenke et al., 2009). It is
mainly used for research purposes and was used as the
Ground Truth for fine-tuning the BERT-based model.
2.1.3 Transcription and Translation Tool
The initial data analysis stage was transcribing and
translating the recordings into English to achieve
compatibility with the dataset used for the model fine-
tuning. For this task, we employed the speech-to-
text model Whisper (OpenAI, 2022), developed by
OpenAI. Its primary purpose is to turn spoken words
from audio recordings into text, while allowing users
to translate that text simultaneously into another lan-
guage of their choice.
2.1.4 Training Dataset
To detect depression utilising Deep-Learning meth-
ods, commonly used training datasets among re-
searchers worldwide are DAIC-WOZ and EXTENDED
DAIC, both released by the University of South-
ern California - Institute for Creative Technologies
(USCICT) as a part of the Distress Analysis Interview
Corpus (DAIC) database (Gratch et al., 2014). The
DAIC-WOZ dataset consists of 193 audio and video
recordings collected using the Wizard of Oz inter-
view data collection method. In the publicly pub-
lished dataset, as ground truth values, authors used the
PHQ-8 questionnaire scores (Kroenke et al., 2001).
Except for the interview procedure, the EXTENDED
DAIC (Gratch et al., 2014) is identical to the DAIC-
WOZ dataset. In the EXTENDED DAIC dataset, an
interview procedure was conducted completely au-
tonomously by an automated virtual agent following a
predefined set of instructions and was used to conduct
263 interviews.
2.2 Text Classification Models
2.2.1 BERT
Bidirectional Encoder Representations from Trans-
formers (BERT) is a transformer-based language
model introduced by researchers at Google. Since
its introduction, it has been used in a wide range of
tasks in NLP. Basically, BERT is a pre-trained model,
trained on a large corpus of text from Wikipedia and
Google’s Books Corpus (Devlin et al., 2019). Un-
like context-free encoders like word2vec or GloVe
that generate a single word embedding representing
each word, these pre-trained BERT models can gener-
ate embeddings that take into account the context of
the word, and hence are more robust as words tend to
have different meanings in different contexts. These
pre-trained models can easily be used in a Classifier
network for text classification. This process is called
fine-tuning. The classifier model is the sole compo-
nent undergoing training during this process, while
the BERT model remains unaltered.
Training. All hyperparameters of our BERT classi-
fier are listed in Table 1. Owing to the GPU memory
requirements, the BERT base model was used, and the
classifier was trained on the NVIDIA GEFORCE RTX
3060 GPU. The problem is formulated as a multi-class
classification task, with the final label being the class
with a higher probability score. These can then be
used to calculate confidence scores.
Table 1: Hyperparameter Optimisation Results through
Grid Search.
Model BERT-Base uncased
Environment 12-layer, 768-hidden, 12-heads
Parameters 110 M
Length embedding 27
Optimizer AdamW
Learning rate 3 × 10⁻⁵
Dropout hidden 0.3
Dropout attention 0.5
Weight-decay 4 × 10⁻²
2.2.2 GPT-3.5-Turbo
Generative Pre-trained Transformer 3.5 (GPT-3.5) is
a subclass in the GPT family of large language mod-
els released by OpenAI called GPT-3 Base Models.
Model GPT-3.5 turbo is the most capable model in
this subclass and is optimised for chat completion at
1/10th of the cost of its predecessors. It is trained
on data latest up to Sep 2021 and has almost double
HUCAPP 2024 - 8th International Conference on Human Computer Interaction Theory and Applications
502

the context length of GPT-3 base models. However,
unlike its predecessors, GPT-3.5 turbo is at this time
point not available for fine-tuning to suit our needs.
Therefore, explicit prompt engineering is required to
get just the PHQ-8 scores from the model as text com-
pletion. Also, because of this, no training is done, and
the test set is directly evaluated. The initial prompt
that we used is
“Give me one score (0 to 24 like the PHQ-8) for the
whole interview. Only look at the Participant’s an-
swers. 0 is no depression, and 24 is severe depression.
If the Score is greater or equal to 10, the Participant
is classified as depressive. Only give me the score as
an INTEGER WITHOUT EXPLANATION!”
Then the preprocessed texts are supplied as sub-
sequent prompts to get the PHQ-8 scores from the
model.
2.3 Data Collection and Transformation
Adults aged 18 and over were recruited from a
convenience sample of the German population be-
tween May 2023 and July 2023 via social media
and the Board for Science Course Credits at the
PFH G
¨
ottingen. Demographics such as gender, age,
highest educational degree and literacy in the Ger-
man language were assessed via an online question-
naire. Consent to participate in the study and for
voice recording in accordance with the Declaration
of Helsinki was obtained from all participants. The
research procedure was approved by the Ethics Com-
mittee of the PFH G
¨
ottingen (OS 18 200423). Af-
ter being fully informed regarding the purpose of
the study, participants were asked to fill in their de-
mographic data and complete the PHQ-9 (Kroenke
et al., 2001) in an online questionnaire. Interviews
were conducted by psychology students at the PFH
G
¨
ottingen, who received expert training from a clini-
cal psychologist supervised by a psychotherapist. In-
terviews were conducted via a secure video hub and
only audio data was recorded. Participants were inter-
viewed using the GRID-HAMD-17 manual, with inter-
viewers scoring their responses following the GRID
scoring system (Schmitt et al., 2015). The partici-
pants were notified of their PHQ-9 score upon com-
pletion of the interview. They were also given a dig-
ital leaflet conveying general classification for PHQ-
9 scores and details about the available resources
for individuals experiencing depressive symptoms.
As mentioned in Section 2.1.3 the interviews were
translated and transcribed via the pre-trained Whisper
model large-v2. During the data pre-processing, the
interviewer‘s transcribed text was removed and the
participant‘s transcribed text was saved as a string.
Since BERT can process a maximum of 512 tokens,
we divided the transcribed text into fractions for this
model. We decided to divide it into 25 words per frac-
tion. In the future text, this dataset will be referred to
as KID dataset.
2.4 Data Analysis
2.4.1 Scoring of PHQ-8/PHQ-9
To determine the PHQ-9 score, the values assigned
to each item response were added together. As the
BERT-based model was trained using PHQ-8 data as
the reference standard, PHQ-8 scores were obtained
for each participant by deducting the score of item 9
from the PHQ-9 score.
2.4.2 Classification Effectiveness Metrics
The metrics used to assess classification effectiveness
in machine learning and data analysis are accuracy,
precision, recall and F
1
score. According to (Juba
and Le, 2019), precision defines the ratio of accurate
positive predictions compared to all of the classifier’s
positive predictions. Simply put, the precision score
indicates the proportion of cases the classifier classi-
fied as true positives. Recall (also known as sensitiv-
ity) assesses the model’s capacity to discover every
positive case in the dataset, which is how it evaluates
the model’s forecasting performance (Grandini et al.,
2020). Accuracy as a metric evaluates how well the
classifier performs across all cases in the dataset, con-
sidering both true positive and negative predictions.
The F1 score is a statistic that combines recall and
precision into one number. The F
1
score provides an
appropriate recall and precision estimation, emphasis-
ing each metric’s equal importance. Precision and re-
call are very important in binary classification tasks
with uneven datasets, it is the most commonly used
as a statistic measure (Juba and Le, 2019).
3 RESULTS
Descriptive Results. The preliminary sample con-
sisted of N = 17 participants drawn from a conve-
nience sample of the German population. Of these,
n = 5 indicated male as their gender, n = 11 indi-
cated female as their gender, and n = 1 person in-
dicated diverse as their gender. The mean age was
M = 29.24 years (SD = 9.38), with the youngest par-
ticipant being 19 and the oldest being 40 years old.
All participants identified as German native speak-
ers. Highest educational degree varied with n = 1
AI-Supported Diagnostic of Depression Using Clinical Interviews: A Pilot Study
503
person naming intermediate school-leaving qualifica-
tion (5.88%), n = 9 general university entrance quali-
fication (52.94%), n = 2 Bachelor’s degree (11.76%),
and n = 5 Master’s degree or diploma. The aver-
age PHQ-9 score was M = 7.59 (SD = 5.50). Scores
ranged from min = 1 to max = 22. The average PHQ-8
score was M = 7.29 (SD = 4.97), with scores ranging
from min = 1 to max = 22. Considering the criteria of
a PHQ-8 score ≥10 for depression, n = 4 of the sub-
jects (23.53%) were categorised as depressed, while
n = 13 subjects (76.47%) were categorised as not de-
pressed.
Model Performance Metrics. Performance metrics
of developed models are presented in the Table 2.
Two different models, BERT and GPT-3.5, are evalu-
ated and compared considering standardised metrics:
accuracy, precision, recall and F
1
score. Both mod-
els delivered satisfying degrees of performance on
the given metrics. But when both models are com-
pared, GPT-3.5 displayed superior performance ob-
taining a precision score of 0.92, accuracy 0.88, re-
call 0.88 and F
1
score 0.89, demonstrating excellent
overall performance in the detection of depression.
This high F
1
score indicates a satisfactory balance
between reducing false positives and increasing the
detection of correctly detected cases. This balance
is especially important for the model predicting such
sensitive outcomes as it is the detection of depression
where false negative and positive predictions can po-
tentially have very serious consequences. Our BERT
model is consistent with prior work, whilst our GPT-
3.5 model outperforms all competitors on the DAIC-
WOZ benchmark. Regarding the KID dataset, our out-
comes demonstrate a marked improvement compared
to the prior experiment. This suggests that our models
exhibit enhanced performance in analysing human-
conducted interviews.
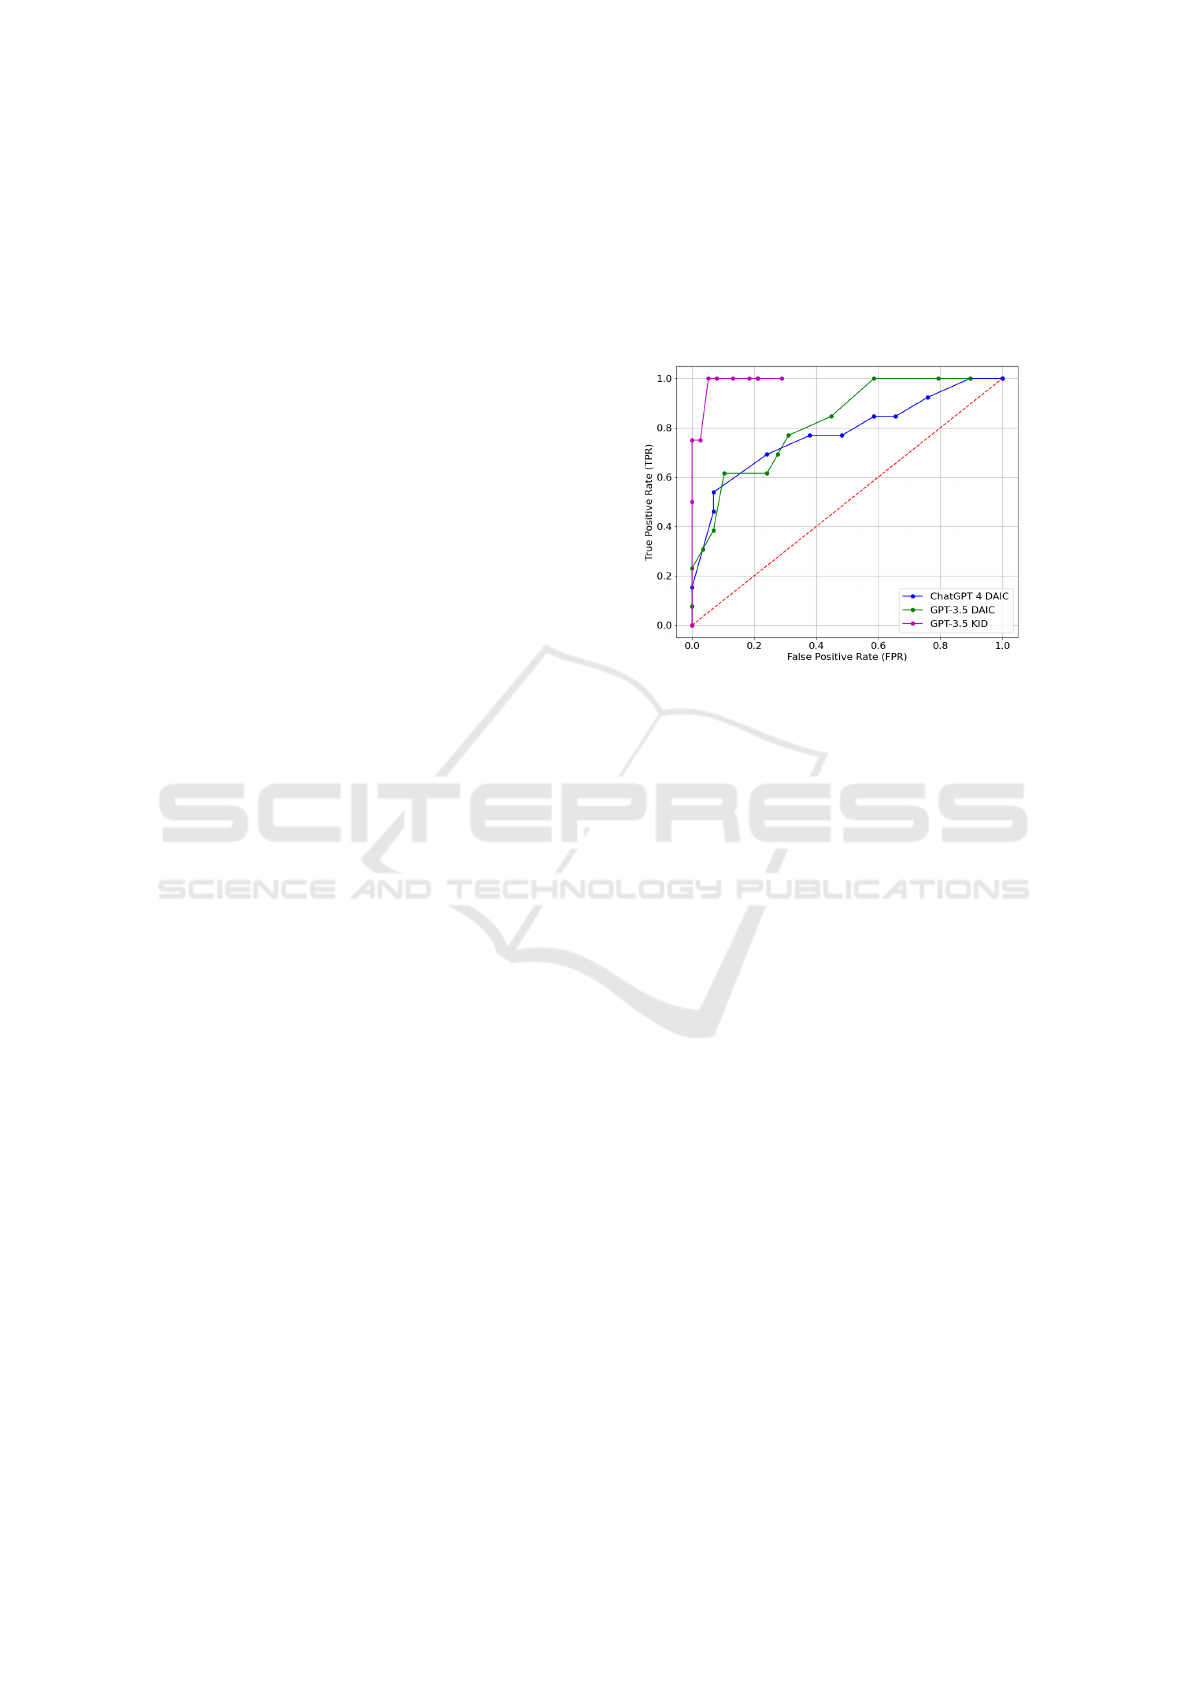
Besides obtaining previously introduced metrics
like accuracy, precision, recall and F
1
score, we also
analysed our model’s effectiveness using the Receiver
Operating Characteristic (ROC) curve. The ROC curve
gives healthcare professionals useful tools to assess
and contrast the effectiveness of various diagnostic
methods or tests. The area under the ROC curve (AUC)
is a commonly used indicator of a test’s overall ac-
curacy; an AUC of 0.5 implies no greater accuracy
than may be attributed to randomness, while the value
of 1 represents perfect diagnostic accuracy (Kim and
Hwang, 2020). Figure 1 illustrates the experimental
outcomes obtained from the DAIC-WOZ dataset using
the GPT-3.5 turbo API and the CHATGPT-4 prompt.
During the early stage of the study, we also experi-
mented with CHATGPT-4 to see what results we could
obtain. It is important to note that at that time, we still
didn’t have access to GPT-4 API; therefore, at this time
point, we were limited to using CHATGPT-4 prompt-
ing. Due to this restriction, we decided not to dis-
close these results on other performance metrics. Fig-
ure 1 highlights the remarkable performance achieved
on the KID dataset, showcasing its exceptionally high
efficacy.
Figure 1: ROC Curve for GPT-3.5 and ChatGPT 4 on the
DAIC-WOZ and KID datasets.
4 DISCUSSION
The main objective of this study was to assess how
well NLP-based models could identify depression in
transcribed clinical interviews. (GRID-HAMD-17).
Our results showed that a BERT-based model, pre-
trained on clinical interview data from the DAIC-WOZ
and EXTENDED DAIC datasets, performed adequately
with an accuracy of 0.71. Notably, this was out-
performed by an untrained GPT-3.5 model, which
showed a higher accuracy of 0.88. Compared to our
previous research (Danner et al., 2023), the BERT-
based model showed superior performance for the
truthful respondent dataset in comparison to the sim-
ulation dataset (Accuracy 0.43) and even surpassed
its prior performance for the DAIC-WOZ dataset (Ac-
curacy 0.64). The findings for superior performance
of GPT-3.5 could also be replicated for the truthful re-
spondent dataset coming from the general population.
A possible explanation could be the nature of the in-
teraction between the human interviewer and partici-
pants in the KID dataset and virtual avatar Ellie in the
DAIC. Further studies are encouraged to explore the
nature of Human-Computer interaction in the domain
of clinical interviews. At this place, it is very im-
portant to emphasise that our approach in this current
form should only be used as a helping tool for mental
health experts in the diagnostic process. The results
of our models could not be considered as a final di-
HUCAPP 2024 - 8th International Conference on Human Computer Interaction Theory and Applications
504

Table 2: Performance Metrics.
Work Accuracy Precision Recall F
1
score
DAIC-WOZ Dataset
(Villatoro-Tello et al., 2021) (BERT) 0.59 0.59 0.59
(Senn et al., 2022) (BERT) 0.60
Ours (Danner et al., 2023) (BERT) 0.63 0.66 0.64
Ours (Danner et al., 2023) (GPT-3.5) 0.78 0.79 0.78
KID Dataset
Ours (Current study BERT) 0.71 0.69 0.71 0.70
Ours (Current study GPT-3.5) 0.88 0.92 0.88 0.89
agnostic, and this step has to be done by trained pro-
fessionals. This approach is not intended to be used
solely in clinical practice. Considering its easy acces-
sibility and ease of use, it is intended to be utilised in
the everyday environment of potential users as a tool
for early detection. Lastly, it’s very important to ac-
knowledge that the difference in results could poten-
tially be attributed to the smaller number of depressed
individuals in our sample. Further studies should shed
light on this possibility.
4.1 Limitations
The interpretability of the results is limited by the
small overall sample size (N = 17), especially under
the premise that only n = 4 participants reached the
threshold of a PHQ-score ≥ 10 and were therefore
classified as depressive. Larger sample sizes are re-
quired to make inferences and test specific hypothe-
ses. It should be remarked that depression detec-
tion models are to be seen as mere screening meth-
ods which cannot yet provide diagnoses. The diag-
nosis of a disorder like unipolar depression requires
direct interaction between patient and clinician, espe-
cially since these models can not provide differential
diagnosis yet. However, differential diagnostics are
crucial, for example, due to the proximity of depres-
sive symptoms towards symptoms of other disorders,
such as the prodromal phase in schizophrenia (H
¨
afner,
2005). Despite this crucial limitation, screening sys-
tems might contribute to people seeking support and
therefore receiving a professional diagnosis and early
intervention.
4.2 Future Directions
In the future, we aim towards significantly increasing
our sample size to test our model more rigorously and
as well in the clinical environment. One of the pos-
sible directions is to evaluate its sensitivity to detect
score changes over time. This would provide our ap-
proach with an insightful, real-world dimension and
enable us to assess how well our model performs in
an environment that closely corresponds to its hypo-
thetical clinical use. Just like with any new technolog-
ical system, it would be recommended to conduct us-
ability and acceptance studies of such a model among
potential users and clinicians. A more comprehensive
analysis integrating audio and video data should be
considered in future work. To ensure data protection,
privacy and ethical issues of our approach, in the next
steps, we are planning to utilise open-source GPT-like
models that are locally executable, configurable and
more transparent and open to the broader scientific
community.
4.3 Implications for Clinical Practice
If the results can be replicated in a larger sample, it
would validate the potential for AI to aid clinicians
in diagnosing depression. Furthermore, new possi-
bilities for depression screening in the home could
emerge if the interview process could be automated.
Diagnosis via AI systems could be a first indicator
for people suffering from depression, especially in
rural areas with a low density of clinicians (Douthit
et al., 2015; Poß-Doering et al., 2021; Thom et al.,
2015). Implementing AI systems for depression de-
tection additionally provides particular advantages in
dealing with the prevalent societal stigma associated
with mental health issues. Stigma is very often the
reason why individuals with specific mental health is-
sues are discouraged from seeking help or speaking
about their problems (Brower, 2021). Future AI sys-
tems for depression detection could provide a stigma-
free, ethical, safe and unbiased tool for depression
screening.
AI-Supported Diagnostic of Depression Using Clinical Interviews: A Pilot Study
505

5 CONCLUSION
The prevalence of depression within the general pop-
ulace, coupled with the imperative of prompt inter-
vention, underscores the necessity of early diagnosis.
While conventional screening and diagnostic tech-
niques encounter several impediments, contemporary
AI systems have the capacity to surmount these chal-
lenges. Initial outcomes highlight the promise of NLP
in discerning depression from transcribed clinical in-
terview data. However, it is crucial to note that the
outlined method is designed as an early detection tool
to be accessible to a broader audience from the com-
fort of home, rather than as a diagnostic tool in a clin-
ical setting, which would necessitate additional certi-
fications. The pilot study stands out as a unique en-
deavour, achieving state-of-the-art promising results
on the small dataset. However, the substantiation of
these findings requires additional data to strengthen
the robustness of the study. In future, it is needed to
compare these results to the latest models, as it is cur-
rently hindered by the literature gap in the approaches
that follow the latest development trends.
ACKNOWLEDGEMENTS
This work is partially funded by VwV Invest BW - In-
novation II funding program. Project funding num-
ber: BW1 4056/03
REFERENCES
Berner, M. M., Kriston, L., Sitta, P., and H
¨
arter, M. (2008).
Treatment of depressive symptoms and attitudes to-
wards treatment options in a representative german
general population sample. International Journal of
Psychiatry in clinical practice, 12(1):5–10.
Brower, K. J. (2021). Professional stigma of mental health
issues: physicians are both the cause and solution.
Academic medicine, 96(5):635.
Bueno-Notivol, J., Gracia-Garc
´
ıa, P., Olaya, B., Lasheras,
I., L
´
opez-Ant
´
on, R., and Santab
´
arbara, J. (2021).
Prevalence of depression during the COVID-19 out-
break: A meta-analysis of community-based studies.
International journal of clinical and health psychol-
ogy, 21(1):100196.
Coley, R. L. and Baum, C. F. (2022). Trends in mental
health symptoms, service use, and unmet need for ser-
vices among us adults through the first 8 months of
the COVID-19 pandemic. Translational Behavioral
Medicine, 12(2):273–283.
Danner, M., Hadzic, B., Gerhardt, S., Ludwig, S., Uslu,
I., Shao, P., Weber, T., Shiban, Y., and R
¨
atsch, M.
(2023). Advancing mental health diagnostics: Gpt-
based method for depression detection. In Proceed-
ings Title, pages 1290–1296, Tsu City, Japan. 62nd
Annual Conference of the Society of Instrument and
Control Engineers of Japan (SICE).
Deshpande, M. and Rao, V. (2017). Depression detection
using emotion artificial intelligence. In 2017 inter-
national conference on intelligent sustainable systems
(iciss), pages 858–862. IEEE.
Devlin, J., Chang, M.-W., Lee, K., and Toutanova, K.
(2019). BERT: Pre-training of deep bidirectional
transformers for language understanding.
Douthit, N., Kiv, S., Dwolatzky, T., and Biswas, S. (2015).
Exposing some important barriers to health care ac-
cess in the rural usa. Public health, 129(6):611–620.
First, M. B. (2014). Structured clinical interview for the
dsm (SCID). The encyclopedia of clinical psychology,
pages 1–6.
Gr
¨
afe, K., Zipfel, S., Herzog, W., and L
¨
owe, B. (2004).
Screening psychischer st
¨
orungen mit dem “gesund-
heitsfragebogen f
¨
ur patienten (PHQ-D)“. Diagnos-
tica, 50(4):171–181.
Grandini, M., Bagli, E., and Visani, G. (2020). Metrics for
multi-class classification: an overview. arXiv preprint
arXiv:2008.05756.
Gratch, J., Artstein, R., Lucas, G. M., Stratou, G., Scherer,
S., Nazarian, A., Wood, R., Boberg, J., DeVault, D.,
Marsella, S., et al. (2014). The distress analysis in-
terview corpus of human and computer interviews. In
LREC, pages 3123–3128. Reykjavik.
Hamilton, M. (1960). A rating scale for depression. Journal
of neurology, neurosurgery, and psychiatry, 23(1):56.
H
¨
afner, H. (2005). Schizophrenia and depression: Chal-
lenging the paradigm of two separate diseases—a con-
trolled study of schizophrenia, depression and healthy
controls. Schizophrenia Research, 77:11–24.
Institute for Health Metrics and Evaluation (2023).
Global burden of disease study results.
https://vizhub.healthdata.org/gbd-results. Accessed:
10/08/2023.
Islam, M. R., Kabir, M. A., Ahmed, A., Kamal, A. R. M.,
Wang, H., and Ulhaq, A. (2018). Depression detec-
tion from social network data using machine learning
techniques. Health information science and systems,
6:1–12.
Itai, A., Papadimitriou, C. H., and Szwarcfiter, J. L. (1982).
Hamilton paths in grid graphs. SIAM Journal on Com-
puting, 11(4):676–686.
Jacob, V., Chattopadhyay, S. K., Sipe, T. A., Thota, A. B.,
Byard, G. J., Chapman, D. P., Force, C. P. S. T., et al.
(2012). Economics of collaborative care for man-
agement of depressive disorders: a community guide
systematic review. American journal of preventive
medicine, 42(5):539–549.
Jacobi, F., H
¨
ofler, M., Meister, W., and Wittchen, H. (2002).
Prevalence, detection and prescribing behavior in de-
pressive syndromes. a german federal family physi-
cian study. Der Nervenarzt, 73(7):651–658.
Juba, B. and Le, H. S. (2019). Precision-recall versus accu-
racy and the role of large data sets. In Proceedings of
HUCAPP 2024 - 8th International Conference on Human Computer Interaction Theory and Applications
506

the AAAI conference on artificial intelligence, volume
33-01, pages 4039–4048.
Kim, J. and Hwang, I. C. (2020). Drawing guidelines for
receiver operating characteristic curve in preparation
of manuscripts. Journal of Korean medical science,
35(24).
Kraus, C., Kadriu, B., Lanzenberger, R., Zarate Jr, C. A.,
and Kasper, S. (2019). Prognosis and improved out-
comes in major depression: a review. Translational
psychiatry, 9(1):127.
Kroenke, K., Spitzer, R. L., and Williams, J. B. (2001). The
PHQ-9: validity of a brief depression severity mea-
sure. Journal of general internal medicine, 16(9):606–
613.
Kroenke, K., Strine, T. W., Spitzer, R. L., Williams, J. B.,
Berry, J. T., and Mokdad, A. H. (2009). The PHQ-8
as a measure of current depression in the general pop-
ulation. Journal of affective disorders, 114(1-3):163–
173.
Liu, Y., Ozodiegwu, I. D., Yu, Y., Hess, R., and Bie, R.
(2017). An association of health behaviors with de-
pression and metabolic risks: data from 2007 to 2014
us national health and nutrition examination survey.
Journal of affective disorders, 217:190–196.
OpenAI (2022). Whisper. https://github.com/openai/
whisper.
Poß-Doering, R., Hegelow, M., Borchers, M., Hartmann,
M., Kruse, J., Kampling, H., Heuft, G., Spitzer, C.,
Wild, B., Szecsenyi, J., et al. (2021). Evaluating the
structural reform of outpatient psychotherapy in ger-
many (es-rip trial)-a qualitative study of provider per-
spectives. BMC Health Services Research, 21(1):1–
14.
Roberts, L. W., Chan, S., and Torous, J. (2018). New tests,
new tools: mobile and connected technologies in ad-
vancing psychiatric diagnosis. NPJ Digital Medicine,
1(1):20176.
Rodrigues Makiuchi, M., Warnita, T., Uto, K., and Shin-
oda, K. (2019). Multimodal fusion of bert-cnn and
gated cnn representations for depression detection. In
Proceedings of the 9th International on Audio/Visual
Emotion Challenge and Workshop, pages 55–63.
Roh, T., Hong, S., and Yoo, H.-J. (2014). Wearable de-
pression monitoring system with heart-rate variability.
In 2014 36th Annual International Conference of the
IEEE Engineering in Medicine and Biology Society,
pages 562–565. IEEE.
Schmitt, A., Kulzer, B., and Hermanns, N. (2015).
German version of the GRID Hamilton Rat-
ing Scale for Depression (GRID-HAMD).
10.13140/RG.2.1.3569.0725.
Senn, S., Tlachac, M., Flores, R., and Rundensteiner, E.
(2022). Ensembles of BERT for depression classifica-
tion. In 2022 44th Annual International Conference of
the IEEE Engineering in Medicine & Biology Society
(EMBC), pages 4691–4694.
Sheehan, D. V., Lecrubier, Y., Sheehan, K. H., Amorim, P.,
Janavs, J., Weiller, E., Hergueta, T., Baker, R., Dun-
bar, G. C., et al. (1998). The mini-international neu-
ropsychiatric interview (mini): the development and
validation of a structured diagnostic psychiatric inter-
view for DSM-IV and ICD-10. Journal of clinical
psychiatry, 59(20):22–33.
Shin, D., Kim, K., Lee, S.-B., Lee, C., Bae, Y. S., Cho, W. I.,
Kim, M. J., Hyung Keun Park, C., Chie, E. K., Kim,
N. S., et al. (2022). Detection of depression and sui-
cide risk based on text from clinical interviews using
machine learning: possibility of a new objective diag-
nostic marker. Frontiers in psychiatry, 13:801301.
Smarr, K. L. and Keefer, A. L. (2011). Measures of
depression and depressive symptoms: Beck depres-
sion inventory-II (BDI-II), center for epidemiologic
studies depression scale (CES-D), geriatric depression
scale (GDS), hospital anxiety and depression scale
(HADS), and patient health questionnaire-9 (PHQ-9).
Arthritis care & research, 63(S11):S454–S466.
Smith, L. T., Levita, L., Amico, F., Fagan, J., Yek, J. H.,
Brophy, J., Zhang, H., and Arvaneh, M. (2020). Us-
ing resting state heart rate variability and skin conduc-
tance response to detect depression in adults. In 2020
42nd annual international conference of the IEEE
engineering in medicine & biology society (EMBC),
pages 5004–5007. IEEE.
Thom, J., Bretschneider, J., M
¨
ullender, S., Becker, M., and
Jacobi, F. (2015). Regionale variationen der ambu-
lanten prim
¨
ar-und fach
¨
arztlichen versorgung psychis-
cher st
¨
orungen. Die Psychiatrie, 12(04):247–254.
Torous, J., Staples, P., and Onnela, J.-P. (2015). Realizing
the potential of mobile mental health: new methods
for new data in psychiatry. Current psychiatry reports,
17:1–7.
Victor, E., Aghajan, Z. M., Sewart, A. R., and Christian,
R. (2019). Detecting depression using a framework
combining deep multimodal neural networks with a
purpose-built automated evaluation. Psychological
assessment, 31(8):1019.
Villatoro-Tello, E., Ramirez-de-la Rosa, G., G
´
atica-P
´
erez,
D., Magimai.-Doss, M., and Jim
´
enez-Salazar, H.
(2021). Approximating the mental lexicon from clin-
ical interviews as a support tool for depression detec-
tion. In Proceedings of the 2021 International Con-
ference on Multimodal Interaction, pages 557–566.
Williams, J. B., Kobak, K. A., Bech, P., Engelhardt, N.,
Evans, K., Lipsitz, J., Olin, J., Pearson, J., and Kalali,
A. (2008). The GRID-HAMD: standardization of the
hamilton depression rating scale. International clini-
cal psychopharmacology, 23(3):120–129.
Zhang, B., Zhou, W., Cai, H., Su, Y., Wang, J., Zhang, Z.,
and Lei, T. (2020). Ubiquitous depression detection of
sleep physiological data by using combination learn-
ing and functional networks. IEEE Access, 8:94220–
94235.
Zhang, T., Schoene, A. M., Ji, S., and Ananiadou, S. (2022).
Natural language processing applied to mental illness
detection: a narrative review. NPJ digital medicine,
5(1):46.
AI-Supported Diagnostic of Depression Using Clinical Interviews: A Pilot Study
507
