
Prediction of Heart Disease Severity Using Hierarchically-Structured
Machine-Learning Models with Feature Space Reduction
Ayami Kiuchi
1
, Tomoya Fujita
2
and Hayato Yamana
3a
1
Department of Computer Science and Engineering, Waseda University, Tokyo, Japan
2
Department of Computer Science and Communications Engineering, Waseda University, Tokyo, Japan
3
Faculty of Science and Engineering, Waseda University, Tokyo, Japan
Keywords: Heart Disease, Hierarchical Prediction, Feature Selection, Feature Space Reduction, mRMR, SMOTE.
Abstract: Heart disease is the primary cause of death worldwide according to the 2019 statistics published by the World
Health Organization (WHO), with roughly 8.9 million people dying annually. Predicting the likelihood and
severity of this disease leads to earlier detection and helps reduce the workload of medical professionals.
Previous studies have adopted a one-time classification that is insufficient to predict heart disease severity.
This study proposes a novel classification method to enhance the prediction accuracy of heart disease by
using: 1) a hierarchical binary-classification technique to classify the severity in order from the lowest level
and 2) a data-preprocessing technique to transform continuous values into binary values based on medical
knowledge and statistics information to decrease the feature space. An experimental evaluation of the heart-
disease dataset from the UC Irvine (UCI) machine-learning repository confirms that the proposed method
achieves the highest accuracy at 100% in predicting the presence of heart disease and at 93.13% in its severity
level. In addition, the proposed method achieved 96.67%, 91.25%, 90.59%, and 93.64% accuracy for severity
prediction in the Cleveland, Hungarian, Long-Beach-VA, and Switzerland datasets, respectively.
1 INTRODUCTION
Heart disease is the primary cause of death compared
with other illnesses according to a 2019 study by the
World Health Organization (WHO, 2019), with
approximately 8.9 million annual deaths. Compared
with two decades ago, heart disease-related deaths
have increased by two million, prompting the need for
immediate action. Early detection and treatment of
heart disease are essential to prevent death. However,
there is a significant disparity in the number of
physicians worldwide, with approximately 70 doctors
per 10,000 individuals in countries such as Sweden
and less than one doctor per 10,000 individuals in
African countries (WHO, 2019). This statistic
highlights a severe and ongoing shortage of medical
personnel. Consequently, efforts must be made to
address this shortage and reduce fatalities resulting
from heart disease by implementing diagnostic
prediction systems to assist medical professionals.
The UC Irvine (UCI) machine-learning repository
(UC Irvine Machine Learning Repository, 1988)
a
https://orcid.org/0000-0001-7542-4826
provides the most commonly used dataset for heart-
disease prediction, which targets the predictions of
presence and severity of heart disease.
The difficulty in predicting the presence and
severity of heart disease is that: 1) the amount of data
to be analyzed is small (920 in the UCI dataset) with
many features (76 in the UCI dataset) and 2) the
dataset is imbalanced in the severity of heart disease.
To address the prediction of heart disease,
previous studies engaged in dimensionality reduction
of features used for the machine-learning models
(Gupta et al., 2020; Balamurugan, Ratheesh, and
Venila, 2022). Wang et al. (Wang, Lauri, and Hassani,
2022) investigated five dimensionality reduction
methods for predicting the presence of heart disease
and concluded that minimum redundancy-maximum
relevance (mRMR) was the best.
In addition, previous studies have adopted the
synthetic minority oversampling technique (SMOTE)
to balance the positive and negative data for training
the model to increase prediction accuracy (Abdellatif
et al., 2022).
662
Kiuchi, A., Fujita, T. and Yamana, H.
Prediction of Heart Disease Severity Using Hierarchically-Structured Machine-Learning Models with Feature Space Reduction.
DOI: 10.5220/0012436700003657
Paper published under CC license (CC BY-NC-ND 4.0)
In Proceedings of the 17th International Joint Conference on Biomedical Engineering Systems and Technologies (BIOSTEC 2024) - Volume 2, pages 662-670
ISBN: 978-989-758-688-0; ISSN: 2184-4305
Proceedings Copyright © 2024 by SCITEPRESS – Science and Technology Publications, Lda.

The feature dimensionality reduction and SMOTE
techniques increased prediction accuracy; however,
they were unable to accurately predict the severity of
heart disease. Previous studies have adopted a one-
time classification, i.e., targetting all the data
simultaneously to classify severity levels from 0
(non-heart disease) to 4 (the highest severity of heart
disease), such as the work done by Abdellatif et al.
(Abdellatif et al., 2022) that adopted an extra tree.
Our intuition is that the features to classify heart-
disease severity levels differ depending on levels 0 to
4, which leads to the idea that relevant features are
better adapted depending on which severity levels to
classify. Therefore, a hierarchical binary
classification (HBC) is adopted, starting the
classifications from the lowest severity (large number
of patients) to the highest severity (small number of
patients). This classification technique also
beneficially makes the binary classification for
imbalanced data closer to balanced data. That is, the
first prediction targets the classification between level
0 and the rest (levels 1 to 4), followed by level 1 and
the rest (levels 2 to 4), then level 2 and the rest (levels
3 to 4), and finally level 3 and 4. This approach allows
for the adoption of relevant features in each
prediction. In addition, medical knowledge and
statistical information are adopted to decrease the
feature space to increase the prediction accuracy.
Specifically, the continuous values are converted to
binary data in the data-preprocessing step,
contributing to the efficient learning of the model.
mRMR is also adopted as a dimensionality-
reduction method owing to its exceptional
performance (Wang et al., 2022). Additionally,
SMOTE is adopted to balance the dataset for
prediction, as in the work of Lakshmi et al. (Lakshmi
and Devi, 2023).
Our contributions are summarized below:
1) A novel classification method is proposed to
predict the severity of heart disease in
cooperation with HBC to maximize the use of
features that characterize each severity level.
2) Medical knowledge and statistical information
are adopted to decrease the feature space.
3) Experimental evaluation using the heart-disease
dataset from the UCI machine-learning
repository confirmed the highest severity level
prediction accuracy of 93.13%. When specialized
in the Cleveland dataset, the proposed approach
achieved an accuracy of 96.67% compared with
that of a state-of-the-art method (95.73%).
The remainder of this paper is organized as
follows. The related work is described in Section 2
and the dataset used in this study is presented in
Section 3. The methodology is presented in Section 4,
followed by an experimental evaluation in Section 5.
Finally, the study is concluded in Section 6.
2 RELATED WORK
The heart-disease dataset provided by the UCI
machine-learning repository was originally published
by Janosi et al. in 1988, which is the most commonly
used dataset on heart-disease prediction. The
prediction targets determine the existence and the
severity level of heart disease. Recent studies
utilizing the UCI dataset are summarized in Table 1.
The first eight studies predicted the presence of
heart disease. Akgül et al. (Akgül, Sönmez, and
Özcan, 2020) proposed combining an artificial neural
network (ANN) with a genetic algorithm. Gupta et al.
(Gupta et al., 2020) proposed a feature selection
method for data in which quantitative and qualitative
variables were mixed through a factor analysis of
mixed data (FAMD). Lohumi et al. (Lohumi et al.,
2020) used normalization for data preprocessing and
found that the ensemble learning of random forests
(RFs) achieved better accuracy than those of other
ensemble learning methods. Xiao et al. (Xiao et al.,
2020) proposed the use of a deep-residual neural
network and found it to be superior to conventional
machine-learning methods. Rao et al. (Rao, Gopal,
and Lata, 2021) found that each data from four
locations had a distinct suitable model to predict.
Balamurugan et al. (Balamurugan et al., 2022) found
that using an enhanced deep-genetic algorithm as the
classification method and stochastic gradient
boosting-recursive feature elimination (SGB-RFE) as
the feature selection method improved accuracy.
Pratama et al. (Pratama et al., 2022) proposed using
the F-score for feature selection and gradient tree
boosting for classification.
The state-of-the-art method (Wang et al., 2022)
achieved 100%, 98.3%, and 99.0% accuracy in
predicting the presence of heart disease in the
Cleveland, Hungarian, and Long-Beach-VA datasets,
respectively. They pointed out that the high
dimensionality of features prevented the
improvement of accuracy. Therefore, they compared
five types of dimensionality reduction methods:
Principal Component Analysis, Linear Discriminant
Analysis, Kendall, RF, and mRMR. Then, they
concluded that mRMR was the best.
The remaining seven studies predicted the
severity of heart disease. Amin et al. (Amin, Chiam,
and Varathan, 2019) proposed Vote, which used the
identified significant features and a best-performing
data-mining technique. Mohan et al. (Mohan,
Thirumalai, and Srivastava, 2019) proposed an RF
Prediction of Heart Disease Severity Using Hierarchically-Structured Machine-Learning Models with Feature Space Reduction
663

Table 1: Research on the prediction of heart disease presence and severity.
Reference Dataset Prediction Feature Selection Classifie
r
Accuracy
(
%
)
(
Ak
g
ül et al., 2020
)
Clevelan
d
Presence None ANN-GA 95.82
(
Gu
p
ta et al., 2020
)
Clevelan
d
Presence FAMD RF 93.44
(
Lohumi et al, 2020
)
Clevelan
d
Presence None RF
(
Ensemble
)
96.26
(Xiao et al., 2020) Clevelan
d
Presence None Deep Recurrent
Neural Networ
k
95.00
(Rao et al., 2021) Clevelan
d
Hungarian
Long-Beach-VA
Switzerland
Presence None
K
-nearest
neighbors
(kNN), XGBoost
(XGB), and
AdaBoost
(
AB
)
86.81
84.26
82.20
98.00
(Balamurugan et al., 2022) Clevelan
d
Presence SGB-RFE Enhanced Deep
Genetic
Al
g
orith
m
98.36
(
Pratama et al., 2022
)
Clevelan
d
Presence F-score GTB 99.00
(Wang et al., 2022) Cleveland
Hungarian
Lon
g
-Beach-VA
Presence mRMR RF, ANN, GB,
and SVM
100.0
98.3
99.0
(
Abdellatif et al.,2022
)
Clevelan
d
Severit
y
None ET 95.73
(Amin et al., 2019) Clevelan
d
Severity Brute-force
search
Vote 87.41
(
Mohan et al., 2019
)
Clevelan
d
Severit
y
DT entro
py
HRFLM 88.70
(
Kibria and Matin, 2022
)
Clevelan
d
Severit
y
None LR+RF 75.41
(Yuan et al., 2022) Clevelan
d
Hungarian
Long-Beach-VA
Switzerlan
d
Severity None Bagging-Fuzzy-
GBDT
90.00
(for all datasets)
(Satyanan
d
am and
Sat
y
anara
y
ana, 2021
)
Clevelan
d
Severity None RF 81.99
(Lakshmi and Devi, 2023) Cleveland,
Hungarian
Long-Beach-VA
Switzerlan
d
Severity Genetic
Algorithm
SVM 82.00
(for all datasets)
with Linear hybrid model (HRFLM) with decision
tree (DT) entropy to select features. Kibria and Matin
(Kibria and Matin, 2022) used an ensemble model
with logistic regression (LR) and RF. Yuan et al.
(Yuan et al., 2022) proposed a begging-fuzzy gradient
boosting DT (GBDT) as the classifier. Satyanandam
and Satyanarayana (Satyanandam and
Satyanarayana, 2021) proposed using polynomial
regression. Lakshmi and Devi (Lakshmi and Devi,
2023) used an SVM after future selection by a genetic
algorithm.
A state-of-the-art method adopting extra trees
(ET) was proposed by Abdellatif et al. (Abdellatif et
al., 2022), which achieved 95.73% accuracy in
classifying patients into five heart-disease severities
using the Cleveland dataset.
Although the presence prediction showed a high
accuracy (close to 100%), the accuracy of the severity
prediction was low (see Table 1) and could not be
used for diagnosis. Thus, the accuracy of predicting
heart disease severity is indispensable to improve.
3 DATASETS
The UCI machine-learning repository provides the
most commonly used heart-disease dataset and
comprises 76 patient features from four locations, as
shown in Table 2.
Table 2: Heart-disease dataset from the UCI machine-
learning repository. (UC Irvine Machine Learning
Repository, 1988).
Location
of
Dataset
#of participants
Severity level (0:no-heart
disease, 1:low, 4:high)
Total
0 1 2 3 4
Cleveland 164 55 36 35 13 303
Hungarian 188 37 26 28 15 294
Long-Beach-VA 51 56 41 42 10 200
Switzerland 8 48 32 30 5 123
Total 411 196 135 135 43 920
HEALTHINF 2024 - 17th International Conference on Health Informatics
664
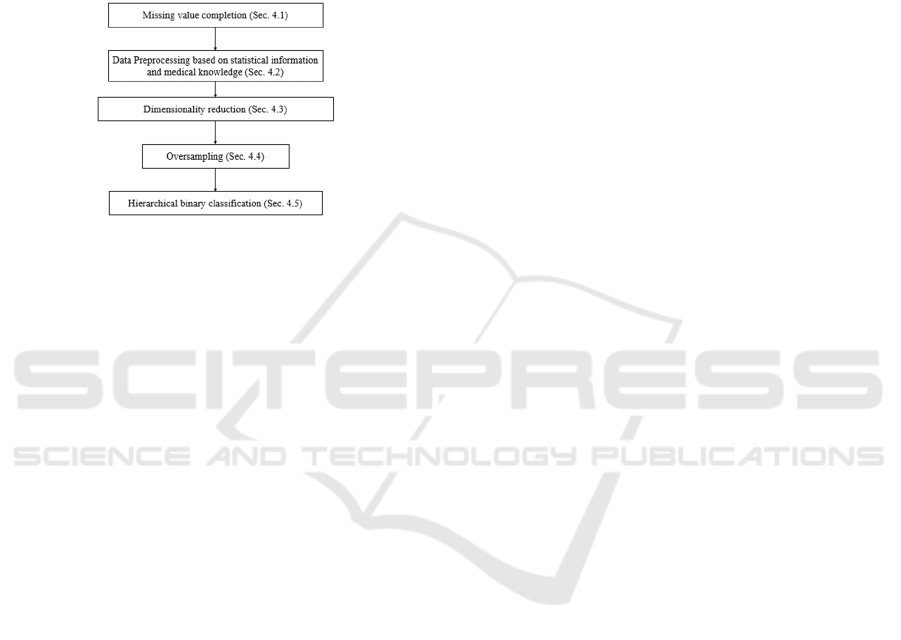
4 PROPOSED METHOD
Figure 1 provides an overview of the proposed steps
for predicting the severity of heart disease. The main
contributions of this study are discussed in Sections
4.2 and 4.5, where Section 4.2 proposes a new data
preprocessing technique to decrease the feature space,
and Section 4.5 proposes a hierarchically-structured
machine-learning model, named hierarchical binary
classification (HBC).
Figure 1: Proposed method.
4.1 Missing Value Completion
Multiple imputation by chained equation (MICE),
known as switching or sequential regression
multivariate imputation, was applied to impute
missing values for each feature, similar to the work of
Rani et al. (Rani, Kumar, and Jain, 2021). We used
the R package of MICE (3.16.0), in which the number
of pseudo-data was set to 10 and predictive mean
matching imputation was used. MICE was not
applied if over 90% of the columns for a single feature
contained the default missing value of -9. Instead, the
columns were filled with the default value of -9 owing
to insufficient information to apply MICE.
4.2 Data Preprocessing
We propose a new data preprocessing technique,
named PRE, to eliminate outliers and decrease feature
ranges. The continuous values of each feature are
reduced to the binary values of 0 and 1 by using
medical knowledge and statistical information, where
the values in the range of heart-disease susceptibility
to 1 and the values in the range of heart disease non-
susceptibility to 0.
First, the medical knowledge for age, cigarettes
per day (cigs), and years as a smoker (years) were
adopted. People aged 65 years and above are more
susceptible to heart disease (National Center for
Health Statistics, 2023). Consequently, the age
feature was replaced with 1 if the age was 65 years
and above; otherwise, it was replaced with 0.
According to the National Heart, Lung, and Blood
Institute (National Heart, Lung, and Blood Institute,
2022), smoking harms blood vessels and the heart;
thus, each value of cigs and years was set to 1 if the
value was over 0; otherwise, it was set to 0.
Second, the remaining features were analyzed to
determine whether continuous values could be
replaced with binary values, contributing to reducing
the feature space. Algorithm 1 represents the detailed
steps. In Algorithm 1, an optimal threshold value is
selected to replace the continuous value with 0 or 1.
We hypothesize that the continuous value is
related to the target label to classify (severity level).
In other words, we hypothesize that if the continuous
values are split into the first group and the second
group using some appropriate threshold value, the
first group tends to contain the data of label-A, e.g., a
lower severity level, and the second group contains
the data of label-B, e.g., higher severity level. If an
appropriate threshold value is selected, there should
be a large difference between the distribution of the
labels in the first and second groups. Thus, we use p-
values to confirm the existence of a large difference
in the distribution between label-A and label-B,
where label-A is represented by 0 and label-B is
represented by 1. In addition, we confirm the
distribution of continuous values between label-A
and label-B in the same way. If the p-value of binary
values is smaller than that of continuous values, we
adopted the threshold value that yields the smallest p-
value (<0.05). Note that if no threshold satisfies
p<0.05, we continue using the continuous values.
Input: cv
i
// continuous values larger than 0 (1<=i<=N).
Output: optimal_th // an optimal threshold value to split
the continuous values into binary; -1 represents no splitting,
i.e., the continuous values should be used as they are.
min_p = 1; // initialization of a temporal value
optimal_ph=-1; // initialization of a temporal value
min_cv = minimum(cv
i
) for all i, where 1<=i<=N;
max_cv = maximum(cv
i
) for all i, where 1<=i<=N;
for th=min_cv to max_cv // candidate threshold value
1st_group={sl
i
| sl
i
=label of cv
i,
where cv
i
<=th};
2nd_group={sl
i
| sl
i
=label of cv
i,
where cv
i
>th};
// labels are represented by binaries (0 and 1).
p-value is calculated between 1st and 2nd groups;
if ((p_value<min_p) AND (p_value < 0.05)) then
min_p = p_value; // update minimum p-value
optimal_th=th; // update an optimal th
end if
end for
return optimal_th;
Algorithm 1: Optimal threshold calculation.
Prediction of Heart Disease Severity Using Hierarchically-Structured Machine-Learning Models with Feature Space Reduction
665

4.3 Dimensionality Reduction
mRMR was used for dimensionality reduction. The
number of features was set to 8, 10, 12, 14, 16, 18,
and 20 to compare the accuracies. mRMR was
performed for each severity level and location,
followed by selecting the best features.
4.4 Oversampling
The datasets were imbalanced, as shown in Table 2.
Similar to the work done by Abdellatif et al.
(Abdellatif et al., 2022), SMOTE was adopted to
balance the amount of data in each training.
Oversampling using SMOTE was conducted on the
training data to balance the number of data when
conducting 10-fold cross-validation. The SMOTE
parameter, random_state, was set as 42.
4.5 Hierarchical Binary Classification
A hierarchically-structured machine-learning model
was proposed for HBC, as shown in Figure 2. The
proposed model predicts severity levels using
features fitted to each severity level. Previous studies,
such as that of Lakshmi and Devi (Lakshmi and Devi,
2023), used a one-time classification technique. For
example, their study classified severity levels from 0
to 4, targeting all data simultaneously. Thus, they
could not tune the features to classify targeting at each
severity level. This led to the idea that relevant
features could be better adapted depending on the
severity level.
Here, the circled numbers indicate the predicted
results of the severity levels. The classification
process was as follows:
1) All data were divided into non-heart disease
(0) and heart disease (1 to 4).
2) The heart disease data classified in Step 1 were
divided into level 1 and above (2 to 4).
3) The heart disease data were divided into level
2 and above (3 to 4).
4) The heart disease data were divided into levels
3 and 4.
The proposed method was expected to be more
precise than the previous approach that
simultaneously divides the severity levels from 0 to 4.
This is because each level may have different relevant
features for prediction. Furthermore, another
advantage of the proposed method is that a nearly
balanced dataset can be prepared at each step.
The scikit-learn library version 1.0.2
(https://scikit-learn.org/stable/) was used to adopt the
following seven classic machine-learning methods to
select the best-performing one: Logistic Regression
(LR), Decision Tree Classifier (DT), AdaBoost (AB),
Random Forest (RF), K-Nearest-Neighbor (kNN),
XGBoost (XGB), and Support Vector Machine
(SVM). It should be noted that a 10-fold cross-
validation method was adopted, and parameter tuning
was performed for each model.
Figure 2: The proposed hierarchical binary classification.
5 EVALUATION
Experiments were conducted to confirm whether the
proposed method improved accuracy.
5.1 Metrics
The accuracy, mean absolute error (MAE), and
maximum absolute error (MAXAE) were adopted as
evaluation metrics. The MAE shows the extent to
which the predicted severity level differs from the
actual level, which is expressed as:
∑|
|
(1)
where
denotes the predicted level,
denotes
the actual level, and denotes the number of data.
The MAXAE shows how the maximum value of the
predicted severity level differs from the actual level,
which is expressed as:
max
|
|
(2)
5.2 Baseline
The results of the baseline are listed in Table 3. The
number of features in Table 3 indicates the best
number of features chosen from 8, 10, 12, 14, 16, 18,
and 20. The model column in Table 3 lists the model
that achieved the best accuracy among the LR, DT,
AB, RF, kNN, XGB, and SVM.
As shown in Table 3, a small number of features
resulted in the best accuracy, and the best machine-
learning model varied for individual datasets. Besides,
the precision varied for the levels owing to the
number of patients and characteristics of the data,
HEALTHINF 2024 - 17th International Conference on Health Informatics
666

although the accuracy of non-heart disease (level 0)
was high in all locations.
5.3 Proposed Methods
PRE Method. The results of the proposed PRE
method are listed in Table 4. By comparing Tables 3
and 4, the proposed PRE method was confirmed to be
more accurate in three locations, where the accuracy
increased and the MAE decreased. However, the
accuracy decreased in Switzerland while the MAE
increased because the amount of data before
oversampling in Switzerland was smaller than in
other locations. Hence, the distribution of features
was different in the training and test data, and some
features were no longer relevant to the diagnosis of
the test data when converted to binary data.
HBC Method. The results of the proposed HBC
method are listed in Table 5. By comparing Tables 3
and 5, it was confirmed that the accuracy improved
and the MAE decreased at all locations. In addition,
the MAXAE was decreased at 3 locations, indicating
that the predicted rank was closer to the actual rank
than in the baseline. The trend in the number of
features was that a higher number of features
provided better accuracy when predicting (1) vs. (2
–
4) and (2) vs. (3–4). However, a smaller number of
features provided better accuracy when predicting (0)
vs. (1
–4) and (3) vs. (4). This was owing to the similar
trends in the values of levels (1), (2), and (3). A
comparison of Tables 3 and 5 shows that the precision
improved at all levels.
HBC+PRE Method. The results of the proposed
HBC+PRE method are listed in Table 6. Compared
with the results of the other methods, combining the
two proposed techniques exhibited the best results
because the accuracy and MAE values were the best.
The precision for each level was also the best
compared to the other methods.
5.4 Summary
The experimental results for severity and presence
prediction are summarized in Tables 7 and 8,
respectively. The proposed HBC+PRE method
achieved the best accuracy for all datasets. The MAE
and MAXAE confirmed that HBC successfully
narrowed down the errors of predicted levels.
Table 3: Results of the baseline.
Location of
Dataset
# of
features
Model Accuracy MAE MAXAE Precision of each severity level
0 1 2 3 4
Cleveland 8 LR 81.43 0.200 2 100.00 87.17 28.00 66.33 100.00
Hungarian 14 XGB 67.92 0.513 4 86.69 29.00 32.50 51.17 11.67
Long-Beach-VA 8 LR 79.41 0.282 4 98.00 93.33 53.83 72.00 65.00
Switzerland 10 DT 89.09 0.091 1 100.00 90.00 91.67 88.33 100.00
Table 4: Results of the proposed PRE method.
Location of
Dataset
# of
features
Model Accuracy MAE MAXAE Precision of each severity level
0 1 2 3 4
Cleveland 8 DT 86.19 0.148 2 94.84 89.17 45.67 75.00 100.00
Hungarian 12 XGB 69.17 0.433 4 91.40 29.08 19.17 56.50 20.00
Long-Beach-VA 8 DT 86.47 0.188 3 94.67 93.00 76.17 88.17 35.00
Switzerland 14 DT 85.46 0.164 2 90.00 80.00 89.17 88.33 100.00
Prediction of Heart Disease Severity Using Hierarchically-Structured Machine-Learning Models with Feature Space Reduction
667

Table 5: Results of the proposed HBC method.
Location of
Dataset
Levels to
Classify
# of
Feature
Model
Accuracy
MAE
MAXAE
Precision of each severity level
0 1 2 3 4
Clevelan
d
0, 1-4 8 LR
91.90 0.081 1 100.0 90.17 57.50 88.33 100.0
1, 2-4 20 LR
2, 3-4 14 LR
3, 4 8 DT
Hungarian 0, 1-4 10 SVM
87.92 0.133 3 100.0 78.33 54.00 78.50 40.00
1, 2-4 12 LR
2, 3-4 18 LR
3, 4 18 kNN
Long-
Beach-VA
0, 1-4 16 DT
88.24 0.118 1 100.0 93.33 69.17 87.50 100.0
1, 2-4 12 LR
2, 3-4 8 LR
3, 4 8 DT
Switzerlan
d
0, 1-4 8 kNN
89.09 0.127 2 100.0 94.67 90.83 80.00 90.00
1, 2-4 10 AB
2, 3-4 12 AB
3, 4 8 LR
Table 6: Results of the proposed HBC+PRE method.
Location of
Dataset
Levels to
Classify
# of
Feature
Model
Accuracy
MAE
MAXAE
Precision of each severit
y
level
0 1 2 3 4
Clevelan
d
0, 1-4 8 DT 96.67 0.043 1 100.0 96.00 80.00 95.00 100.0
1, 2-4 20 XGB
2, 3-4 14 LR
3, 4 8 LR
Hungarian 0, 1-4 10 SVM 91.25 0.096 2 100.0 86.00 55.67 84.17 70.00
1, 2-4 8 AB
2, 3-4 16 LR
3, 4 16 LR
Long-
Beach-VA
0, 1-4 16 AB 90.59 0.094 1 100.0 96.67 75.83 91.00 100.0
1, 2-4 8 LR
2, 3-4 14 SVM
3, 4 8 LR
Switzerlan
d
0, 1-4 12 AB 93.64 0.091 3 100.0 96.00 95.00 90.00 90.00
1, 2-4 18 AB
2, 3-4 12 AB
3, 4 8 LR
Table 7: Summary of results for severity prediction. (An asterisk (*) in the accuracy column indicates a statistically significant
difference (p<0.05) compared with the baseline after paired t-tests).
Location of Dataset Accuracy Precision Recall F
1
MCC MAE MAXAE
Clevelan
d
Baseline 81.43 87.49 81.43 81.67 0.723 0.200 2
HBC+PRE 96.67* 96.86 96.67 96.44 0.950 0.043 1
(Abdellatif et
al.,2022
)
95.73 96.35 95.73 95.78 0.934 N/A N/A
Hungarian Baseline 67.92 67.39 67.92 66.17 0.442 0.513 4
HBC+PRE 91.25* 91.33 91.25 90.45 0.851 0.096 2
Long-
Beach-VA
Baseline 79.41 80.77 79.41 78.01 0.746 0.282 4
HBC+PRE 90.59* 92.64 90.59 90.67 0.884 0.094 1
Switzerlan
d
Baseline 89.09 91.33 89.09 88.92 0.862 0.091 1
HBC+PRE 93.64 94.45 93.64 93.02 0.921 0.091 3
All Baseline 77.61 79.95 77.61 76.78 0.655 0.306 4
HBC+PRE 93.13 93.78 93.13 92.73 0.899 0.078 3
HEALTHINF 2024 - 17th International Conference on Health Informatics
668

Table 8: Summary of accuracy results (Presence).
Location of
Dataset
Baseline PRE
(p
ro
p
osed
)
HBC
(p
ro
p
osed
)
HBC+PRE
(p
ro
p
osed
)
Wang et al. (Wang et al.,
2022
)
Cleveland 98.09 95.71 100.00 100.00 100.00
Hungarian 82.92 85.00 100.00 100.00 98.30
Long-Beach-VA 98.82 99.41 100.00 100.00 99.00
Switzerland 100.00 96.36 100.00 100.00 N/A
6 CONCLUSION
Heart disease is a global cause of death and its
prediction can contribute to its early diagnosis. This
study assessed the severity of heart disease using two
proposed techniques to increase the prediction
accuracy: 1) an HBC technique to classify severity in
order from the lowest level, and 2) a PRE technique
to transform continuous values into binary values
based on whether the values were likely to cause heart
disease. Using 10-fold cross-validation, the proposed
method achieved 96.67%, 91.25%, 90.59%, and
93.64% accuracy for severity prediction in the
Cleveland, Hungarian, Long-Beach-VA, and
Switzerland datasets, respectively, which were the
highest accuracies compared with previous research.
Our proposed method also achieved the smallest
mean absolute error (MAE). It is worth noting that the
accuracy of predicting the presence or absence of
heart disease was 100% in all datasets. The results of
this study can be used to improve the early detection
and treatment of heart disease and ultimately reduce
the number of deaths in the future.
ACKNOWLEDGMENTS
A part of this work was supported by JSPS
KAKENHI, Grant-in-Aid for Scientific Research
(A), Grant Number 22H00067.
REFERENCES
Abdellatif, A. et al. (2022). An Effective Heart Disease
Detection and Severity Level Classification Model
Using Machine Learning and Hyperparameter
Optimization Methods. IEEE Access, vol. 10. 79974-
79985. Doi: 10.1109/ACCESS.2022.3191669.
Akgül, M., Sönmez, Ö.E., and Özcan, T. (2020). Diagnosis
of Heart Disease Using an Intelligent Method: A
Hybrid ANN – GA Approach. Intelligent and Fuzzy
Techniques in Big Data Analytics and Decision Making,
vol. 1029. 1250-1257. Doi: 10.1007/978-3-030-23756-
1_147.
Amin, M.S., Chiam, Y.K., and Varathan, K.D. (2019).
Identification of significant features and data mining
techniques in predicting heart disease. Telematics and
Informatics, vol. 36. 82-93. Doi: 10.1016/j.tele.2018.1
1.007.
Balamurugan, R., Ratheesh, S. and Venila, Y.M. (2022).
Classification of heart disease using adaptive Harris
hawk optimization-based clustering algorithm and
enhanced deep genetic algorithm. Soft Computing, vol.
26. 2357-2373. Doi: 10.1007/s00500-021-06536-0.
Gupta, A. et al. (2020). MIFH: A Machine Intelligence
Framework for Heart Disease Diagnosis. IEEE Access,
vol. 8. 14659-14674. Doi: 10.1109/ACCESS.20
19.2962755.
Kibria, H.B. and Matin, A. (2022). The severity prediction
of the binary and multi-class cardiovascular disease – A
machine learning-based fusion approach.
Computational Biology and Chemistry, vol 98. Doi:
10.1016/j.compbiolchem.2022.107672.
Lakshmi, A. and Devi, R. (2023). Heart Disease Prediction
Model using Genetic Algorithm and Support Vector
Machine. In 2023 7
th
International Conference on
Intelligent Computing and Control Systems (ICICCS).
824-829. Doi: 10.1109/ICICCS56967.2023.10142858.
Lohumi, P. et al. (2020). Ensemble Learning Classification
for Medical Diagnosis. In International Conference on
Computing, Communication and Security (ICCCS). 1-
5. Doi: 10.1109/ICCCS49678.2020.9277277.
Mohan, S., Thirumalai, C., and Srivastava, G.(2019).
Effective Heart Disease Prediction Using Hybrid
Machine Learning Techniques. IEEE Access, vol. 7.
81542-81554. Doi: 10.1109/ACCESS.2019.2923707.
National Center for Health Statistics. (2023). Percentage of
coronary heart disease for adults aged 18 and over.
Retrieved from https://wwwn.cdc.gov/NHISData
QueryTool/SHSadult/index.html.
National Institutes of Health. (2022). Smoking and your
heart-How smoking affects the heart and blood vessels.
NHLBI, NIH. Retrieved from https://www.nhlbi.
nih.gov/health/heart/smoking.
Pratama, P.G. et al. (2022). Boosting Algorithm for
Classifying Heart Disease Diagnose. In 2022
International Conference on Data Science and Its
Prediction of Heart Disease Severity Using Hierarchically-Structured Machine-Learning Models with Feature Space Reduction
669

Applications (ICoDSA). 93-97. Doi: 10.1109/Ico
DSA55874.2022.9862861.
Rani, P., Kumar, R., and Jain, A. (2021). Multistage Model
for Accurate Prediction of Missing Values Using
Imputation Methods in Heart Disease Dataset.
Innovative Data Communication Technologies and
Application. Lecture Notes on Data Engineering and
Communications Technologies, vol. 59. 637-653. Doi:
10.1007/978-981-15-9651-3_53.
Rao, K., Gopa, P.R., and Lata, K. (2021). Computational
Analysis of Machine Learning Algorithms to Predict
Heart Disease. In 2021 11
th
International Conference
on Cloud Computing, Data Science & Engineering
(Confluence). 960-964. Doi: 10.1109/Confluence516
48.2021.9377185.
Satyanandam, N. and Satyanarayana, Ch. (2021). An
Effective Analytics using Machine Learning Integrated
Approaches for Diagnosis, Severity Estimation and
Prediction of Heart Disease. In IOP Conference Series:
Materials Science and Engineering, vol. 1074. No.
012006. Doi: 10.1088/1757-899X/1074/1/012006.
UC Irvine Machine Learning Repository. (1988). Heart
Disease. Retrieved from https://archive.ics.uci.edu/
dataset/45/heart+disease.
Wang, G., Lauri, F. and Hassani, A.H.E. (2022). Feature
Selection by mRMR Method for Heart Disease
Diagnosis. IEEE Access, vol. 10. 100786-100796. Doi:
10.1109/ACCESS.2022.3207492.
WHO. (2020). The top 10 causes of death. Retrieved from
https://www.who.int/news-room/fact-sheets/detail/the-
top-10-causes-of-death.
WHO. Medical doctors (per 10 000 population). Retrieved
from https://www.who.int/data/gho/data/indicators/
indicator-details/GHO/medical-doctors-(per-10-000-
population).
Xiao, N. et al. (2020). DRNN: Deep Residual Neural
Network for Heart Disease Prediction. Journal of
Physics: Conference Series, vol. 1682. No. 012065.
Doi: 10.1088/1742-6596/1682/1/012065.
Yuan, X. et al. (2021). A Stable AI-Based Binary and
Multiple Class Heart Disease Prediction Model for
IoMT. IEEE Transactions on Industrial Informatics,
vol. 18 no. 3. 2032-2040, doi: 10.1109/TII.2021.
3098306.
HEALTHINF 2024 - 17th International Conference on Health Informatics
670
