Toward Pareto-Optimal Investment Mix to Achieve Carbon Neutrality:
A Case Study
Bedor Alyahya
1,2
, Alexander Brodsky
2 a
and Gregory Farley
3
1
Department of Management Information Systems, King Saud University, Saudi Arabia
2
Department of Computer Science, George Mason University, U.S.A.
3
Office of Sustainability, George Mason University, U.S.A.
Keywords:
Optimization, Case Study, Decision Guidance Tool, Operational Performance, Service Network, Sustainable
Investments, Carbon Neutrality, Financial Performance, Energy Efficiency.
Abstract:
Leading institutions are committing to climate action by setting greenhouse gas emission (GHG) reduction
targets to reach carbon neutrality. Institutional stakeholders are faced with the challenge of achieving these
objectives through cost-effective investments in diverse and interconnected infrastructures, all while consider-
ing the existing infrastructure. In our prior work, we tackled this issue by creating an extensible investment
model and tool known as GADGET - Green Assessment and Decision GuidancE Tool - to provide Pareto-
optimal investment recommendations for heterogeneous infrastructures within energy service networks. In
this study we employ GADGET to provide actionable investment recommendations to George Mason Uni-
versity’s stakeholders on a mix of interrelated infrastructures for its Fairfax campus with the initial scope
considering renewable energy certificates and carbon offsets, gas and electric boilers, on site solar panels,
energy storage, and Dominion Virginia Energy contract schedule. Our analysis covers the period from 2025
to 2050, considering investment decisions at five-year intervals, with the overarching goal of achieving carbon
neutrality by 2040. We also perform sensitivity analysis of recommended mixes to understand the implica-
tions of fluctuating REC and offset prices on projected outcomes. While our recommendations are specifically
designed for George Mason University, the insights we provide may also be relevant and beneficial to other
academic institutions.
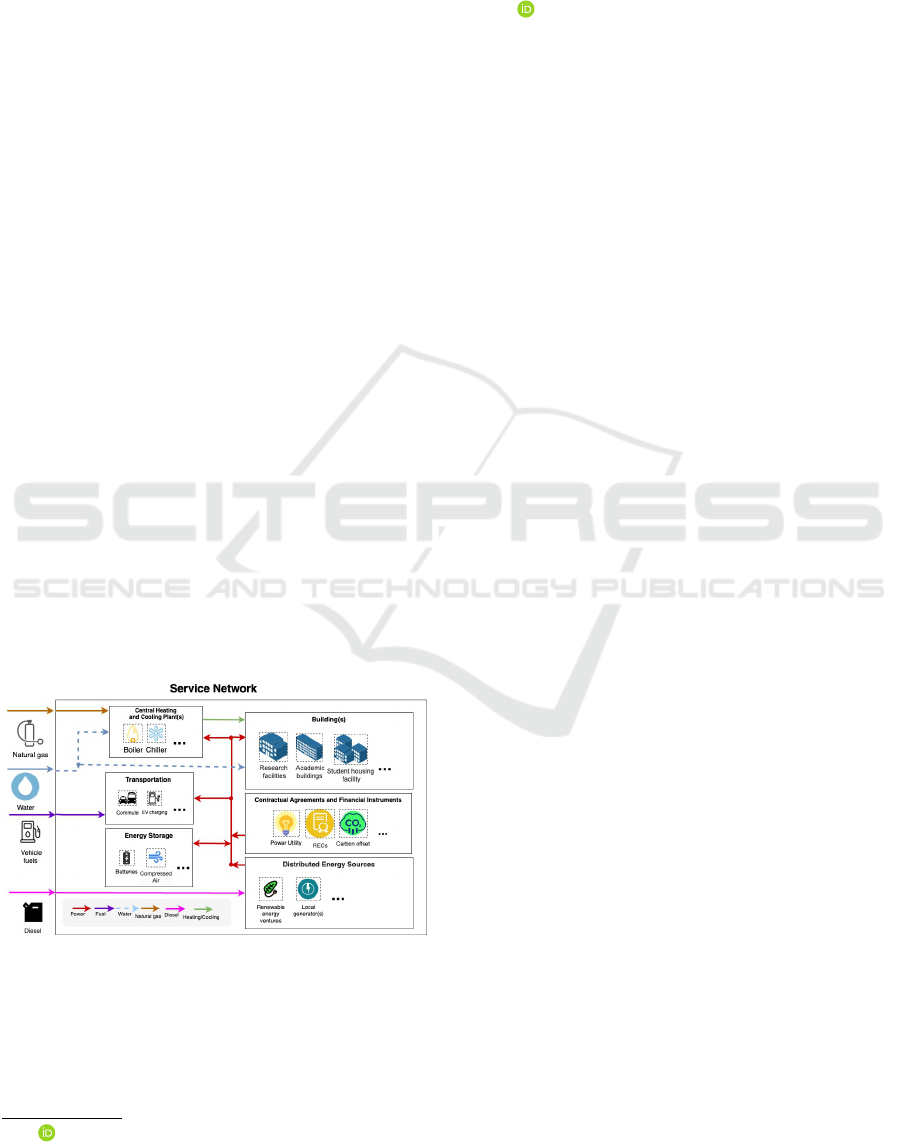
Figure 1: Service Network.
1 INTRODUCTION
Out of the 17 interlinked global goals adopted by
all United Nations Member States in 2015 (United
a
https://orcid.org/0000-0002-0312-2105
Nations, 2015), two goals deal with Affordable and
Clean Energy and Climate Action. This prompted
institutions worldwide to pledge reduction in carbon
emissions and achieving carbon neutrality. George
Mason University is part of this commitment, aiming
to be carbon neutral by 2040.
To achieve this goal, stakeholders need to decide
on how to invest in heterogeneous inter-related infras-
tructures including (1) building efficiency measures,
such as retrofitting, insulation, lighting sensors, and
certifications for new buildings; (2) heating/cooling
efficiency, e.g., in chillers and boilers; (3) renewable
sources of energy and local (co-) generation; (4) en-
ergy storage; (5) management of schedulable loads
such as in heating/cooling and EV charging; (6) RECs
and carbon offset credits; (7) investment in renewable
energy ventures; (8) peak demand control and man-
agement vis-
`
a-vis power utility contracts, e.g., with
Dominion Virginia Energy; and (9) incentives for us-
ing green transportation; etc.
372
Alyahya, B., Brodsky, A. and Farley, G.
Toward Pareto-Optimal Investment Mix to Achieve Carbon Neutrality: A Case Study.
DOI: 10.5220/0012436200003639
Paper published under CC license (CC BY-NC-ND 4.0)
In Proceedings of the 13th International Conference on Operations Research and Enterprise Systems (ICORES 2024), pages 372-381
ISBN: 978-989-758-681-1; ISSN: 2184-4372
Proceedings Copyright © 2024 by SCITEPRESS – Science and Technology Publications, Lda.

However, developing an actionable strategy for in-
vesting in diverse modalities to achieve carbon neu-
trality is challenging due to (1) the complexity of the
heterogeneous infrastructures and their components
which interact with each other during operation in a
non-trivial way; (2) the need to balance financial, en-
vironmental and quality of service KPIs, particularly
when these objectives conflict; (3) the dependence
of investment performance on operational efficiency
(e.g., over 30-minute operational intervals) (4) the
management of uncertainties arising from fluctuations
in supply, demand, and market prices which are typi-
cally not steady-state but transient; (5) the adaptation
to the ever-evolving landscape of carbon-reducing
technologies and regulations; and (6) interoperation
with pre-existing infrastructures constructed without
considering emissions.
Due to the challenges outlined, progress toward
carbon neutrality has not met the anticipated rates
or scales. While there have been notable enhance-
ments in the energy efficiency of some infrastruc-
tures, investments across mixed infrastructures are not
achieving their full potential. Therefore, it is essential
for stakeholders to formulate strategies that consider
multiple infrastructures and resources simultaneously,
placing a spotlight on the synergy between these in-
frastructures during operations.
In our review of past case studies designed
to assist stakeholders in attaining carbon neutrality
goals, represented by studies like (Alshuwaikhat and
Abubakar, 2008) (Roberto et al., 2018) and (Kourgio-
zou et al., 2021), a common limitation became ap-
parent. While these studies aimed to provide prac-
tical guidance, many of them presented frameworks
that, rather than offering a clear and direct action plan,
tended to provide broad theoretical guidelines.
Many case studies, exemplified by (Hanus et al.,
2019) and (Li and Jia, 2022), develop actionable plans
to assist stakeholders in formulating effective strate-
gies to achieve carbon neutrality. However, a common
drawback in these studies is their tendency to either
narrowly focus on limited interventions or neglect the
exploration of the intricate dynamics of operational
interplay.
Some case studies utilize design guidance tools
to craft actionable plans using a mix of modali-
ties for power systems in microgrids to achieve car-
bon targets. These studies aim to utilize operational
control to optimize system configurations, attaining
cost-effective and efficient solutions in carbon reduc-
tion. Examples of such studies are (Danish et al.,
2023) and (Venkatachary et al., 2017), which utilize
HOMER (Lambert et al., 2006), a simulation model
developed by the National Renewable Energy Lab-
Analytical Models
Fixed Parameter
Controllable Parameter
Capacity
Depreciation rate
...
Number of Battery
...
Battery
Extendable library
Metrics
Constraints
cost
co2e
...
capacity constraint
flow balancing
...
...
Solar Panels
Battery
Contract
Input
Operational
Interval
(e.g., 30 min)
Figure 2: Atomic Analytical Models.
oratory (NREL), to reach optimal system configura-
tions. However, these tools depend on simulations
to reach optimal solutions. In contrast, optimization
tools grounded in mathematical programming tend
to yield superior results, excelling in both optimal-
ity of results and computational efficiency. Addition-
ally, these tools were not initially designed for multi-
period investment optimization; they often enforce in-
vestments at the beginning, which may not be opti-
mally cost-effective, especially when dealing with rel-
atively new technologies subject to changing maturity
levels and prices over time.
In our recent study (Alyahya and Brodsky, 2023),
we introduced the Green Assessment and Decision
GuidancE Tool (GADGET) to address the aforemen-
tioned limitations. GADGET produces actionable
Pareto-optimal recommendations with respect two
sets of metrics: (1) financial metrics including Present
Value Cost (PVC) and IRR, and (2) environmental
metrics, such as CO
2
e emissions. GADGET de-
ploys a Mixed Integer Linear Programming (MILP)
solver and is based on the Service Network Invest-
ment Model (SNIM) (Alyahya and Brodsky, 2021),
which calculates cash flows and performance met-
rics. SNIM formalizes both (1) nontrivial operational
interactions within these infrastructures (e.g., at 30-
minute intervals), and (2) investment controls at dif-
ferent stages in the time horizon (e.g., every 5 years
over 25 years). Simultaneous optimization of these
two control levels enables a more effective utilization
of the infrastructure, minimizing waste that could oc-
cur when addressing each component in isolation.
In this study we employ GADGET to provide ac-
tionable investment recommendations to George Ma-
son University’s stakeholders on a mix of interrelated
infrastructures for its Fairfax campus with the ini-
tial scope considering renewable energy certificates
(RECs) and carbon offsets, gas and electric boilers, on
site solar arrays, energy storage, and Dominion Vir-
ginia Energy contract schedule. Our analysis covers
the investment time horizon from 2025 to 2050, con-
sidering investment decisions at five-year intervals,
with the overarching goal of achieving carbon neu-
trality by 2040.
We produce optimal actionable recommendations
for a number of scenarios associated with carbon neu-
trality targets ranging from 2040 to 2025, as well
as baseline scenarios of business-as-usual, RECs and
Toward Pareto-Optimal Investment Mix to Achieve Carbon Neutrality: A Case Study
373

carbon offsets only, and optimal investment that ig-
nores carbon emissions.
Additionally, we conduct sensitivity analysis on
the most promising scenario to understand the im-
plications of fluctuating prices for RECs and car-
bon offsets on the projected outcomes. While we
provide optimal recommendation specifically tailored
for George Mason University, our findings also offer
valuable insights that may be advantageous to other
institutions.
The remainder of this paper is organized as fol-
lows. Section 2 presents a review of the Service Net-
work Investment Model and the GADGET tool. Sec-
tion 3 details the methodology including the assump-
tions used in conducting the case study. Section 4 dis-
cusses the results of the case study and derives its im-
plications. Finally, Section 5 summarizes the research
and offers conclusions, highlighting the contributions
of this study.
2 OVERVIEW OF THE SERVICE
NETWORK INVESTMENT
MODEL AND GADGET
The Service Network Investment Model (SNIM) is
structured to provide across operational intervals,
which extend over different investment periods: (1)
A diverse range of metrics that span financial, op-
erational, performance, and quality indicators (e.g.,
present value cost (PVC) and CO
2
e), and (2) vari-
ous constraints including capacity, supply, demand,
and other relevant business constraints. These met-
rics and constraints are defined as functions of both
fixed and controllable parameters that span across the
investment time horizon. These parameters encap-
sulate the intrinsic configuration of the service net-
work and its operating conditions over the designated
investment periods. Consequently, they play a im-
portant role in shaping and influence strategic invest-
ment choices. To understand how SNIM operates,
let’s begin by explaining the input structure. This
involves a central component comprising the hier-
archical arrangement of all components within the
power micro-grid, referred to as the Service Network
(SN), as seen in the example of the GMU service net-
work, depicted in Figure 1. This visualization re-
veals a hierarchical assembly of interconnected ser-
vices, highlighted by nested boxes. Services inte-
grated into this structure encompass cooling and heat-
ing plants, loads, utility contracts, among others, en-
capsulating the dynamic resource flow throughout the
network (e.g., fuel, power,...). Positioned at the bot-
tom of this hierarchy are the atomic services, visu-
ally highlighted with dotted boxes (e.g., Batteries) in
the diagram. Whether these atomic services are cur-
rently owned or under consideration for investment,
they come with specific fixed and controllable param-
eters. For example, parameters for the battery atomic
service may encompass aspects like battery efficiency
or the number of units charging/discharging within a
given operational interval. These parameters are asso-
ciated with specific analytical models tailored to their
type (e.g., Battery Analytical Model), each residing
within a modular library.
Every atomic analytical model in this library
presents a mathematical model of the operation for its
particular service, determining its performance met-
rics and constraints, as illustrated in Figure 2. When
the SNIM operates, it integrates the flows, metrics,
and constraints, starting from the bottom level of the
hierarchy and moving upwards, for each operational
interval (for instance, every 30 minutes) throughout
the specified time horizon.
Above the core structure of the service network is
another layer called ‘Financial Instruments.’ The role
of this layer is to adjust the cash flow originating from
the service network to account for financial transac-
tions that affect the metrics without involving phys-
ical infrastructure. Instruments of this nature, such
as RECs (Renewable Energy Certificates) and car-
bon offsets, are particularly influential in decisions on
whether to make a purchase or refrain from it within
specified financial intervals (e.g., every month)
GADGET employs the SNIM to generate Pareto-
optimal actionable recommendations, presenting
them as optimized investment scenarios. Users can
access summaries, visualize charts, compare scenar-
ios, explore specific solutions, and conduct ’what if’
and sensitivity analyses. In each scenario, GADGET
not only determines the most effective mix of modali-
ties, including RECs and offsets but also identifies the
optimal timing. This selection is strategically stud-
ied based on achieving optimal operational efficiency,
with the overarching goal of maximizing returns and
achieving carbon reduction within a specified time pe-
riod. With the investment mixes being formulated un-
der the assumption of optimal operational controls,
we effectively minimize resource wastage that might
occur if each infrastructure were optimized in isola-
tion. This stands in contrast to traditional energy re-
duction models, which primarily focus on high-level
financial terms and aim to optimize simple payback
periods.
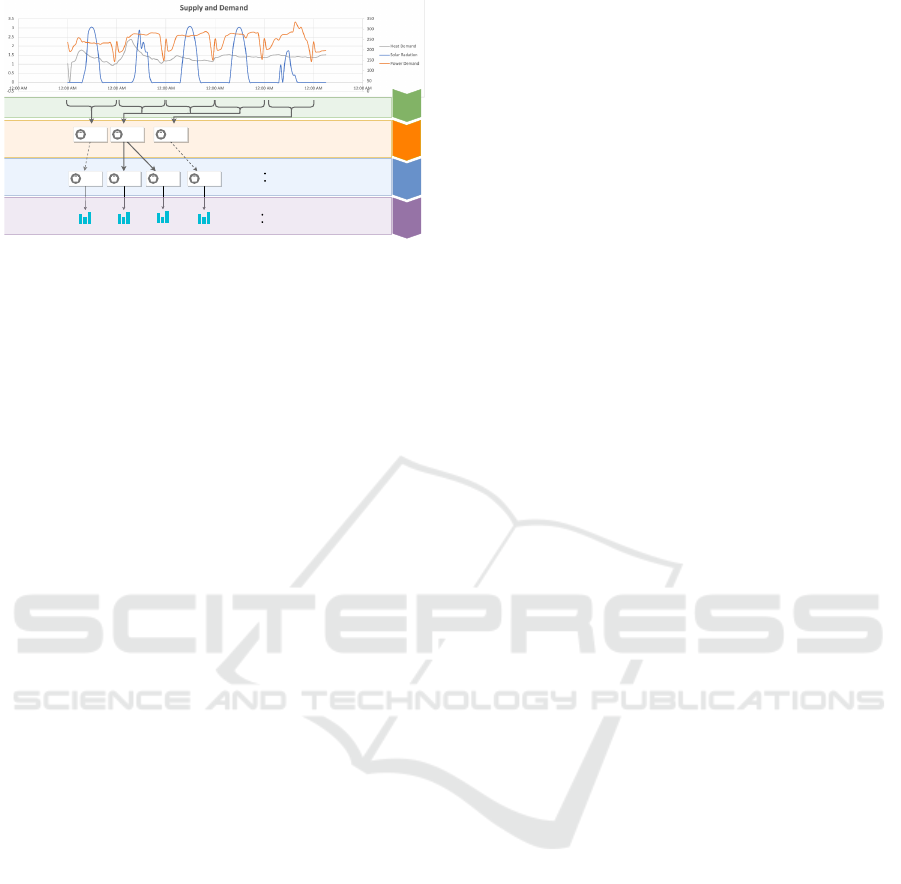
The tool adeptly tackles the scalability optimiza-
tion challenge of representing every operational in-
terval (e.g., 30 minutes) across investment periods
ICORES 2024 - 13th International Conference on Operations Research and Enterprise Systems
374
covering the entire time horizon (e.g., 25 years).
Equipped with a preprocessing engine, it represents
the supply and demand pattern by creating a sequence
of representative windows. For example, each win-
dow encapsulates a day of operational intervals (e.g.,
48 intervals of 30 minutes each), serving as proxies
of actual windows. These representative windows ef-
fectively capture similar supply and demand patterns,
alleviating the computational burden of modeling ev-
ery individual window.
The GADGET tool incorporates a library of ana-
lytic models specifically designed for a range of sys-
tem components, encompassing various investment
modalities and instruments related to power. Cur-
rently, the library includes: (1) gas and electric boil-
ers; (2) power storage; (3) solar; (4) transformer; (5)
carbon offset credits and renewable energy certificates
(RECs); (6) Peak demand control and management in
relation to power utility contracts, for example, with
Dominion Virginia Energy. In addition, the library
is designed with extensibility in mind. This ensures
that new component models can be integrated with-
out modifying the existing SN model or previously
defined components. These enhancements can span
various facets.
3 METHODOLOGY
In structuring the methodology for our study, we have
divided the process into several sections. Initially, in
our first section, we define the current state and estab-
lish the scope of our study. Following this, Section 3.2
outlines the assumptions made concerning our input
data model to the GADGET tool. This encompasses
elements like demand, supply, and pricing parame-
ters. Progressing to Section 3.3, we describe the time
horizon for our study and elaborate on how we gen-
erate the operational windows. Transitioning to Sec-
tion 3.4, we elaborate on the performance metrics em-
ployed. This section also addresses the business con-
straints that guide our trajectory towards achieving
carbon neutrality. We round off our methodology in
Section 3.5, where we introduce the diverse scenarios
explored in our quest for carbon neutrality.
3.1 Current State & Scope of the Study
Annually, Mason allocates between $9 to $10 mil-
lion for energy expenses across all its campuses. A
breakdown reveals that academic structures are re-
sponsible for approximately 40% of this energy con-
sumption, while auxiliary facilities account for an-
other 40%. Residential housing makes up the remain-
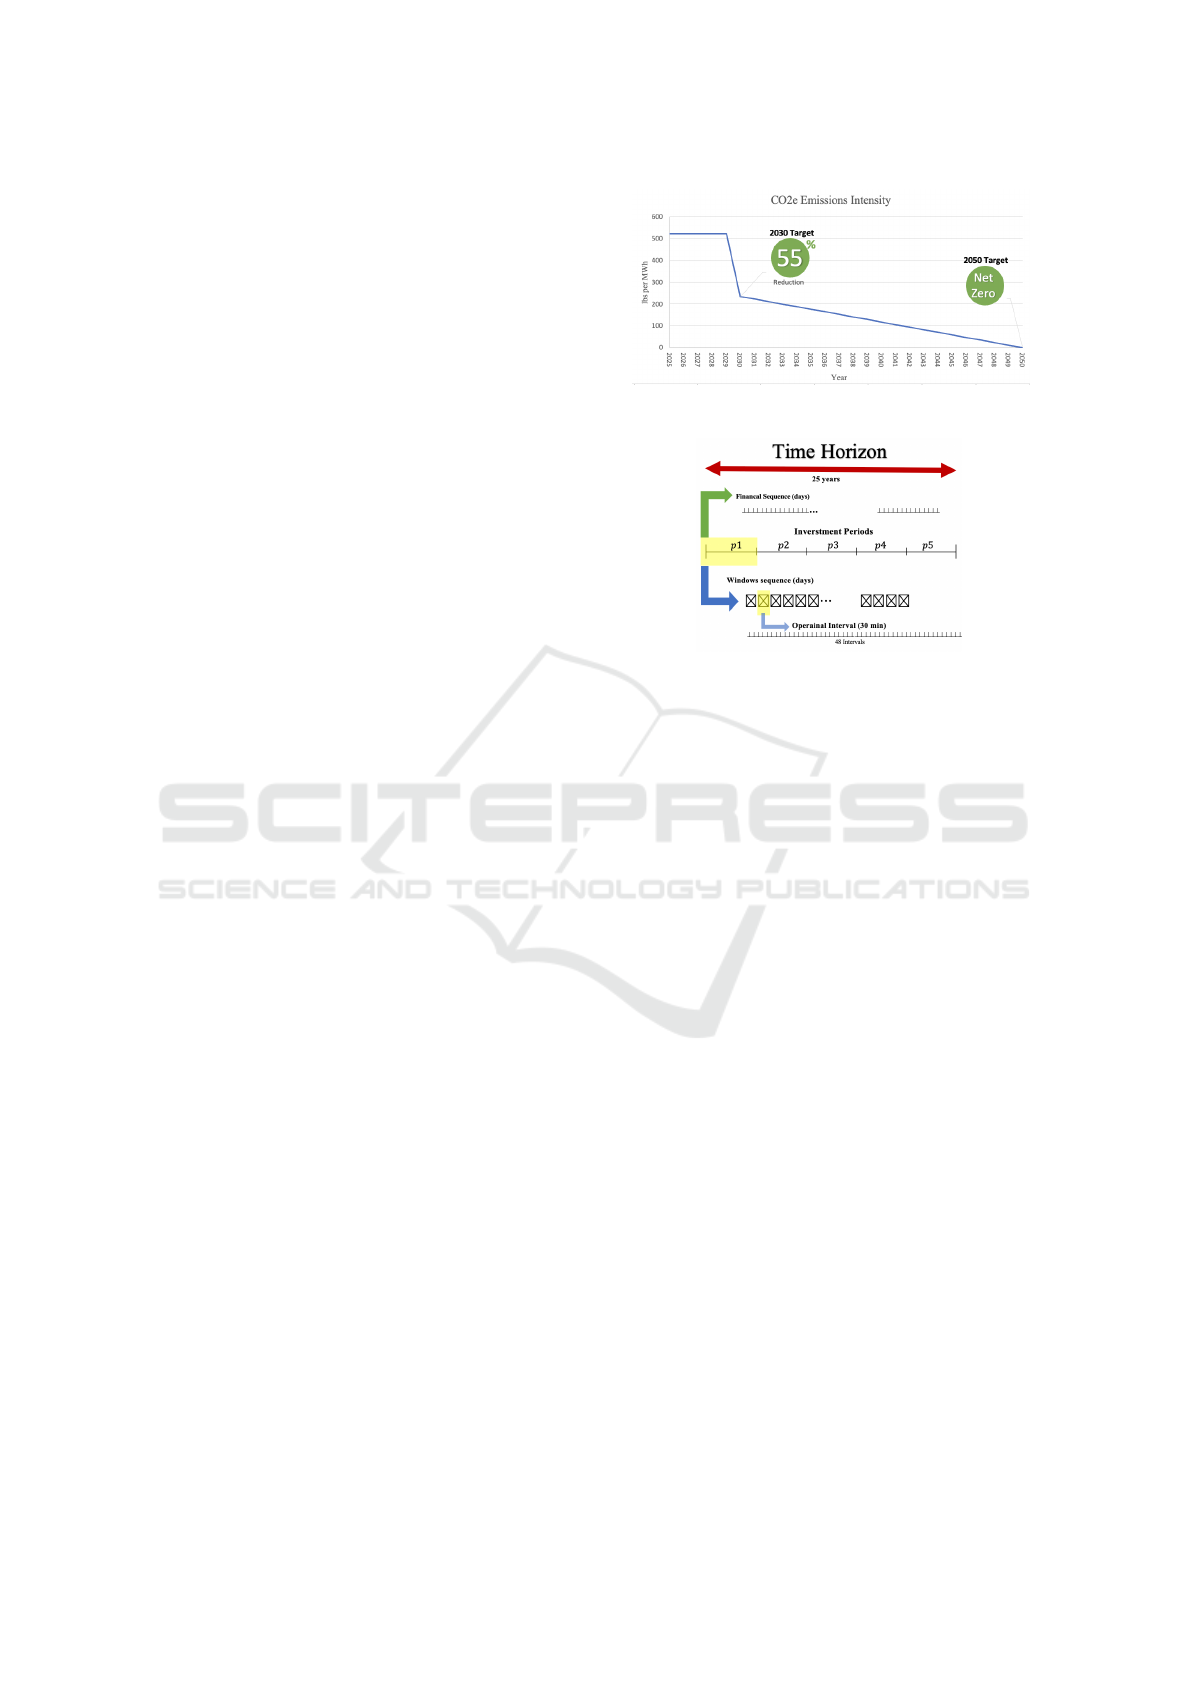
Figure 3: CO
2
e Intensity projection for Dominion Energy.
Figure 4: Time horizon.
ing 20%. Significantly, the Fairfax campus consumes
78% of Mason’s entire energy (George Mason Uni-
versity, 2023b).
Currently, Mason relies on natural gas for 100%
of its heat demand, classified as a Scope 1 emis-
sion. On the other hand, Scope 2 emissions arise
from the electricity supplied to the Fairfax campus by
Dominion Virginia Energy (George Mason Univer-
sity, 2023b). While Mason has extensively explored
the prospect of introducing major renewable energy
solutions, like solar panels and energy storage, they
haven’t yet been able to scale these solutions exten-
sively. Despite this, Mason has seen commendable
progress since its 2007 environmental pledge (George
Mason University, 2023a). This includes conducting
multiple Greenhouse Gas (GHG) Emissions Invento-
ries to gauge emissions, creating its Climate Action
Plan (CAP) as a guide to attain climate neutrality,
and consistently updating its sustainability endeavors
through the Sustainability Tracking, Assessment, and
Rating System (STARS) report (George Mason Uni-
versity, 2023a).
The CAP’s milestones aim to reduce emissions by
15% by 2030, and to achieve complete carbon neu-
trality by 2040. Acknowledging the CAP’s commit-
ment to a clear and attainable action plan, this study
explores multiple scenarios. One scenario adheres to
the carbon reduction goals set out in the CAP’s time-
line, while others pursue a more accelerated trajec-
tory towards these objectives. In this study, we fo-
cus on the Fairfax campus, with particular emphasis
on Scope 1 and Scope 2 emissions, as defined by the
Toward Pareto-Optimal Investment Mix to Achieve Carbon Neutrality: A Case Study
375
Bucket 1 Bucket 2 Bucket 3
step 2
step 3
Bucket 2A Bucket 2B Bucket 2Bucket 1
...
Group windows based on:
daily power peak demand
Split each bucket based on:
step 1
Split to windows:
Each window: 48 Interval
Each Interval: 30-min
step 4
Create a representative window that:
Rep window 1 Rep window 2
Rep window 3
Rep window 4
Split
Split
Group
Create
preserves the total window metrics
maintains the maximum peak power demand
The daily sum of solar radiation
The daily sum of heat demand
Text
Metrics
Figure 5: Windows Generation.
Greenhouse Gas Protocol and in accordance with ISO
14040 standards and World Resources Institute (WRI)
guidelines (International Organization for Standard-
ization, 2006; Sotos, Mary Elizabeth, 2015). We
delve into various modalities, including solar panels,
power storage, gas and electric boilers, the Domin-
ion contract (schedule 6VA), RECs and carbon offset.
The study’s timeframe spans 25 years, from 1/1/2025
to 12/31/2049. In the subsequent section, we outline
the assumptions related to supply, demand, and the
modalities previously mentioned.
3.2 Sources and Assumptions
For GMU’s electrical demand, we use historical
data, taken in 30-minute intervals, from GMU’s en-
ergy management system for 2019 (the year before
COVID) and assume a 0.5% annual growth. As for
the heat demand, since we only have the gas bills, we
utilize the heat demand curve from American Uni-
versity to regress GMU’s heat demand based on the
monthly GMU gas consumption. We have incorpo-
rated an assumed 0.5% annual growth in our calcula-
tions. Additionally, the gas price projection is sourced
from the U.S. Energy Information Administration. To
estimate the Carbon Dioxide CO
2
equivalent emis-
sions from one ton of natural gas, we utilized the
greenhouse gas equivalencies calculator provided by
the United States Environmental Protection Agency
(EPA) (United States Envirmometal and Protection
Agency, 2023b).
For our solar energy estimates, we utilize the
PVWatts calculator software developed by NREL.
This software calculates energy production in 30-
minute intervals, leveraging data from NREL’s solar
radiation database. We’ve based our calculations on
the assumption of a 4kW solar PV unit, set in a fixed
(open rack) position, employing a standard module,
and undergoing a system loss of 14.08%. We an-
ticipate a serviceable lifespan of 30 years for each
cell (National Renewable Energy Laboratory, 2023).
Regarding energy storage, our model assumes that
each battery storage provides a duration of 4 hours
with a total capacity of 2400 KWh. Operating con-
ditions are presumed to maintain a consistent tem-
perature of about 25°C. Additionally, we factor in
a battery degradation rate of roughly 2% for every
1,000 charge-discharge cycles, projecting a total life
expectancy of 20 years for each battery.
Additionally, we utilized the NREL database to
estimate the capital expenditures (CAPEX) and oper-
ation and maintenance (O&M) costs for solar panels
and storage technologies. These estimates are based
on moderate R&D advancement scenarios, both cur-
rently and with projections up to 2050 (National Re-
newable Energy Laboratory, 2023).
We’ve constructed our Dominion Energy model
based on the specifications outlined in Schedule 6VA.
According to this schedule, Dominion Energy charges
encompass both the supply (generation and transmis-
sion) and delivery (distribution) of electric service.
The rate structure exhibits time and seasonal varia-
tions, classified into three pricing tiers: On-Peak, Off-
Peak, and Rolling Peak. Notably, the pricing for the
‘Rolling Peak’ tier is determined by considering the
peak of the current month as well as the preceding
eleven billing months, as highlighted in (Dominion
Energy, 2023). In our model, we project that changes
in charges, including the Basic charge and Distribu-
tion Demand charge, will align with expected shifts
in the electricity price per kW from 2025 to 2050.
This projection is informed by data presented in the
U.S. Energy Information Administration’s (EIA) AN-
NUAL ENERGY OUTLOOK 2022 (U.S Energy In-
formation Administration , 2023).
For the forecasting of REC prices, we utilize Au-
rora, a specialized energy forecasting software (Au-
rora Energy Research Limited, 2023). Furthermore,
our modeling approach to REC purchasing is de-
signed for flexibility in timing the acquisitions, align-
ing with the Yearly Reporting Requirement set by
the United States Environmental Protection Agency
(EPA). According to this EPA guideline, RECs can
be bought up to 6 months before and 3 months after
the reporting year, and still be recognized within that
specified year (United States Envirmometal and Pro-
tection Agency, 2023a). For the carbon offset price
forecast, we use one provided by BloombergNEF,
utilizing a hybrid scenario that includes both off-
sets that avoid emissions and those that remove them
(BloombergNEF, 2023).
Currently, Mason operates five gas boilers. Two
of them have reached the end of their operational life.
The remaining three have capacities of 25 MMBTU,
18.75 MMBTU, and 24.89 MMBTU with respective
life expectancies of 6, 10, and 16 years. We assume
ICORES 2024 - 13th International Conference on Operations Research and Enterprise Systems
376

that Mason has two main options for their heating in-
frastructure: either to reinvest in gas boilers similar to
their current ones or to transition to electric boilers.
Should they opt for the latter, this would also entail
upgrading their transformer. Each of the electric boil-
ers under consideration possesses a capacity of 1,800
KW. With assistance from the GMU facilities team,
we’ve estimated the capital expenditures, O&M costs,
and life expectancy of newly purchased units. We’ve
also applied an inflation rate of 2.37% to forecast cost
increases over time.
3.3 Time Horizon & Representative
Daily Windows
We segment our 25-year time horizon into five distinct
investment periods, each encompassing a duration of
five years. It’s our presumption that investments ma-
terialize at the onset of each respective period, guar-
anteeing immediate availability of the infrastructure.
To assess cash flow, we adopt a sequential daily ap-
proach, identifying the specific intervals when partic-
ular sums are accrued, as depicted in Figure 4. Each
period is segmented into representative daily win-
dows, where each window stands as a proxy for a day,
reflecting specific supply and demand patterns. Every
window is further subdivided into 48 intervals, each
spanning 30 minutes. To ensure these representative
windows accurately capture the system’s behavior, we
devised the following methodology:
First, to construct a precise representation of
the system’s behavior across a 5-year investment
period—comprising approximately 1,825 windows
(days)—we categorize these windows based on their
peak power demand. Employing a bucketing tech-
nique, windows that fall within an initial minimal
distance (ε) of 300 kW from the peak are grouped
together. As we navigate further from the highest
recorded peak throughout all windows, the width of
our grouping (denoted by ε) doubles, allowing for
broader peak variations within the same bucket. This
methodology ensures that, within each bucket of win-
dows, we capture a less diverse range of peaks when
the peaks are high. Such an approach emphasizes re-
fining the buckets of windows with high peaks due to
their substantial impact on demand contract charges,
as depicted in Figure 5: step 2.
After the initial categorization, we further refine
our buckets by segmenting them based on other met-
rics, such as the daily sum of solar radiation and the
daily heat demand (refer to Figure 5: step 3). From
each of these buckets, we create a representative win-
dow of demand and supply. This representative win-
dow is created based on two criteria: (1) the aggre-
gate metric of all windows within a particular bucket
should match the product of the representative win-
dow’s metric and the count of windows in that bucket;
(2) the peak power demand of the representative win-
dow should match the highest peak found in any win-
dow within that particular bucket (see Figure 5: step
4 for reference).
3.4 Performance Metrics
While the GADGET can depict a diverse range of
metrics, our primary emphasis lies on two specific
metrics: total cost of ownership and CO
2
e emissions
(covering both scope 1 and 2). Our objective func-
tion is geared towards minimizing the Present Value
Cost (PVC) from 2025 to 2050. To determine the
PVC, we incorporate a 5% discount rate. Addition-
ally, for calculating the residual value, we employ the
straight-line depreciation method. To achieve carbon
neutrality, we run various scenarios wherein we set
constraints on annual carbon emissions to align with
target reductions over the designated periods. The
specifics of these reductions are contingent on the sce-
narios, which we elaborate upon in the following sec-
tion.
3.5 Scenarios
1. In the Business As Usual (BAU) scenario, invest-
ments are solely directed toward replacing out-
dated infrastructure or addressing the growing de-
mand. In this scenario, green solutions are not
considered, nor are carbon emissions constrained.
Nevertheless, operational controls are still opti-
mized with the primary goal of minimizing the
present value cost (PVC).
2. Base 2040 (RECs and Offset): Aiming to mini-
mize the PVC and meet CAP’s milestones, this
scenario adopts a ’BAU’ strategy. However, it
strategically purchases offsets and RECs in the
most economical manner to fulfill CAP’s desig-
nated targets.
3. Greedy Scenario: Operational and investment
controls are optimized with the primary objective
of minimizing the present value cost (PVC). Car-
bon reduction is not taken into account, and all
green infrastructures are considered as potential
investment opportunities.
4. Green 2040: In this scenario, the primary objec-
tive is to minimize PVC by optimizing the op-
eration and investment controls with the ultimate
goal of achieving carbon neutrality by 2040. This
approach may encompass various strategies, in-
Toward Pareto-Optimal Investment Mix to Achieve Carbon Neutrality: A Case Study
377
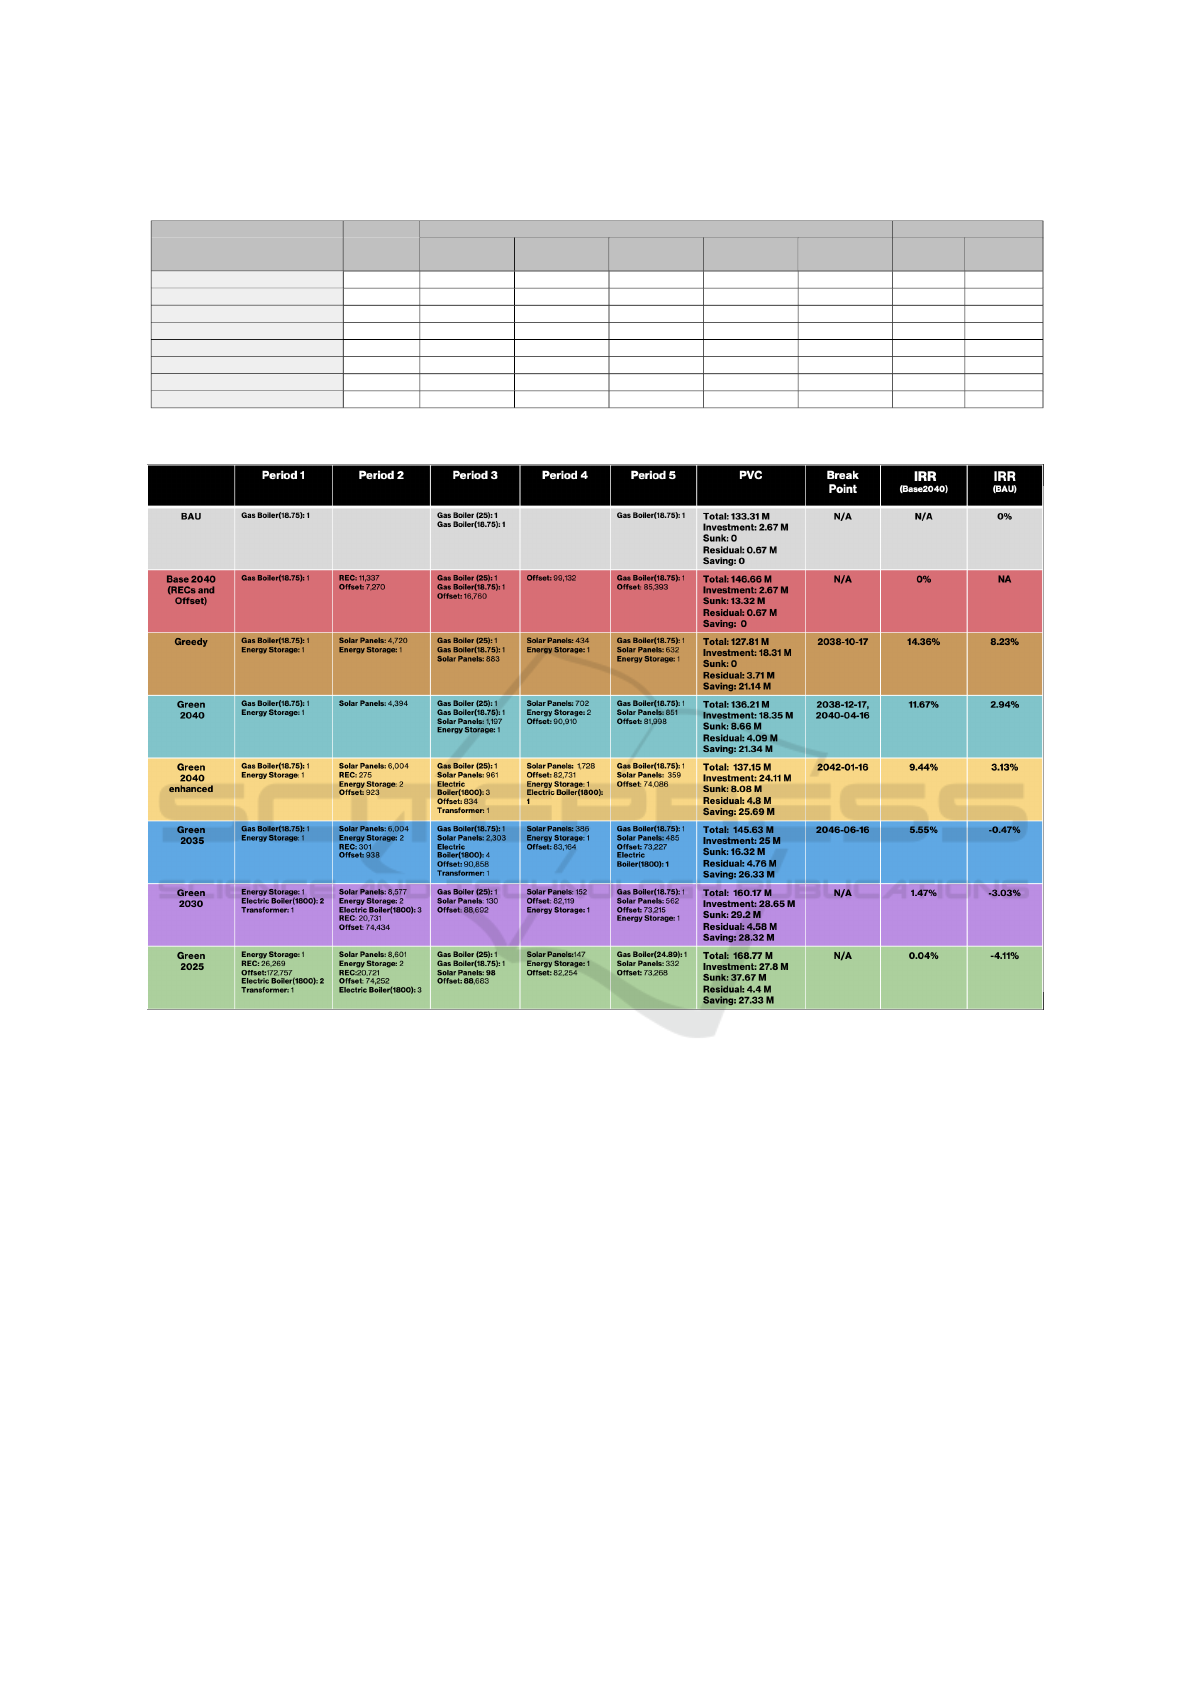
Table 1: Scenarios settings.
Carbon reduction Explore solutions
Scenarios Objective
Period 1
2025 to 2030
Period 2
2030 to 2035
Period 3
2035 to 2040
Period 4
2040 to 2045
Period 5
2045 to 2050
Green
solutions
RECs
and offset
BAU min PVC 0% 0% 0% 0% 0% No No
Base 2040 (RECs and offset) min PVC 0% 15% 15% 100% 100% No Yes
Greedy min PVC 0% 0% 0% 0% 100% Yes Yes
Green 2040 min PVC 0% 0% 0% 100% 100% Yes Yes
Green 2040 enhanced min PVC 0% 15% 15% 100% 100% Yes Yes
Green 2035 min PVC 0% 15% 100% 100% 100% Yes Yes
Green 2030 min PVC 0% 100% 100% 100% 100% Yes Yes
Green 2025 min PVC 100% 100% 100% 100% 100% Yes Yes
Table 2: Comparative Summary of All Scenarios.
cluding green infrastructure and the acquisition of
RECs and offsets.
5. Green enhanced 2040: Similar to the Green 2040
scenario, but with an added target on carbon re-
duction. Starting from 2030, there’s a constraint
to reduce carbon by 15%, aligning with the targets
specified in CAP’s milestones.
6. Green 2035: This scenario is akin to Green en-
hanced 2040 but pushes for carbon neutrality by
2035.
7. Green 2030: This scenario mirrors the Green
2040 approach but accelerates the timeline, aim-
ing for carbon neutrality by 2030.
8. Green 2025: Built on the Green 2040 approach,
the aim here is to achieve carbon neutrality by
2025.
To optimize these scenarios, we employed a batch-
processing cluster using a single core of the AMD
Opteron Processor 6276. We leveraged the CPLEX
22.1.0 solver to establish optimal operational controls
and to determine the ideal investments in infrastruc-
ture units to meet the objective and different scenario
constraints, as detailed in Table 1. The termination
conditions were set to a maximum duration of 5 days
or when achieving a gap of 0.3%.
4 RESULTS
In Figure 6, we depict the annual carbon reductions
and the PVC for each scenario. Table 2 offers a de-
tailed breakdown of the results from these scenarios.
Within the table, the Total PVC is categorized into
ICORES 2024 - 13th International Conference on Operations Research and Enterprise Systems
378
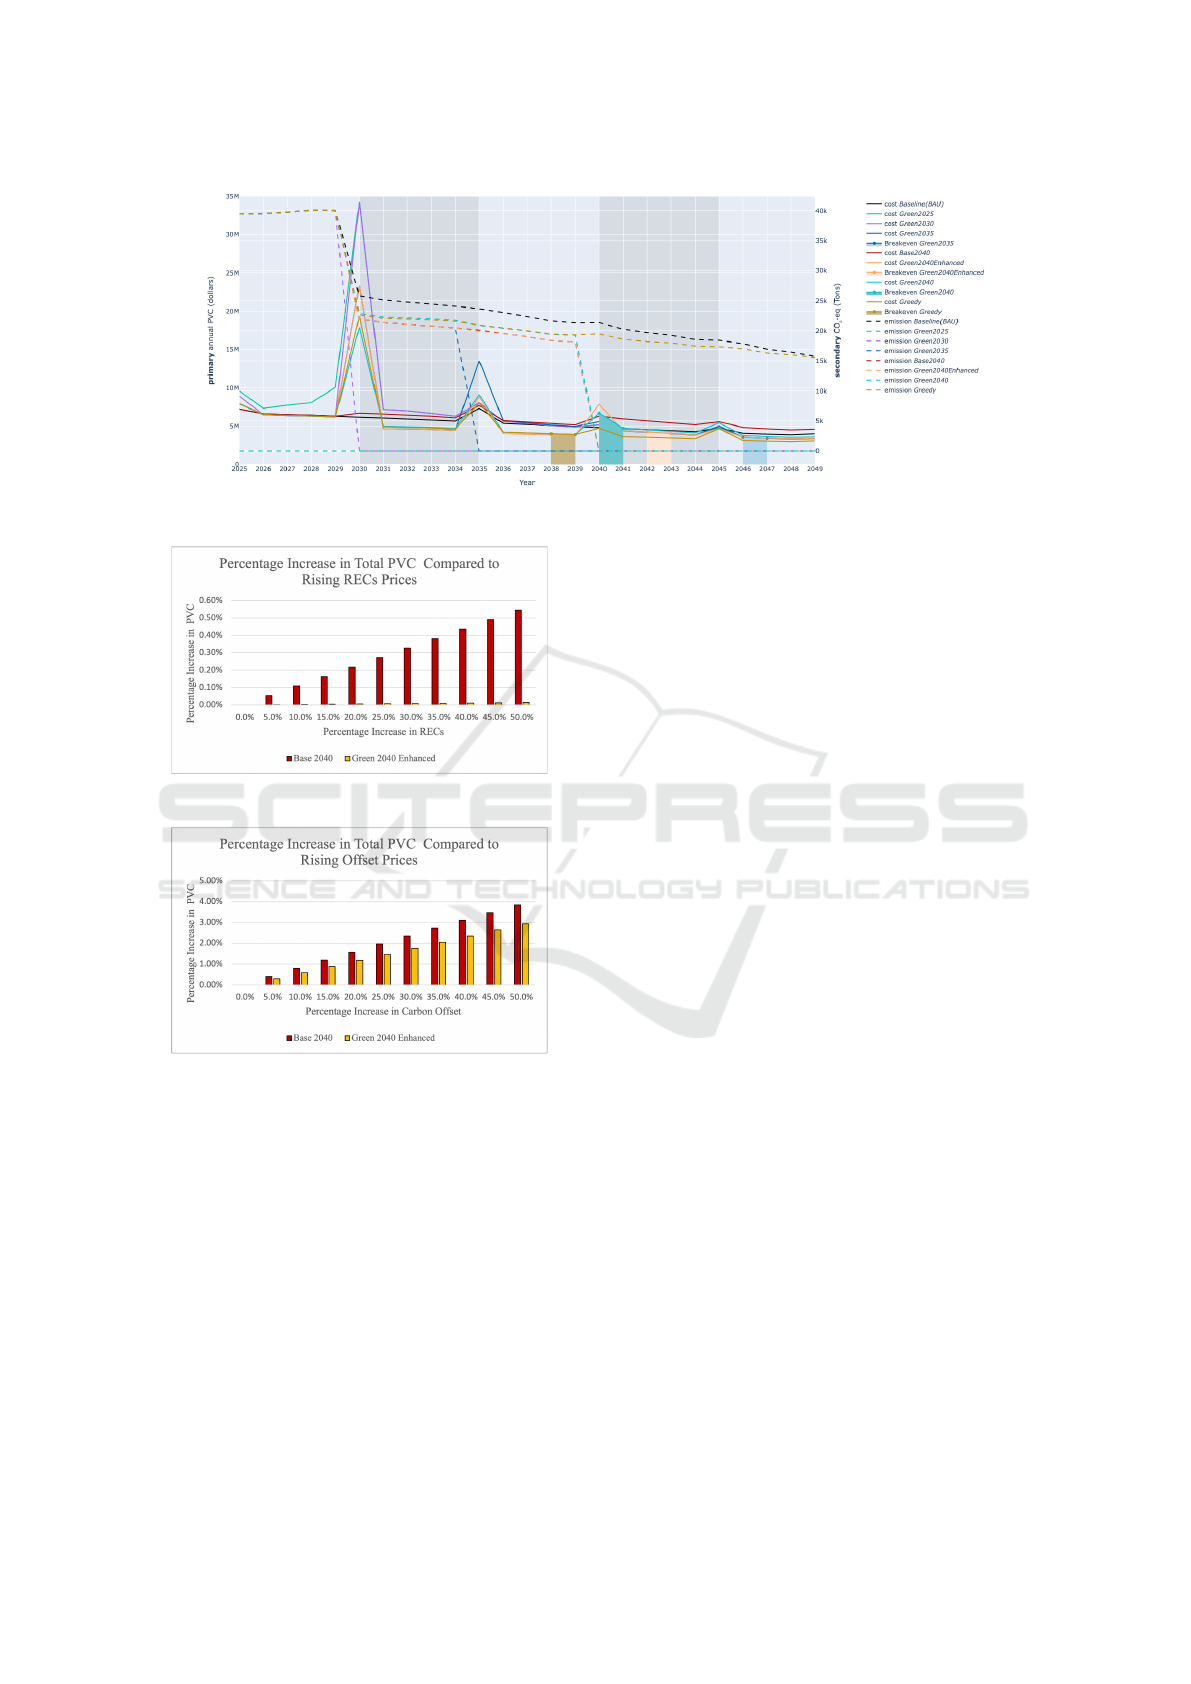
Figure 6: Scenarios.
Figure 7: Sensitivity Analysis of RECs Price Increase.
Figure 8: Sensitivity Analysis of Carbon Offset Price In-
crease.
its constituent elements: costs associated with invest-
ments, residuals, and sunk costs spent on acquiring
RECs and offsets. It also presents the cost savings in
comparison to the BAU scenario. Additionally, the
table highlight the Return on Investment (ROI) set
against the BAU and the Base 2040 (RECs and offset)
scenarios, and concludes with an enumeration of units
purchased at the beginning of each investment period
for every explored scenario. By analyzing the results
presented in this section, the following findings can
be drawn:
1. Among all the models aligned with CAP’s mile-
stones, ’Green 2040 Enhanced’ emerges as the
most profitable scenario. Although the ’Green
2040’ scenario may be less stringent in terms of
achieving carbon reduction (it does not achieve
the CAP’s milestones) and is more cost-effective
in terms of total present value cost, the ’Green
2040 Enhanced’ scenario demonstrates a higher
return on investment compared to the ’BAU’
(Business As Usual) and also realizes greater sav-
ings. This is primarily attributed to early invest-
ments made to accommodate more aggressive car-
bon constraints.
2. In the ’Greedy’ scenario, where the emphasis is
largely on financial metrics with environmental
impacts often sidelined, investments are predom-
inantly directed towards green solutions, espe-
cially storage and solar. Importantly, it’s evident
that financial cost and carbon reduction aren’t
necessarily at odds, at least to a certain degree.
3. Energy management in a microgrid is essential for
its smooth operation in a real-time environment.
Achieving reductions in both cost and carbon
emissions can largely be credited to an emphasis
on optimal operations combined with the adoption
of the proposed investment plans. Nonetheless,
merely investing in the modalities without adopt-
ing a holistic strategy for overseeing these opera-
tions might not produce the expected outcomes.
4. While best practices advocate for combining en-
ergy storage and solar panels, offering benefits
such as utilizing excess solar energy during non-
sunny periods, maintaining grid stability, and en-
suring resilience and backup, our scenario anal-
ysis revealed a different trend. In all scenarios
that explore green solutions, we observed that,
in period 1, energy storage is utilized exclusively
(without accompanying solar) to mitigate peak de-
mand from the Dominion contract.
5. In all scenarios analyzed for achieving carbon
Toward Pareto-Optimal Investment Mix to Achieve Carbon Neutrality: A Case Study
379

neutrality, it’s clear that carbon offsetting is cru-
cial for GMU to attain a carbon-neutral status by
2040 in the most cost-effective manner.
6. Switching to electric boilers is intrinsically linked
to the target year set for achieving carbon neutral-
ity. A premature transition to electric boilers is not
recommended, primarily because there are no as-
sociated cost savings to support such investments.
Specifically, a shift to electricity would consid-
erably augment the peak demand under the Do-
minion contract. This rationale is underscored in
the ’Greedy’ scenario, where investment in elec-
tric boilers is absent throughout all periods.
7. Through the implementation of green solutions,
we can achieve carbon neutrality as early as 2035,
with a favorable net present cost compared to
the Baseline 2040 scenario. Additionally, this
approach yields a positive return on investment
(ROI) of 5.55%, in contrast to the Baseline 2040
scenario, which achieves carbon neutrality later at
2040 through the purchase of offsets and RECs.
8. In all cases, the investment in solar wasn’t initi-
ated at the beginning of 2025. This decision may
be attributed to the fact that it might not be eco-
nomically viable to invest in solar before Domin-
ion reduces their emissions in 2030. As a result,
opting to wait, purchase offsets and RECs to at-
tain carbon neutrality, and investing in batteries to
mitigate peak demand appears to be the optimal
solution.
4.1 Sensitivity Analysis
As the Green 2040 Enhanced scenario exhibits the
lowest Present Value Cost (PVC) and the highest In-
ternal Rate of Return (IRR) among all scenarios that
achieve the Mason CAP’s milestones, we have chosen
this scenario for further analysis.
In Figure 7, we illustrate the impact of changes
in RECs pricing on the Total PVC. We conducted a
similar analysis for carbon offset pricing in Figure 8.
It is evident that, in general, RECs are less sensitive to
changes in Total PVC compared to offset prices. This
is attributed to the lower volume of RECs purchased
in both the Base 2040 (REC=11,337) and the Green
2040 Enhanced (REC=275) scenarios, in contrast to
the higher offset purchases in these scenarios (Base
2040=208,555, Green 2040 Enhanced=158,574).
Moreover, the Base 2040 scenario exhibits higher
sensitivity to price changes when compared to the
Green 2040 Enhanced scenario. To illustrate, when
the price increases by 50%, the impact is more pro-
nounced in the Base 2040 scenario. For offsets, this
difference amounts to 6 million as opposed to 4 mil-
lion, and for RECs, it’s 798,000 compared to 19,000.
5 CONCLUSION
Utilizing GADGET, we presented George Mason
University’s leadership with investment recommenda-
tions aimed at achieving carbon neutrality by 2040. In
this study, we utilized GADGET to provide George
Mason University’s leadership with targeted invest-
ment recommendations and delved into broader, am-
bitious carbon neutrality scenarios. Though our in-
sights and recommendations are tailored for George
Mason University, they can be helpful for other insti-
tutes as well. As we move forward, there’s a com-
pelling need to broaden our analytical scope. Specif-
ically, we see potential in adding modalities such as
building retrofits, energy efficiency retrofits, central
utility electrification, and distributed energy sources.
Refining our strategies for short-term investment pe-
riods, pinpointing specific technological preferences,
and ensuring system reliability will be central to our
future efforts. In the ever-evolving investment envi-
ronment, continuous reassessment and adaptation are
essential.
ACKNOWLEDGMENT
We would like to thank Tad Drerenberger, DJ Spauld-
ing, Tommy Benner, and Rod Billones from GMU
facilities and Gene Crouch and Ryan Conway from
GMU finance for collaborating on this project. A spe-
cial acknowledgment goes to the GMU Office of Re-
search Computing for providing the ARGO research
computing cluster for GADGET optimization.
REFERENCES
Alshuwaikhat, H. M. and Abubakar, I. (2008). An inte-
grated approach to achieving campus sustainability:
assessment of the current campus environmental man-
agement practices. Journal of Cleaner Production,
16(16):1777–1785.
Alyahya, B. and Brodsky, A. (2021). A decision guidance
system for optimal infrastructure investments. In 2021
IEEE 33rd International Conference on Tools with Ar-
tificial Intelligence (ICTAI), pages 1337–1342.
Alyahya, B. and Brodsky, A. (2023). GADGET: A green
assessment and decision guidance tool for optimal
investment in inter-dependant energy infrastructures.
Technical Report GMU-CS-TR-2023-3, Department
of Computer Science, George Mason University, 4400
ICORES 2024 - 13th International Conference on Operations Research and Enterprise Systems
380

University Drive MSN 4A5, Fairfax, VA 22030-4444
USA.
Aurora Energy Research Limited (2023). Aurora. Energy
forecasting software.
BloombergNEF (2023). Carbon offset prices could increase
fifty-fold by 2050. https://about.bnef.com/blog/
carbon-offset-prices-could-increase-fifty-fold-by-2050/.
Accessed: January 10, 2023.
Danish, F., Shamsi, M. F., Kumar, A., Prashant, Siddiqui,
A. S., and Sarwar, M. (2023). Impact assesment of
microgrid towards achieving carbon neutrality: A case
study. In 2023 International Conference on Power, In-
strumentation, Energy and Control (PIECON), pages
1–5.
Dominion Energy (2023). Schedule 6 large general
service. https://www.dominionenergy.com/virginia/
rates-and-tariffs/business-rates. Accessed: 2022-12-
28.
George Mason University (2023a). Climate ac-
tion plan. https://facilities.gmu.edu/resources/
climate-action-plan/. Accessed: 2022-12-28.
George Mason University (2023b). University sustainabil-
ity. https://green.gmu.edu/. Accessed: 2022-12-28.
Hanus, N. L., Wong-Parodi, G., Vaishnav, P. T., Darghouth,
N. R., and Azevedo, I. L. (2019). Solar pv as a mit-
igation strategy for the us education sector. Environ-
mental Research Letters, 14(4):044004.
International Organization for Standardization (2006). En-
vironmental management: life cycle assessment;
Principles and Framework. ISO.
Kourgiozou, V., Commin, A., Dowson, M., Rovas, D., and
Mumovic, D. (2021). Scalable pathways to net zero
carbon in the uk higher education sector: A system-
atic review of smart energy systems in university cam-
puses. Renewable and Sustainable Energy Reviews,
147:111234.
Lambert, T., Gilman, P., and Lilienthal, P. (2006). Microp-
ower system modeling with homer. Integration of al-
ternative sources of energy, 1(1):379–385.
Li, Y. and Jia, Q.-S. (2022). On the feasibility to achieve
carbon neutrality in university campus: A case study.
IFAC-PapersOnLine, 55(5):78–83. 2nd IFAC Work-
shop on Integrated Assessment Modelling for Envi-
ronmental Systems IAMES 2022.
National Renewable Energy Laboratory (2023). Nrel’s
pvwatts® calculator. https://pvwatts.nrel.gov/. Ac-
cessed: 2022-12-28.
Roberto, S. R.,
¨
Urge Vorsatz, D., and Aliyu, S. B.
(2018). Sustainable development goals and climate
change adaptation in cities. Nature Climate Change,
8(3):181–183.
Sotos, Mary Elizabeth (2015). GHG protocol scope 2 guid-
ance. WRI: World Resources Institute.
United Nations (2015). Transforming our world: The
2030 agenda for sustainable development. Available
at: https://sustainabledevelopment.un.org/post2015/
transformingourworld.
United States Envirmometal and Protection Agency
(2023a). Epa’s green power partnership-partnership
requirements. https://www.epa.gov/sites/default/
files/2016-01/documents/gpp partnership reqs.pdf\
#page=12. Accessed: 2022-12-28.
United States Envirmometal and Protection Agency
(2023b). Greenhouse gas equivalencies
calculator. https://www.epa.gov/energy/
greenhouse-gas-equivalencies-calculator\#results.
Accessed: 2022-12-28.
U.S Energy Information Administration (2023). Annual
energy outlook 2022. https://www.eia.gov/outlooks/
aeo/. Accessed: 2022-12-28.
Venkatachary, S. K., Prasad, J., and Samikannu, R. (2017).
Cost optimization of micro grids using homer: A case
study in botswana. International Journal of Energy
Economics and Policy, 7(5):323–339.
Toward Pareto-Optimal Investment Mix to Achieve Carbon Neutrality: A Case Study
381
