
BEVFastLine: Single Shot Fast BEV Line Detection for Automated
Parking Applications
Praveen Narasappareddygari
1 a
, Venkatesh Moorthi Karunamoorthy
1 b
, Shubham Sonarghare
2 c
,
Ganesh Sistu
2 d
and Prasad Deshpande
2 e
1
Valeo India Pvt. Ltd., Chennai, India
2
Valeo Vision Systems, Tuam, Ireland
{firstname.lastname}@valeo.com
Keywords:
Road Marking Detection, Autonomous Parking, Multi Camera Line Detection, Birds Eye View.
Abstract:
In autonomous parking scenarios, accurate near-field environmental perception is crucial for smooth opera-
tions. Parking line detection, unlike the well-understood lane detection, poses unique challenges due to its
lack of spatial consistency in orientation, location, and varied appearances in color, pattern, and background
surfaces. Consequently, state-of-the-art models for lane detection, which rely on anchors and offsets, are not
directly applicable. This paper introduces BEVFastLine, a novel end-to-end line marking detection architec-
ture in Birds Eye View (BEV) space, designed for 360
◦
multi-camera perception applications. BEVFastLine
integrates our single-shot line detection methodology with advanced Inverse Perspective Mapping (IPM) tech-
niques, notably our fast splatting technique, to efficiently detect line markings in varied spatial contexts. This
approach is suitable for real-time hardware in Level-3 automated vehicles. BEVFastLine accurately localizes
parking lines in BEV space with up to 10 cm precision. Our methods, including the 4X faster Fast Splat
and single-shot detection, surpass LSS and OFT in accuracy, achieving 80.1% precision, 90% recall, and
nearly doubling the performance of BEV-based segmentation and polyline models. This streamlined solution
is highly effective in complex, dynamic parking environments, offering high precision localization within 10
meters around the ego vehicle.
1 INTRODUCTION
In the domain of autonomous vehicles, the emergence
of autonomous parking systems marks a significant
stride towards enhanced efficiency, safety, and user
convenience. Unlike other driving scenarios such
as highways and urban roads, parking areas present
complex challenges due to their confined nature and
the presence of various static and dynamic obstacles.
Central to navigating these challenges are the percep-
tion task of line detection, which is critical for accu-
rate vehicle positioning and safe maneuvering within
parking environments.
In the spectrum of perception tasks, two pivotal
tasks—line detection and lane identification—often
become conflated. Line detection, regarded as a
a
https://orcid.org/0009-0000-2009-2182
b
https://orcid.org/0009-0007-2445-5754
c
https://orcid.org/0009-0008-4921-1526
d
https://orcid.org/0009-0003-1683-9257
e
https://orcid.org/0009-0008-9954-680X
lower-level task, is principally devoted to discerning
physical markings within the drivable terrain, em-
ploying either geometric or learning-based method-
ologies. Traditionally, geometric modeling algo-
rithms like the Hough Transform (Hough, 1962) and
Canny edge (Canny, 1986) detection have been uti-
lized to pinpoint pixels in camera imagery corre-
sponding to road lines, culminating in outputs such
as binary images or geometric parameters encapsu-
lating these lines. However, a contemporary shift is
evident towards adopting learning-based algorithms,
marking a progressive trend in this domain(Zakaria
et al., 2023). Contrarily, lane identification, a higher-
tier task, endeavors to decipher the semantic implica-
tion of the detected lines. This includes distinguish-
ing which lines demarcate the current driving lane,
adjacent lanes, or other classifications of lanes such
as oncoming lanes or bike lanes.
Line landmarks, exhibited as various line types
on the parking terrain, serve as essential navigational
aids, guiding vehicles into designated spaces. Their
role is paramount in demarcating drivable zones,
220
Narasappareddygari, P., Karunamoorthy, V., Sonarghare, S., Sistu, G. and Deshpande, P.
BEVFastLine: Single Shot Fast BEV Line Detection for Automated Parking Applications.
DOI: 10.5220/0012435700003660
Paper published under CC license (CC BY-NC-ND 4.0)
In Proceedings of the 19th International Joint Conference on Computer Vision, Imaging and Computer Graphics Theory and Applications (VISIGRAPP 2024) - Volume 4: VISAPP, pages
220-231
ISBN: 978-989-758-679-8; ISSN: 2184-4321
Proceedings Copyright © 2024 by SCITEPRESS – Science and Technology Publications, Lda.
delineating parking slot boundaries, and ensuring
safe vehicular maneuvering without collisions or en-
croachments on neighboring spaces (Lee and Park,
2021). Nonetheless, the detection of these line land-
marks presents a challenge due to their elongated
form and diverse visual appearances, which often ren-
der them indiscernible from other similar patterns in
the environment. Such ambiguity poses a challenge
to perception algorithms and complicates the data an-
notation process, potentially resulting in discrepan-
cies in the training data for deep learning models. In
this work, the focus is on line identification for park-
ing systems, given the critical role of precise navi-
gation especially in densely populated parking envi-
ronments. Accurate detection of spatial parameters is
pivotal for optimal space utilization, enabling the ve-
hicle to align itself accurately within a parking spot’s
bounds. This accuracy becomes particularly vital dur-
ing complex parking maneuvers, like parallel parking,
where navigating through tight spaces with minimal
margin for error is imperative.
Traditional line detection techniques, such as
those outlined in Wang et al. (2018) (Wang et al.,
2018), typically involve a two-stage process. The first
stage encompasses either semantic segmentation of
lines or direct regression of polynomial line coeffi-
cients in pixel space. The second stage involves pro-
jecting these lines into Birds Eye View (BEV) space,
often based on a flat-world assumption. However, this
methodology harbors several limitations, including a
lack of geographical awareness of road surface varia-
tions, such as ramps and slopes.
Furthermore, BEV-based lane detection models,
which are predominantly designed for lanes with spa-
tial consistency, cannot be directly applied to line de-
tection in parking scenarios. This is due to their re-
liance on spatial anchors (Garnett et al., 2019) and
offsets (Efrat et al., 2020), which are less effective
for lines that exhibit a diverse spatial spread, as op-
posed to the relatively uniform lanes encountered in
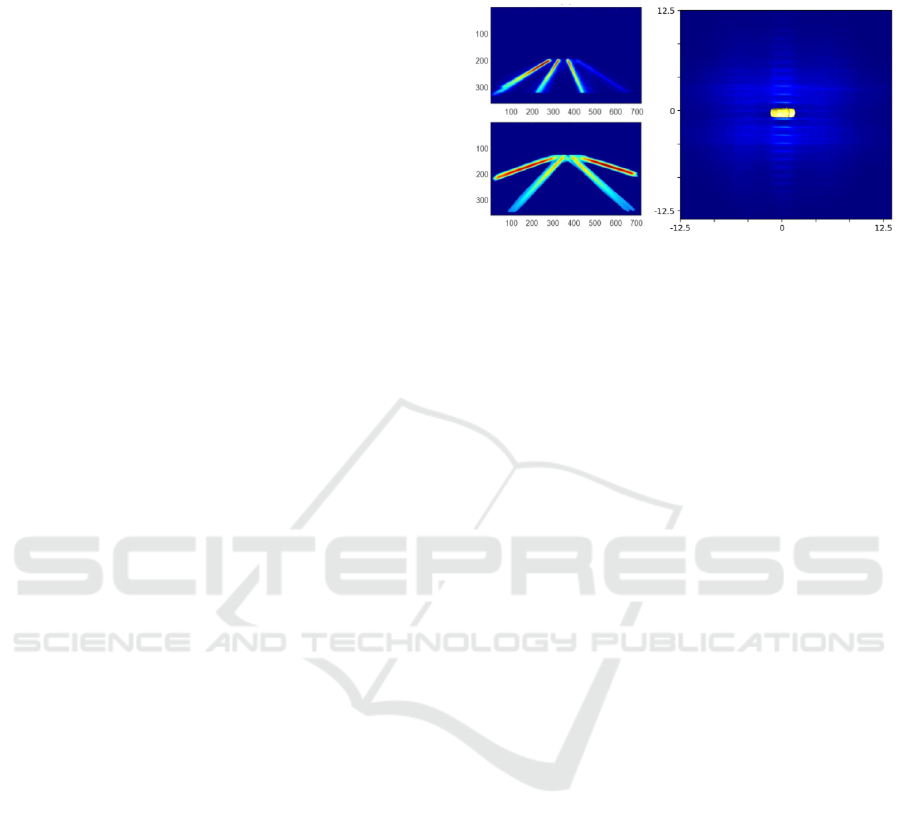
driving contexts. Figure 1 highlights the distribution
of lanes in two prominent public datasets, KITTI and
TuSimple (Wen et al., 2021), in pixel space, and con-
trasts it with the distribution of parking lines in our
dataset within a 25-meter range around the ego vehi-
cle, represented in yellow color. This stark contrast
underscores the necessity for a novel approach in line
detection specifically tailored to the complexities of
parking environments. The heatmap of lines is pre-
sented in the Bird’s Eye View (BEV) space, rather
than in the pixel space. This approach is chosen be-
cause in fisheye images, lines tend to be distributed
throughout, leading to clutter. Visualizing them in
the BEV space, which offers a top-view perspective in
Euclidean space, simplifies the analysis and enhances
clarity.
Figure 1: Left: Lanes Heatmap for KITTI and TuSimple
datasets in Pixel Space. Right: Parking Lines Heatmap in
our dataset in BEV Space with 25 meters around the ego
vehicle.
Addressing the challenges associated with line de-
tection necessitates the development of comprehen-
sive and robust detection strategies. These strategies
should account for the unique characteristics of line
landmarks, requiring the design of context-aware al-
gorithms capable of discerning subtle differences in
visual features. Furthermore, the algorithms need to
be efficient and real-time to accommodate the dy-
namic nature of parking environments and ensure
timely responses for real-time hardware in Level-3
automated vehicles.
To this end, our proposed methods aim to address
these challenges, and our primary contributions are
summarized as follows:
• We introduce a novel single shot deep detector for
parking lines, proficient in capturing the geomet-
ric intricacies of parking boundaries. This system
inherently exhibits resilience to challenging con-
ditions within parking environments.
• We introduced an alternative to the LSS method’s
cumsum trick for splatting the features to BEV
space, utilizing one-hot sparse encoding and ma-
trix multiplication for efficient points data pro-
cessing, thereby reducing computational com-
plexity and memory usage. The splatting tech-
nique works with any Inverse Perpective Mapping
based BEV projection models and it was demon-
strated with OFT BEV model as well.
• Our approach demonstrates its speed, efficiency,
and precision via rigorous testing with the large
scale surround view perception dataset for parking
line detection.
BEVFastLine: Single Shot Fast BEV Line Detection for Automated Parking Applications
221
2 RELATED WORK
We delve into prior studies that leverage surround-
view cameras, examine techniques associated with
processing surround-view images, and provide a con-
cise overview of methods used for line landmark de-
tection, as outlined below.
2.1 Surround-View Camera System
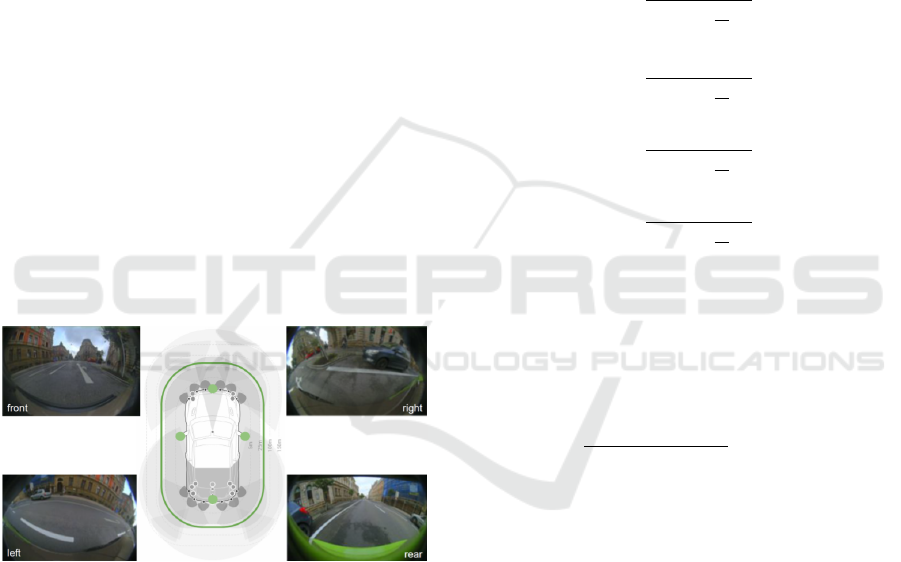
Owing to its large field-of-view (Kumar et al., 2023)
of 190°, the surround-view camera system has gained
significant popularity in the realm of near-field visual
perception (Kumar et al., 2021). A near-filed percep-
tion involves accurate localization within 10-15 me-
ters around the ego vehicle. A typical such system
(figure 2) in autonomous parking frameworks (Ku-
mar et al., 2020; Yahiaoui et al., 2019), integrates four
fisheye cameras positioned on the ego-vehicle. Such
a configuration ensures a comprehensive capture of
objects in close proximity, facilitating dependable vi-
sual perception. Our dataset, while derived from the
comprehensive Woodscape collection established by
(Yogamani et al., 2021), includes a subset of data not
previously released, reserved for commercial use due
to stringent data protection policies and privacy con-
siderations in line with EU GDPR and Chinese data
laws.
Figure 2: Data capture setup with 4 fisheye surround view
cameras covering 360°around the vehicle.
2.2 Orthographic Feature Transform
(OFT)
The Orthographic Feature Transform (OFT) method
reprojects image-based features into an orthographic
3D space, enhancing spatial configuration under-
standing (Roddick et al., 2018). This technique,
though primarily developed for 3D object detection,
holds significant promise for applications like lines
and curb detection due to its unique feature process-
ing approach.
In the initial phase, a Convolutional Neural Net-
work (CNN) serves as the front-end feature extractor,
processing the input image to identify various fea-
tures, mathematically represented as a feature map
f (u, v), where (u, v) coordinates correspond to the im-
age plane. The OFT populates a 3D voxel feature map
g(x, y, z), with each voxel in g corresponding to a 3D
space region and associated with a specific 2D image
feature map area. The mapping from a voxel to the
image plane is approximated by a bounding box, cal-
culated based on intrinsic camera parameters and the
voxel’s 3D world coordinates. The relationship is ex-
pressed as:
u
1
= f ·
(x − 0.5r)
z +0.5
x
|x|
r
+ c
u
(1)
v
1
= f ·
(y −0.5r)
z +0.5
y
|y|
r
+ c
v
(2)
u
2
= f ·
(x + 0.5r)
z −0.5
x
|x|
r
+ c
u
(3)
v
2
= f ·
(y +0.5r)
z −0.5
y
|y|
r
+ c
v
(4)
where r represents the voxel size, and [u1, u2] and
[v1, v2] define the corresponding voxel’s bounding
box in the image plane.
Features within the defined bounding box on the
image are aggregated (typically by average pooling)
to assign a feature vector to the voxel, represented as:
g(x, y, z) =
1
(u
2
− u
1
)(v
2
− v
1
)
u
2
∑
u=u
1
v
2
∑
v=v
1
f (u, v) (5)
with the summation over [u1, u2] and [v1, v2].
The 3D voxel feature map g undergoes transfor-
mation into an orthographic feature map h(x, z), col-
lapsing the 3D map down to a 2D bird’s-eye view rep-
resentation, removing the original image’s perspec-
tive effects. This process might involve summing fea-
tures along the vertical axis or employing more com-
plex transformation matrices, such as:
h(x, z) =
y
0
+H
∑
y=y
0
W (y)g(x, y, z) (6)
where W (y) are learned weight matrices, and the sum-
mation occurs over the voxel map’s height y (Roddick
et al., 2018).
In the context of lines detection, OFT’s transfor-
mation of complex 3D information into a simplified
VISAPP 2024 - 19th International Conference on Computer Vision Theory and Applications
222

2D orthographic representation is invaluable. The or-
thographic view provides a consistent scale for fea-
tures, crucial for detecting lines and curbs that ap-
pear distorted in perspective images. The OFT en-
sures well-represented features of lines and curbs
through feature aggregation in the voxel and ortho-
graphic maps. This representation highlights the con-
sistent characteristics of lines and curbs, simplify-
ing detection. Furthermore, the orthographic map
enhances spatial reasoning, as the relative position-
ing and orientation of lines and curbs are easily in-
terpreted in orthographic space. This facilitation is
particularly beneficial in complex scenarios like in-
tersections or curved roads. Lastly, the orthographic
feature map can integrate with further neural network
stages specifically designed for lines and curbs detec-
tion, leading to more accurate and reliable detections
in autonomous driving systems.
2.3 Lift, Splat, Shoot (LSS)
In the domain of autonomous vehicle perception,
the “Lift, Splat, Shoot” (LSS) framework repre-
sents a significant advancement, addressing the chal-
lenge of integrating multi-camera data into a co-
herent bird’s-eye-view (BEV) representation (Philion
and Fidler, 2020). The LSS model adheres to cru-
cial symmetries—translation equivariance, permuta-
tion invariance of camera inputs, and ego-frame isom-
etry equivariance—facilitating a unified scene inter-
pretation in the ego vehicle frame. This approach
overcomes limitations of single-image detectors that
cannot fully exploit the multi-viewpoint sensory in-
formation.
The LSS process begins with the “Lift” stage,
where images are transformed into a shared 3D space
without the reliance on depth sensors, generating a
latent depth distribution for each pixel across a range
of discrete depths. This results in a comprehensive
point cloud that encapsulates the scene from all cam-
eras in a frustum-shaped structure. The subsequent
“Splat” stage involves an efficient pillar pooling tech-
nique that transforms the point cloud into a 2D BEV
grid. This grid is then processed by a conventional
CNN, enabling BEV semantic segmentation or mo-
tion planning. A key innovation in this stage is the
use of a cumulative sum operation that optimizes the
pooling step, significantly enhancing the model’s ef-
ficiency.
Finally, the “Shoot” stage of the LSS model is
tailored for motion planning. By evaluating various
trajectories on the inferred cost map, the model se-
lects the trajectory with the minimum associated cost.
This approach allows for end-to-end differentiability,
where the model learns to fuse camera inputs and op-
timizes for motion planning objectives concurrently.
The LSS model’s capability to learn data-driven fu-
sion across cameras and its backpropagation-friendly
architecture enables a level of adaptability and learn-
ing potential not seen in previous models, which is
empirically demonstrated to be effective in fusing in-
formation and aiding motion planning in autonomous
driving tasks.
2.4 Line Landmarks Detection
Line segment detection has evolved significantly from
traditional image gradient-based methods to more so-
phisticated learning-based techniques. Initially, meth-
ods relied on image gradients, with early approaches
thresholding gradient magnitude to identify strong
edges and aligned pixel sets. These techniques, while
fast and accurate, often faltered in noisy or low-
illumination conditions.
In contrast, recent learning-based methods have
showcased remarkable advancements. Huang et al.
(Huang et al., 2018) and (Huang et al., 2020) intro-
duced end-to-end trainable CNNs, enhancing detec-
tion in man-made environments and developing the
TP-LSD model for real-time detection. Xu et al. (Xu
et al., 2021) leveraged Transformers for line segment
detection, significantly refining the process. Lin et
al. (Lin et al., 2020) merged classical techniques with
deep learning, while Gao et al. (Gao et al., 2022) fo-
cused on camera pose refinement through point and
line optimization. However, these developments have
not directly addressed the unique challenges of park-
ing line detection in BEV space using fisheye cam-
eras.
The ULSD method, as proposed by Li et al. (Li
et al., 2021), offers a significant advancement in line
segment detection across various camera types. This
end-to-end network leverages the B
´
ezier curve model
to achieve a model-free representation of line seg-
ments, which is particularly beneficial for images
with distortion, such as those from fisheye or spher-
ical cameras. The approach is independent of camera
distortion parameters, simplifying the detection pro-
cess for both distorted and undistorted images. De-
spite these advantages, the paper does not extensively
address computational efficiency or real-time pro-
cessing capabilities, which are critical for deployment
in autonomous systems. Further, while the method
performs well on the constructed datasets, its adapt-
ability to a broader range of real-world scenarios re-
mains to be thoroughly assessed.
An important aspect to note is that these methods
operate in the pixel domain, and the line detections
BEVFastLine: Single Shot Fast BEV Line Detection for Automated Parking Applications
223

must be projected into the metric (BEV) space for
vehicle navigation planning. This projection poses
a significant challenge as it typically assumes a flat
ground surface, not accounting for varying road con-
ditions like slopes or ramps. Such an assumption can
lead to unacceptable localization errors, particularly
in precise navigation applications such as parking in
tight spaces. This underscores the need for advanced
methodologies capable of accurately interpreting and
adapting to the complex topography within the learn-
ing models. Though BEV perception using both
IPM (Inverse Perspective Mapping) and Transformer-
based methods has made strides in lane detection,
these techniques often rely on anchors and offsets.
This reliance limits their applicability to spatially con-
sistent patterns like lanes, and less so to more diverse,
spatially occurring categories such as parking lines or
curbs.
3 METHODS
Our architecture, BEVFastLine, comprises three key
stages: an image encoder, a fast splatting technique
for feature projection into BEV space, and a BEV en-
coder followed by a Single Shot Line Detection net-
work. (Figure 3).
3.1 LIFT Features
Images captured by four Surround View System
(SVS) cameras undergo processing via an Efficient-
Net B0 encoder, which facilitates the extraction of
embeddings. This approach aligns with the method-
ology employed in the Lift-Splat-Shoot (LSS) system
(Philion and Fidler, 2020).The images processed have
a resolution of 1024x856 pixels. The EfficientNet-B0
encoder subsequently produces feature maps with a
resolution of 64x54x512. These image features are
further processed by a depth net convolutional net-
work, which is designed to extract 17 depth features
maintaining the same spatial resolution. Additionally,
64 context features are extracted at the same reso-
lution. The depth features from each camera extend
over a spatial range of 10 meters, effectively covering
a 10-meter radius around the central vehicle.
3.2 FastSplat over Splatting
In the Lift, Splat, Shoot (LSS) approach, the ”cumu-
lative sum trick” is a central mechanism employed to
efficiently splat the features from an entire sensor rig
to BEV. This trick operates by sorting all points based
on their bin id (grid location in BEV Space), execut-
ing a cumulative sum over all features, and then sub-
tracting the cumulative sum values at the boundaries
of the bin sections. This method was designed to
enhance memory efficiency, which would otherwise
be used for padding during sum pooling across pil-
lars (see Figure 4). The cumulative sum operation is
central to this approach, effectively aggregating data
for subsequent algorithmic steps. However, it is not
without drawbacks. The necessity for sorting and the
scatter operation for summing are both computation-
ally intensive and not optimally compatible with neu-
ral accelerators, which typically expedite inference by
distributing vector algebraic operations.
In contrast to the LSS framework, our FastSplat
method, depicted in Figure 4, adopts a distinctive ap-
proach by forgoing the cumulative sum trick. Instead,
it utilizes a one-hot sparse encoding technique for
identifying the bin id of each point. In this method,
each bin id is represented by a unique one-hot en-
coded vector, marked by a single ’1’ in its corre-
sponding position, with all other elements set to ’0’.
This efficient encoding simplifies the differentiation
between various bin ids.
The process then involves matrix multiplication of
these one-hot encoded points with the camera features
to compute the Bird’s Eye View (BEV) features. Fast-
Splat offers a 4X speed in splatting due the two pri-
mary advantages:
• It obviates the need for a sorting operation,
which typically has a computational complexity
of O(nlog n), where ’n’ is the number of grid cells
in BEV space.
• The method replaces the cumsum trick, which at
its core is a scatter operation involving summation
based on an index vector. This operation is not a
standard vector algebraic process, making it un-
suitable for neural engines on edge devices. By
modeling the process as generalized matrix mul-
tiplication, FastSplat aligns well with the capabil-
ities of neural accelerators, which are essentially
matrix multiplication engines.
The Fast Split module receives its inputs from
the Lift Module and Camera Frustums, with a sig-
nificant modification in the approach to camera ge-
ometry. Unlike the method employed by Philion et
al. (2020) (Philion and Fidler, 2020), which utilizes
pinhole camera geometry for frustum creation, our
approach adapts the camera frustums to fisheye ge-
ometry. This adaptation is achieved using a polyno-
mial distortion camera model, a technique compre-
hensively described by Usenko et al. (2018).
VISAPP 2024 - 19th International Conference on Computer Vision Theory and Applications
224
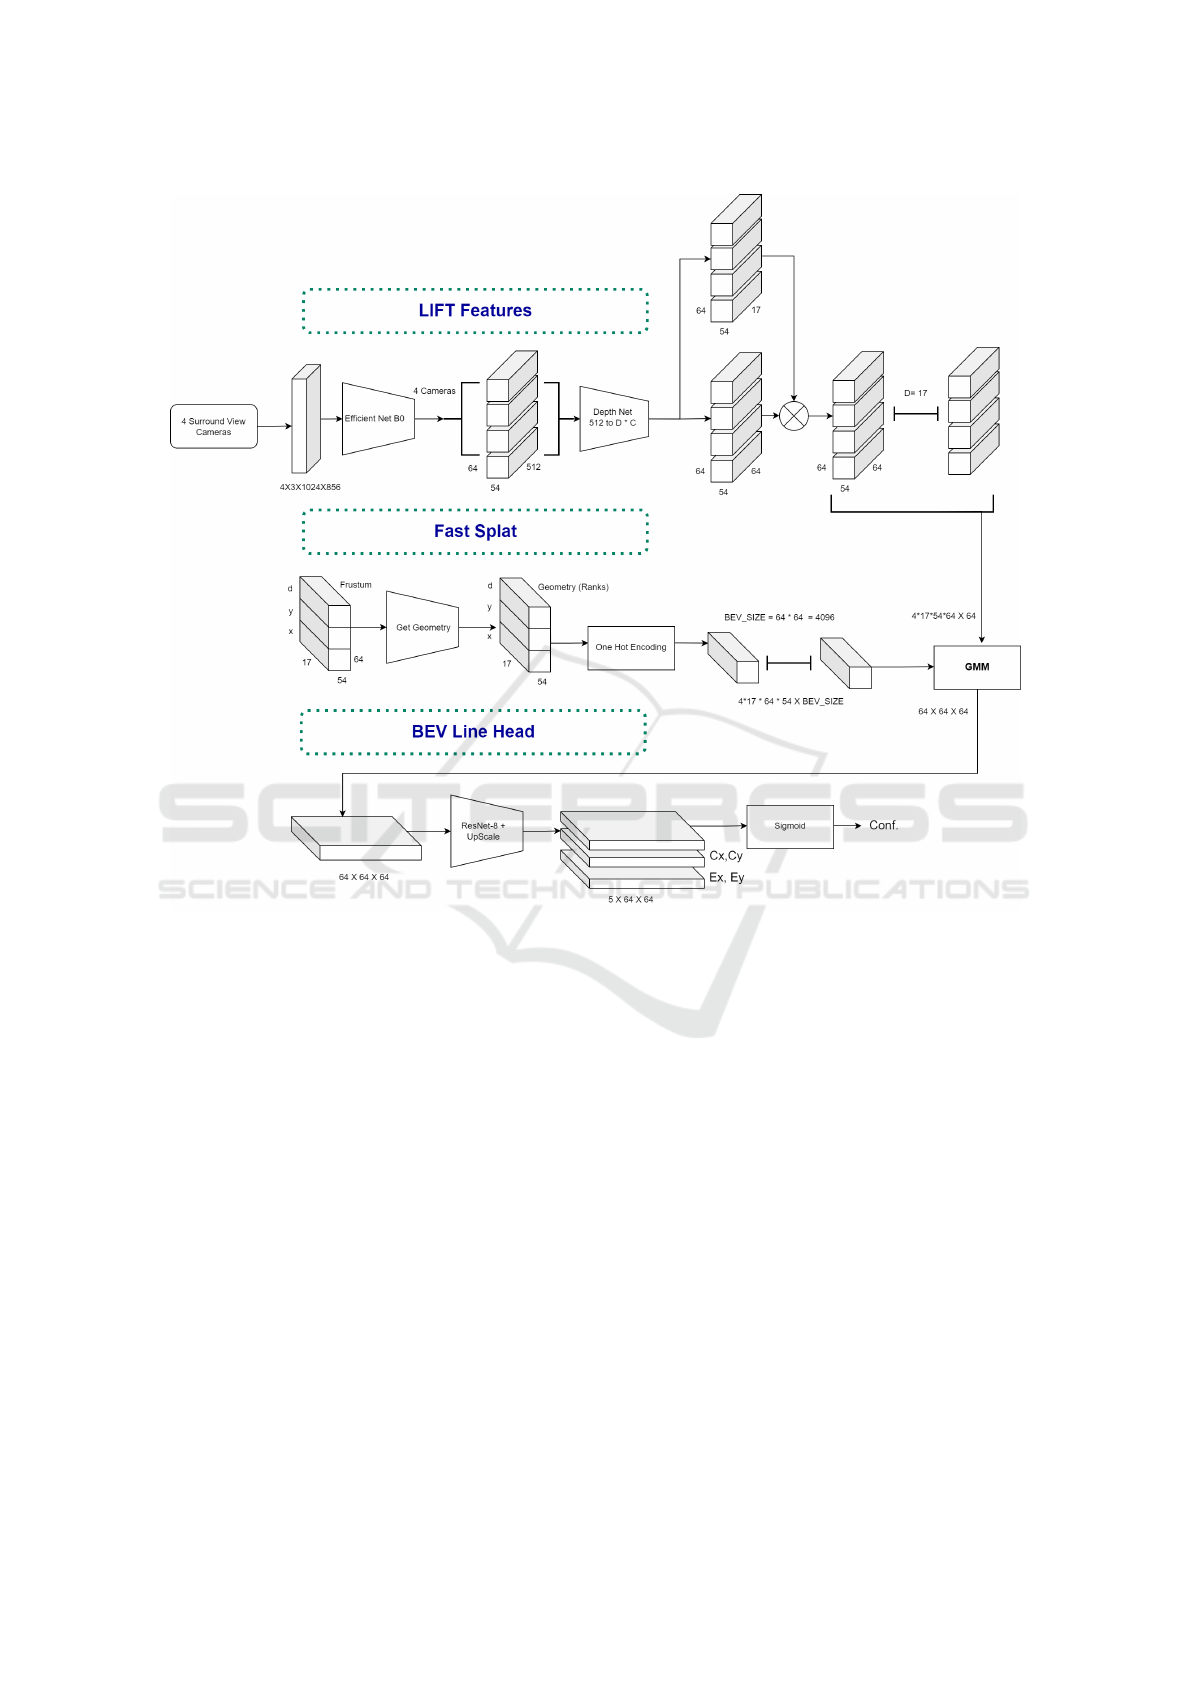
Figure 3: Illustration of the Proposed Method Featuring Fast Lifting and Single Shot Line Detection Head. The notation
used in the method includes D, representing the Number of Depths; C, indicating the Number of Cameras; Cx and Cy, which
denote the Center of the Line; and Ex and Ey, signifying the Endpoints of the Line in the X and Y directions, respectively.
3.3 Single Shot Line Head
Though methods like ULSD offer a solution for di-
rect regression of a parametric line model, they are
not ideally suited for integrating into the BEV archi-
tectures due to computational issues as outlined be-
low:
• ULSD operates as a two-stage method. Initially,
a line proposal network generates potential line
candidates. These candidates are then used as
control points for a bezier model to compute uni-
form points. Subsequently, the point indices are
employed to extract feature vectors from the en-
coder block, which are then passed to a binary
classifier for line detection.
• Additionally, the concept of junctions and centers
in ULSD, and the associated learning process to
match them and form line proposals, involve com-
plex operations. These operations are not typi-
cally supported by hardware accelerators on em-
bedded systems, posing a challenge for real-time
application.
Our proposed model, directly regressing lines in
a grid fashion as shown in Figure 3, marks a signifi-
cant shift in line detection methodologies. By regress-
ing the line center and the lengths extending from it,
and employing a classification node for line existence
probability, our model aligns with the paradigm shift
observed in object detection. Similar to how single-
stage, anchor-free algorithms like (Zhou et al., 2019)
and (Tian et al., 2020) have provided effective al-
ternatives to the two-stage methods like (Ren et al.,
2016), our single-stage line detection approach of-
fers a comparable alternative in the line detection ap-
proach. This represents a notable advancement, mir-
roring the evolution seen in object detection towards
more efficient and streamlined models.
BEVFastLine: Single Shot Fast BEV Line Detection for Automated Parking Applications
225
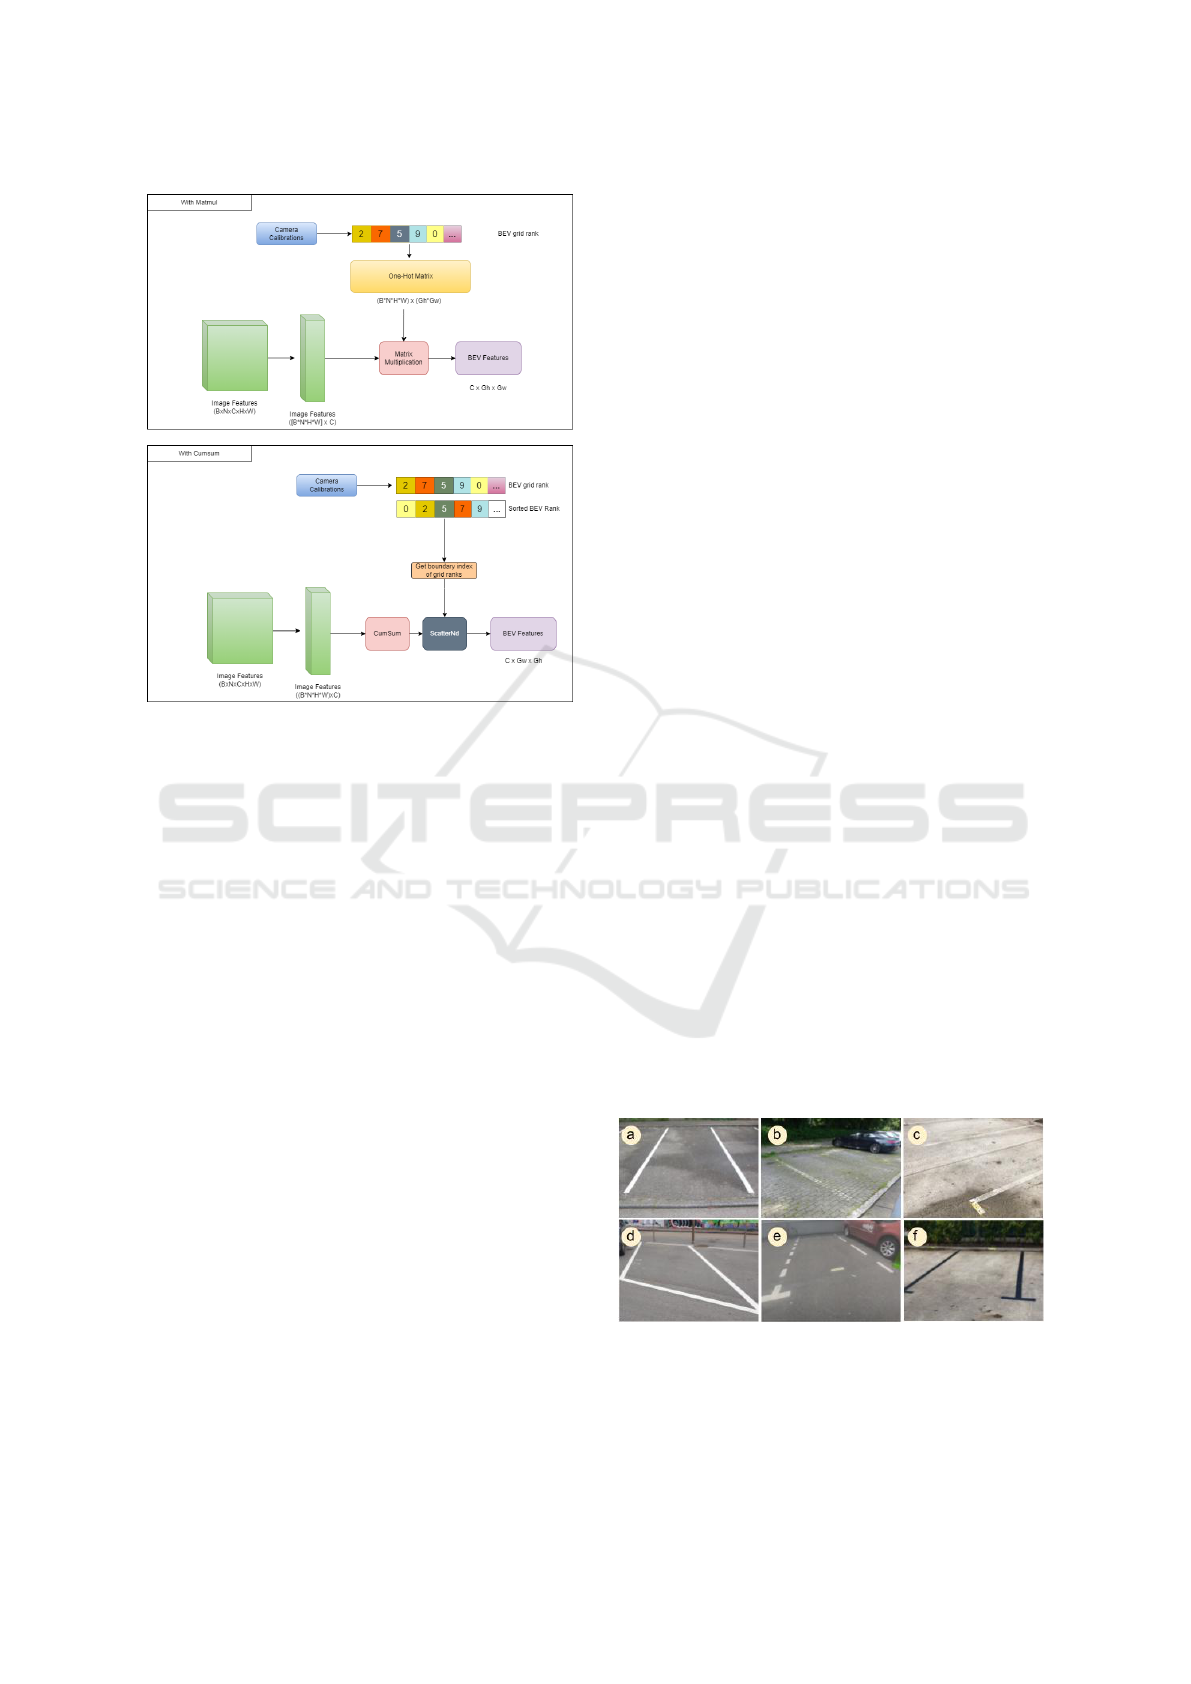
Figure 4: TOP: Fast Splatting with Sprase Matrix Multipli-
cation. Bottom: Point Pillars based Splatting using Cumu-
lative Sum.
4 EXPERIMENTS
This section presents our methodology and the tech-
nical details behind the evaluation of our parking line
detection work. We discuss the setup used for training
our models, the characteristics of the commercial sub-
set of the dataset utilized, and the specific implemen-
tation strategies adopted. This section also details the
post-processing techniques that refine the output and
underscores the measures ensuring system reliability
across varied scenarios.
4.1 Experimental Setup
The experimental setup for evaluating our models
was conducted using high-performance computing re-
sources. Specifically, the models were trained on an
NVIDIA A100 GPU with 40 GB of memory, which
is well-suited for demanding deep learning tasks. We
chose a batch size of 4 to balance between computa-
tional efficiency and memory constraints.
For training times for the OFT and LSS ap-
proaches for an epoch are 1.6 and 1.5 hours respec-
tively. The choice of the optimizer was AdamW,
a variant of the Adam optimizer that incorporates a
decoupled weight decay regularization, which often
leads to better performance in deep learning models.
The learning rate was set to 1e − 4, providing a
suitable compromise between convergence speed and
stability of the training process. In the interest of fo-
cusing on the models’ ability to learn from raw data,
no augmentations were applied to either the image or
BEV representations during training. This decision
was made to assess the models’ performance under
unaltered data conditions, thus ensuring the evalua-
tion of their fundamental feature extraction and gen-
eralization capabilities.
4.1.1 Dataset
Our dataset, curated for the development and assess-
ment of our parking line detection system, comprises
images from fisheye cameras that encapsulate a 360-
degree view of parking environments. The image
set incorporates views from Front View (FV), Rear
View (RV), Mid-View Right (MVR), and Mid-View
Left (MVL) cameras, each capturing at a resolution
of 1024x856 pixels. The training subset consists of
12,574 timesteps, translating to 50,296 images across
all camera perspectives. For evaluation, the dataset
encompasses 3,529 timesteps, totaling 14,116 im-
ages. Here, a ’timestep’ denotes a singular temporal
instance with simultaneous captures from all cameras,
reflecting various parking scenarios as shown in Fig-
ure 5.
The timestamps are carefully sourced from 602
traces out of which 473 for training and 129 for val-
idation. The dataset offers sequences that showcase
continuity in line features, crucial for temporal con-
sistency and algorithmic robustness. Each sequence
represents a complete trajectory of the ego vehicle
from entering to exiting a parking area. Emphasiz-
ing geographic diversity, the dataset includes captures
from the Czech Republic (CZE), Ireland (IRL), and
the United States (USA), with 147, 416, and 45 traces,
respectively. This diversity ensures the adaptability of
our system to various parking layouts and conditions.
Figure 5: Parking Lines in Our dataset. a)Solid lines ,
b)Lines on cobble stones, c)Washed out lines, d) Angled
lines, e) Dashed lines and f) Colored lines.
VISAPP 2024 - 19th International Conference on Computer Vision Theory and Applications
226

Data collection was performed using six differ-
ent vehicles to affirm the model’s invariance to spe-
cific vehicle camera rig configurations. The environ-
mental contexts covered include a spectrum of park-
ing settings: city lots, indoor garages, urban parking
structures, and rural parking areas, with respective in-
stances of 5, 61, 491, and 51, thus providing extensive
exposure to various parking situations.
The dataset further addresses a variety of light-
ing conditions critical for parking applications: arti-
ficial lighting for indoor settings (61 instances), low-
light conditions found during dawn or dusk (6 in-
stances), and bright daylight scenarios typical for out-
door parking (511 instances). Street lighting condi-
tions, representing nighttime parking environments,
are included in 30 instances. This extensive range
of lighting conditions ensures the detection system is
thoroughly tested and capable of reliable performance
in real-world parking applications, ready for rigorous
training and evaluation.
4.1.2 Implementation Details
Our system processes four fisheye images by pass-
ing them to an EfficientNet-lite B0 inspired image en-
coder. This encoder consists of five reduction blocks,
reducing spatial dimensions and enhancing feature
depth, with a skip connection between the latter stages
to preserve context in the output features.
For the Orthographic Feature Transform (OFT)
projection, an adaptation for fisheye cameras aligns
with the SVS BEV grid using extrinsic parameters.
The BEV encoder then refines these features through
three reduction and two upsampling layers, culminat-
ing in a feature map tailored for line detection.
The lines decoder, with three branches, predicts
junction points, center points, and line segmentation.
It employs varied loss functions like binary cross en-
tropy and weighted L1 and smooth L1 losses for dif-
ferent prediction types. Post-processing utilizes non-
maximum suppression and max pooling on junction
maps, followed by matching and correction steps to
compute Lines of Interest (LOIs).
This streamlined process, emphasizing computa-
tional efficiency and modularity, ensures real-time ap-
plicability across diverse computational setups, main-
taining precision without excessive computational
load. In comparison to the standard semantic segmen-
tation model (LSS), which requires 14.8 TOPS (Tril-
lion Operations Per Second) for a 10 FPS (Frames Per
Second) throughput and incurs a post-processing time
of 4.8 seconds on a typical Intel Xeon PC equipped
with an Nvidia A100 GPU, our proposed BEVFast-
Line model demonstrates a similar computational de-
mand at 14.81 TOPS. However, it significantly re-
duces post-processing time to just 0.4 seconds. This
reduction in processing time translates into decreased
CPU cycle requirements and also enhancing overall
performance efficiency as detailed in Table 1.
The post-processing phase is only needed for the
baseline models (LSS & OFT) to convert the line seg-
mentation output to poly-line representation.
The post-processing phase is pivotal in transform-
ing the segmentation masks produced by the decoder
into vectorized line representations. Following bi-
nary thresholding to enhance the contrast between
line features and the background, the masks are skele-
tonized to single-pixel thickness, preserving the es-
sential structure of the lines.
Subsequent to skeletonization, any intersecting
lines are segmented at junctions to facilitate individ-
ual analysis. Connected Component Analysis (CCA)
is then utilized to identify and isolate these distinct
line segments. At this juncture, we employ B
´
ezier
curve fitting to model the geometry of each line seg-
ment accurately.
B
´
ezier curves offer a parametric approach to
defining curves and are particularly advantageous for
their scalability and the ease with which they can
model complex shapes. For relatively straight paths or
gentle curves, quadratic B
´
ezier curves are fitted using
the endpoints and a calculated control point from the
segmented lines. For more complex or sharply curv-
ing paths, cubic B
´
ezier curves are utilized, requiring
two control points in addition to the endpoints to ac-
curately trace the line’s trajectory.
By fitting B
´
ezier curves to the segmented lines,
our system generates a smooth and continuous repre-
sentation of road markings. These vectorized lines
are mathematically defined and easily manipulated,
which is essential for applications that rely on pre-
cise pathing, such as autonomous vehicle navigation
systems and advanced mapping services.
The fitting of B
´
ezier curves marks the final step
in the line detection process, concluding with the ex-
traction of endpoints for each curve. This compre-
hensive post-processing strategy ensures that our sys-
tem’s outputs are not only accurate in terms of spatial
positioning but also robust against the variability of
real-world driving environments.
5 PERFORMANCE EVALUATION
The effectiveness of our line landmark detection sys-
tem is assessed quantitatively through precision and
recall metrics, while also incorporating a spatial val-
idation method to determine the veracity of detected
line endpoints.
BEVFastLine: Single Shot Fast BEV Line Detection for Automated Parking Applications
227
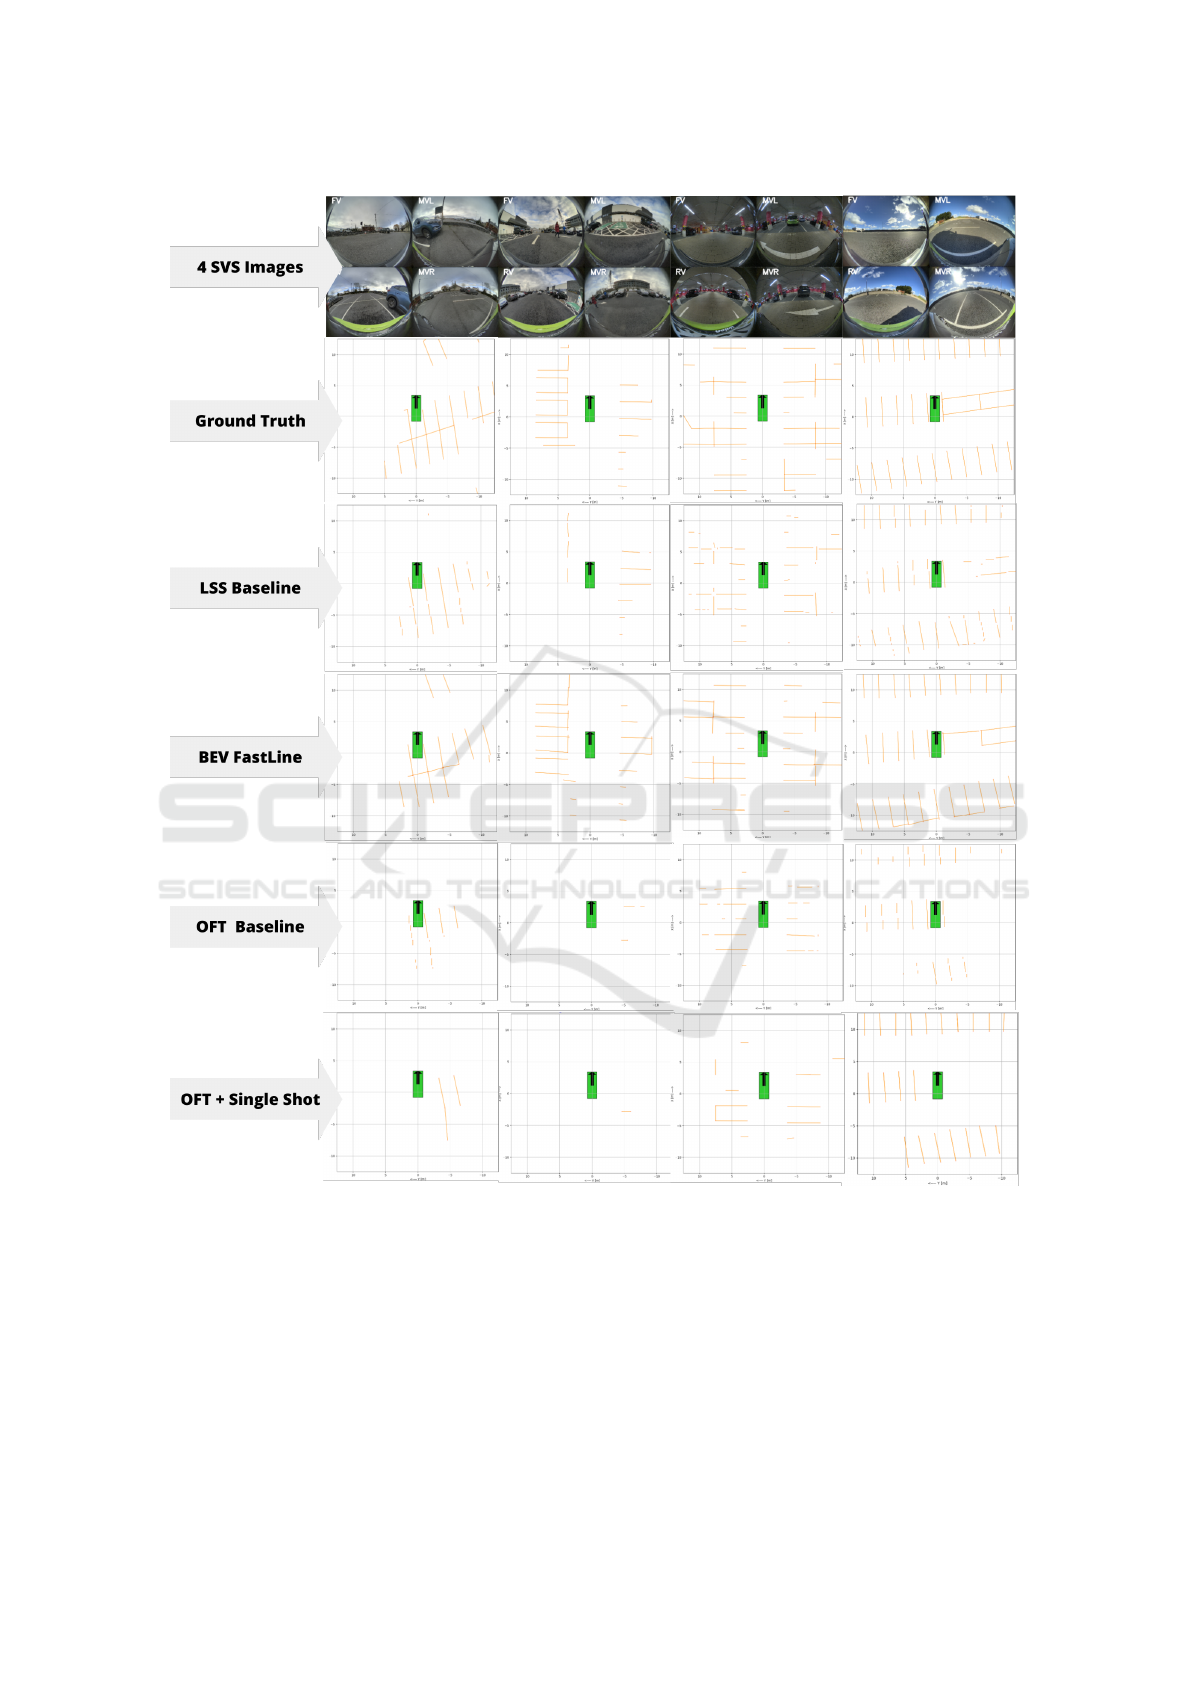
Figure 6: Qualitative Results on four samples from the test set.
5.1 Evaluation Criteria
True positive detections are validated if the predicted
line endpoint falls within a circle whose radius is at
certain percent of the distance (Circular Radius in 1
from the ego vehicle to the predicted endpoint. This
radius scales with distance to account for the relative
position of line features, recognizing that distant lines
allow for a larger margin of error due to perspective
effects (see Figure 7).
False positives are identified when predicted end-
points do not coincide with any ground truth line
within the scaled radius, indicating a detection where
no line feature exists. These criteria ensure that
our evaluation accounts for both the accuracy of line
placement and the needed scaling for positional er-
rors.
VISAPP 2024 - 19th International Conference on Computer Vision Theory and Applications
228
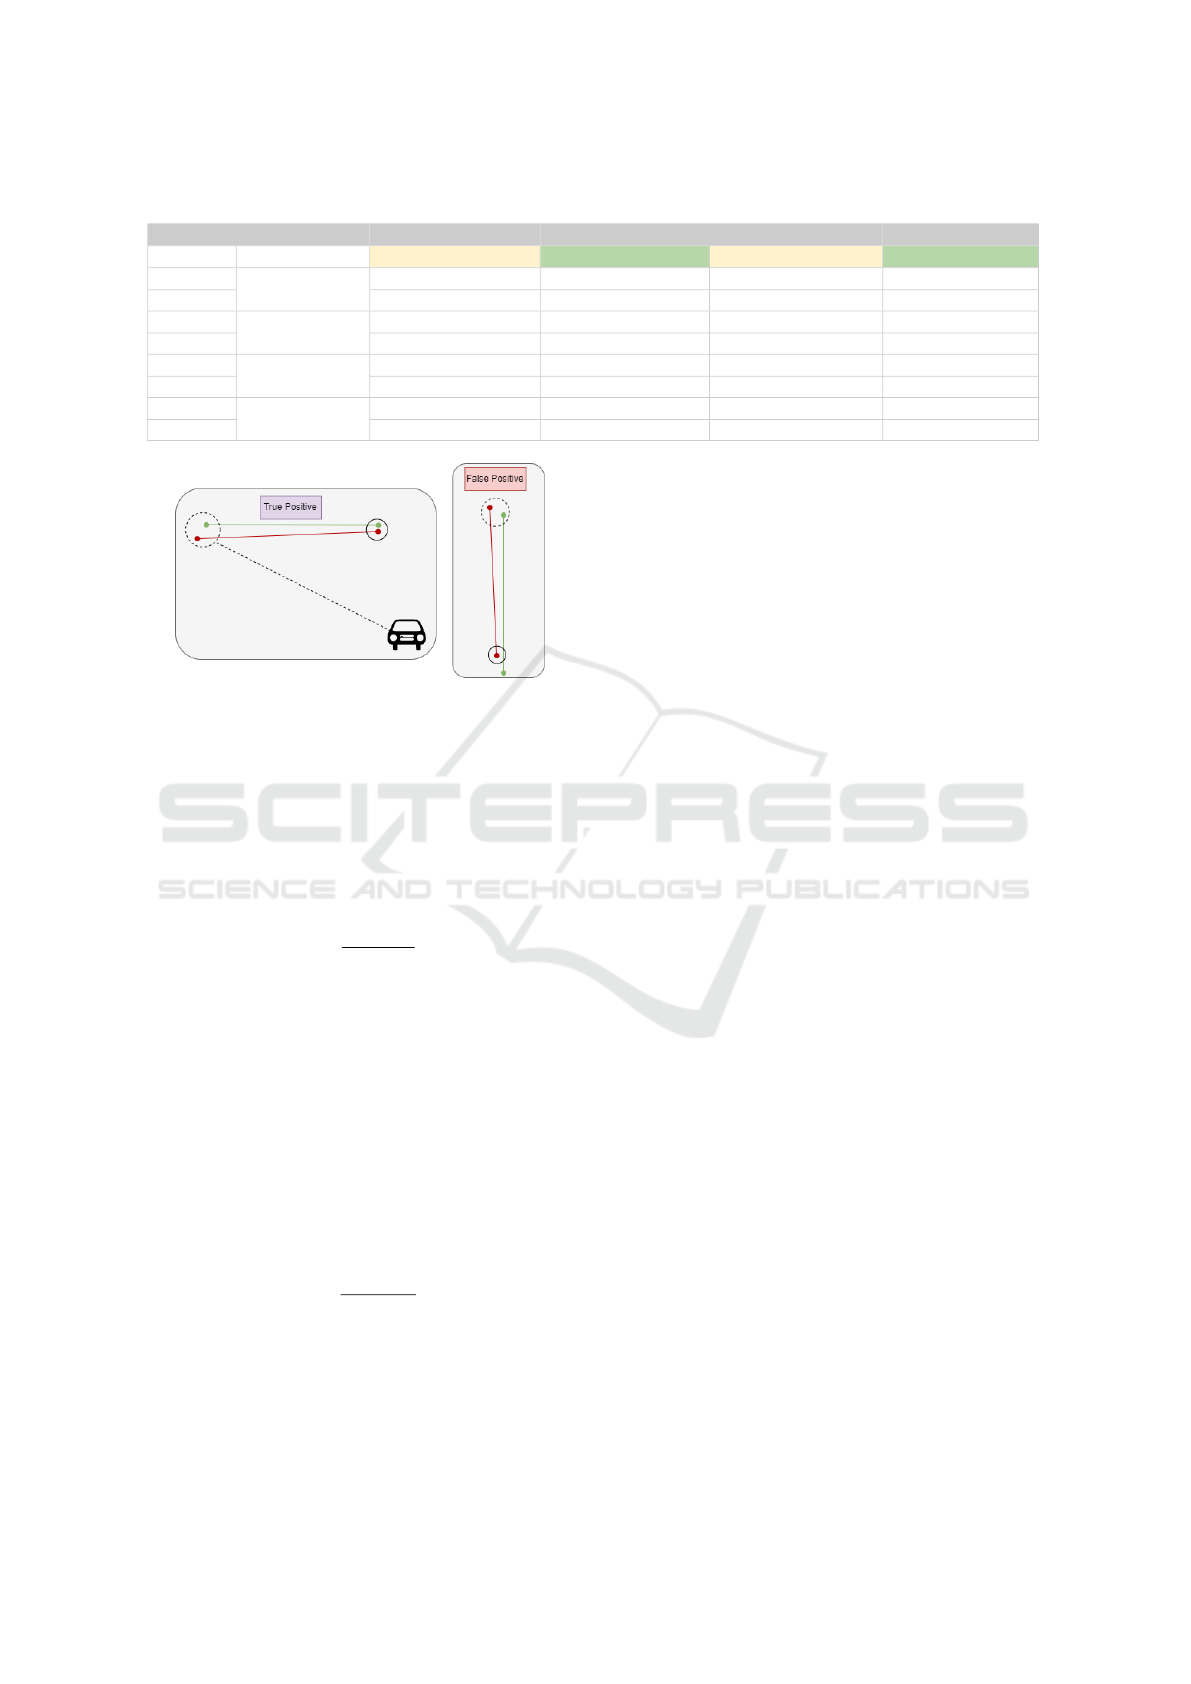
Table 1: Comparative Performance Metrics for Line Detection Approaches.
Experiment Baseline Proposed Baseline Proposed
Metrics Circular Radius LSS + Lines Derived BEV FastLine (LSS) OFT + Lines Derived OFT + Single Shot
Precision
20%
45 80.1 28.8 80.2
Recall 46.2 90 12 25.6
Precision
25%
51.1 81.3 33.7 82.4
Recall 52.5 71.1 13.8 26
Precision
30%
55.3 82.3 40.5 83.6
Recall 56.8 71.9 16.7 26.6
Precision
35%
59.6 83.4 47.3 84.8
Recall 61.2 72.6 19.6 27.2
Figure 7: Illustration of line detection evaluation criteria:
On the left, a True Positive (TP) where a predicted line’s
endpoints are within a set radius. On the right, a False Pos-
itive (FP) where any endpoint is outside this radius.
5.2 Precision
Precision is quantified by the ratio of true positive
detections to the total number of positive predictions
made by the model. The formula is as follows:
P =
T P
T P + FP
(7)
Here, T P represents true positives, corroborated
by the spatial validation method, and FP indicates
false positives, where predicted endpoints fall outside
the defined evaluation radius from any ground truth
line. High precision reflects the model’s ability to ac-
curately detect lines without triggering excessive false
alarms, crucial for reliable autonomous navigation.
5.3 Recall
Recall measures the model’s capacity to detect all per-
tinent line features present in the data:
R =
T P
T P + FN
(8)
FN denotes false negatives, where the model fails
to identify an actual line within the evaluation radius.
High recall signifies comprehensive detection cover-
age, vital for the completeness of navigational cues.
This evaluation methodology, encompassing both
precision and recall augmented with spatial valida-
tion, provides a robust measure of our system’s per-
formance, ensuring that detected lines are precise and
consistent with real-world locations relative to the ego
vehicle.
6 DISCUSSION
The comparative analysis of line detection methods,
as illustrated in Table 1, reveals a promising direc-
tion for the proposed BEV FastLine and OFT + Sin-
gleShot approaches. Both methods demonstrate sig-
nificant precision rates, with BEV FastLine achieving
80.1% and OFT + SingleShot reaching 80.2%, which
is approximately 2X higher than their respective base-
lines of 45% and 28.8%. This high precision suggests
a reduced rate of false positives, a crucial factor in au-
tonomous navigation where inaccurate line detection
could lead to misguidance or safety hazards.
Table 1 underscores the overall 2X improve-
ment (averaged over all metrics) achieved by single-
stage direct regression of lines as polylines in BEV
space. This approach contrasts with methods that per-
form segmentation followed by line fitting as a post-
processing operation. These improvements are con-
sistent across both architecture styles (LSS, OFT).
Figure 6 demonstrates the limitations of segmentation
models in fully regressing line structures, even with
extensive post-processing.
When considering recall, the BEV FastLine
method demonstrates a superior ability to detect rele-
vant line features with a recall of 90%, compared to
the OFT + SingleShot method which stands at 25.6%.
The higher recall of the BEVFastLine method is due
to the fact that LSS itself is superior to OFT and it
is more effective in identifying the presence of lines,
a quality that could prove crucial in complex driving
scenarios where every line marking is significant for
vehicle guidance and decision-making processes.
BEVFastLine: Single Shot Fast BEV Line Detection for Automated Parking Applications
229

The results indicate that while OFT provides a
framework for accurate line prediction when it de-
tects them, its overall line feature detection rate needs
enhancement. On the other hand, the BEV FastLine
demonstrates an improved balance between detecting
lines and maintaining a lower false positive rate.
These observations warrant further investigation
into the underlying factors contributing to the perfor-
mance disparities. It is conceivable that the intrinsic
characteristics of the LSS method, such as its focus
on learning from a comprehensive point cloud, may
afford it a broader detection capability. In contrast,
the OFT method’s dependence on transforming image
features to an orthographic view might limit its sensi-
tivity to certain types of line markings or variances in
environmental conditions.
7 CONCLUSIONS
In conclusion, our proposed methodologies intro-
duced in this study provide a significant advance-
ment in line landmark detection for autonomous park-
ing systems. The empirical results underscore the
precision of both methods, with the BEV FastLine
approach demonstrating a commendable balance be-
tween precision and recall. This balance is crucial for
real-world applications where accurate line detection
is instrumental in safe and reliable vehicle navigation.
The OFT + SingleShot method, also superior in
precision, when compared to baseline OFT based seg-
mentation model. The current work lays the founda-
tion for future enhancements in detection rates and
suggests that a hybrid approach may yield a more op-
timal solution. Such improvements are vital for nav-
igating complex environments and ensuring compre-
hensive line detection coverage.
The Fast Splatting technique introduced in our
work requires 4X less computational time when com-
pared to started cumsum operation and also suitable
for neural engines on the embedded systems.
Finally, the work delineated in this paper signif-
icantly enriches the evolving domain of autonomous
vehicle technologies. By highlighting the strengths
and areas for development in line landmark detection,
it steers future efforts towards creating more sophisti-
cated and robust systems. These systems will be es-
sential in realizing the full potential of autonomous
vehicles, ensuring safety, efficiency, and reliability in
automated parking and beyond.
ACKNOWLEDGEMENTS
The authors thank Valeo Vision System for their sup-
port, resources, and the opportunity to contribute to
the broader research community with this work.
REFERENCES
Canny, J. (1986). A computational approach to edge de-
tection. IEEE Transactions on pattern analysis and
machine intelligence, (6):679–698.
Efrat, N., Bluvstein, M., Oron, S., Levi, D., Garnett, N., and
Shlomo, B. E. (2020). 3d-lanenet+: Anchor free lane
detection using a semi-local representation.
Gao, S., Wan, J., Ping, Y., Zhang, X., Dong, S., Yang, Y.,
Ning, H., Li, J., and Guo, Y. (2022). Pose refinement
with joint optimization of visual points and lines. In
2022 IEEE/RSJ International Conference on Intelli-
gent Robots and Systems (IROS), pages 2888–2894.
IEEE.
Garnett, N., Cohen, R., Pe’er, T., Lahav, R., and Levi, D.
(2019). 3d-lanenet: End-to-end 3d multiple lane de-
tection.
Hough, P. V. (1962). Method and means for recognizing
complex patterns. US Patent 3,069,654.
Huang, K., Wang, Y., Zhou, Z., Ding, T., Gao, S., and Ma,
Y. (2018). Learning to parse wireframes in images of
man-made environments. In Proceedings of the IEEE
Conference on Computer Vision and Pattern Recogni-
tion, pages 626–635.
Huang, S., Qin, F., Xiong, P., Ding, N., He, Y., and Liu,
X. (2020). Tp-lsd: Tri-points based line segment de-
tector. In European Conference on Computer Vision,
pages 770–785. Springer.
Kumar, V. R., Eising, C., Witt, C., and Yogamani, S. (2023).
Surround-view fisheye camera perception for auto-
mated driving: Overview, survey & challenges. IEEE
Transactions on Intelligent Transportation Systems.
Kumar, V. R., Hiremath, S. A., Bach, M., Milz, S., Witt,
C., Pinard, C., Yogamani, S., and M
¨
ader, P. (2020).
Fisheyedistancenet: Self-supervised scale-aware dis-
tance estimation using monocular fisheye camera for
autonomous driving. In 2020 IEEE international con-
ference on robotics and automation (ICRA), pages
574–581. IEEE.
Kumar, V. R., Yogamani, S., Rashed, H., Sitsu, G., Witt,
C., Leang, I., Milz, S., and M
¨
ader, P. (2021). Om-
nidet: Surround view cameras based multi-task visual
perception network for autonomous driving. IEEE
Robotics and Automation Letters, 6(2):2830–2837.
Lee, Y. and Park, M. (2021). Around-view-monitoring-
based automatic parking system using parking line de-
tection. Applied Sciences, 11(24):11905.
Li, H., Yu, H., Wang, J., Yang, W., Yu, L., and Scherer,
S. (2021). Ulsd: Unified line segment detection
across pinhole, fisheye, and spherical cameras. IS-
PRS Journal of Photogrammetry and Remote Sensing,
178:187–202.
VISAPP 2024 - 19th International Conference on Computer Vision Theory and Applications
230

Lin, Y., Pintea, S. L., and van Gemert, J. C. (2020). Deep
hough-transform line priors. In Computer Vision–
ECCV 2020: 16th European Conference, Glasgow,
UK, August 23–28, 2020, Proceedings, Part XXII 16,
pages 323–340. Springer.
Philion, J. and Fidler, S. (2020). Lift, splat, shoot: Encod-
ing images from arbitrary camera rigs by implicitly
unprojecting to 3d. In Computer Vision–ECCV 2020:
16th European Conference, Glasgow, UK, August 23–
28, 2020, Proceedings, Part XIV 16, pages 194–210.
Springer.
Ren, S., He, K., Girshick, R., and Sun, J. (2016). Faster
r-cnn: Towards real-time object detection with region
proposal networks.
Roddick, T., Kendall, A., and Cipolla, R. (2018). Ortho-
graphic feature transform for monocular 3d object de-
tection. arXiv preprint arXiv:1811.08188.
Tian, Z., Shen, C., Chen, H., and He, T. (2020). Fcos: A
simple and strong anchor-free object detector.
Wang, Z., Ren, W., and Qiu, Q. (2018). Lanenet: Real-
time lane detection networks for autonomous driving.
arXiv preprint arXiv:1807.01726.
Wen, T., Yang, D., Jiang, K., Yu, C., Lin, J., Wijaya, B.,
and Jiao, X. (2021). Bridging the gap of lane detec-
tion performance between different datasets: Unified
viewpoint transformation. IEEE Transactions on In-
telligent Transportation Systems, 22(10):6198–6207.
Xu, Y., Xu, W., Cheung, D., and Tu, Z. (2021). Line seg-
ment detection using transformers without edges. In
Proceedings of the IEEE/CVF Conference on Com-
puter Vision and Pattern Recognition, pages 4257–
4266.
Yahiaoui, M., Rashed, H., Mariotti, L., Sistu, G., Clancy,
I., Yahiaoui, L., Kumar, V. R., and Yogamani, S.
(2019). Fisheyemodnet: Moving object detection on
surround-view cameras for autonomous driving. arXiv
preprint arXiv:1908.11789.
Yogamani, S., Hughes, C., Horgan, J., Sistu, G., Var-
ley, P., O’Dea, D., Uricar, M., Milz, S., Simon, M.,
Amende, K., Witt, C., Rashed, H., Chennupati, S.,
Nayak, S., Mansoor, S., Perroton, X., and Perez, P.
(2021). Woodscape: A multi-task, multi-camera fish-
eye dataset for autonomous driving.
Zakaria, N. J., Shapiai, M. I., Ghani, R. A., Yasin, M.,
Ibrahim, M. Z., and Wahid, N. (2023). Lane detection
in autonomous vehicles: A systematic review. IEEE
Access.
Zhou, X., Wang, D., and Kr
¨
ahenb
¨
uhl, P. (2019). Objects as
points.
BEVFastLine: Single Shot Fast BEV Line Detection for Automated Parking Applications
231
