Predicting Children’s Myopia Risk: A Monte Carlo Approach to
Compare the Performance of Machine Learning Models
Piotr Artiemjew
1 a
, Radosław Cybulski
1 b
, Mohammad Hassan Emamian
2 c
,
Andrzej Grzybowski
3 d
, Andrzej Jankowski
1
, Carla Lanca
4,8 e
, Shiva Mehravaran
5 f
,
Marcin Mły
´
nski
1 g
, Cezary Morawski
1
, Klaus Nordhausen
6 h
, Olavi P
¨
arssinen
7 i
and Krzysztof Ropiak
1 j
1
University of Warmia and Mazury in Olsztyn, Poland
2
Ophthalmic Epidemiology Research Center, Shahroud University of Medical Sciences, Shahroud, Iran
3
Foundation for Ophthalmology Development & University of Warmia and Mazury, Poland
4
Lisbon School of Health Technology, Lisbon, Portugal
5
Department of Biology, School of Computer, Mathematical, and Natural Sciences, Morgan State University, U.S.A.
6
Department of Mathematics and Statistics, University of Jyv
¨
askyl
¨
a, Finland
7
Gerontology Research Centre and Faculty of Sport and Health Sciences, University of Jyv
¨
askyl
¨
a, Finland
8
Comprehensive Health Research Center (CHRC), Escola Nacional de Sa
´
ude P
´
ublica, Universidade Nova de Lisboa,
Lisboa, Portugal
Keywords:
Myopia Prediction, Machine Learning, Data Analysis, Monte Carlo Simulations, Lasso Regression.
Abstract:
This study presents the initial results of the Myopia Risk Calculator (MRC) Consortium, introducing an inno-
vative approach to predict myopia risk by using trustworthy machine-learning models. The dataset included
approximately 7,945 records (eyes) from 3,989 children. We developed a myopia risk calculator and an ac-
companying web interface. Central to our research is the challenge of model trustworthiness, specifically
evaluating the effectiveness and robustness of AI (Artificial Intelligence)/ML (Machine Learning)/NLP (Nat-
ural Language Processing) models. We adopted a robust methodology combining Monte Carlo simulations
with cross-validation techniques to assess model performance. Our experiments revealed that an ensemble
of classifiers and regression models with Lasso regression techniques provided the best outcomes for predict-
ing myopia risk. Future research aims to enhance model accuracy by integrating image and synthetic data,
including advanced Monte Carlo simulations.
a
https://orcid.org/0000-0001-5508-9856
b
https://orcid.org/0000-0003-1289-5318
c
https://orcid.org/0000-0002-1994-1105
d
https://orcid.org/0000-0002-3724-2391
e
https://orcid.org/0000-0001-9918-787X
f
https://orcid.org/0000-0002-4249-3304
g
https://orcid.org/0000-0001-6869-078X
h
https://orcid.org/0000-0002-3758-8501
i
https://orcid.org/0000-0002-2976-8174
j
https://orcid.org/0000-0001-8314-0276
1 INTRODUCTION
1.1 The Role of AI/ML/NLP in
Diagnosing the Risk of Myopia in
Children
Global Perspective: The increasing prevalence of
myopia, particularly among children, represents a sig-
nificant public health challenge (World Health Orga-
nization, 2015). Characterized by the eye’s inability
to focus on distant objects, myopia not only compro-
mises the quality of life but also predisposes individu-
1092
Artiemjew, P., Cybulski, R., Emamian, M., Grzybowski, A., Jankowski, A., Lanca, C., Mehravaran, S., Mły
´
nski, M., Morawski, C., Nordhausen, K., Pärssinen, O. and Ropiak, K.
Predicting Children’s Myopia Risk: A Monte Carlo Approach to Compare the Performance of Machine Learning Models.
DOI: 10.5220/0012435500003636
In Proceedings of the 16th International Conference on Agents and Artificial Intelligence (ICAART 2024) - Volume 3, pages 1092-1099
ISBN: 978-989-758-680-4; ISSN: 2184-433X
Copyright © 2024 by Paper published under CC license (CC BY-NC-ND 4.0)

als to serious ocular conditions and visual impairment
later in life (Haarman et al., 2020). Over the past few
decades, the prevalence of myopia has increased on
a large scale, especially in East and Southeast Asian
countries, where the prevalence of myopia in young
adults is 80-90%, and an accompanying high preva-
lence of high myopia in young adults (10-20%) (Mor-
gan et al., 2012; Morgan et al., 2018). Several studies
have shown connections of myopia with parental my-
opia, longer education, more near work time , and less
time spent outdoors (Huang et al., 2015; P
¨
arssinen
and Kauppinen, 2022). In addition to the above fac-
tors, numerous other factors can influence the onset
and progression of myopia. Due to those factors, there
is great individual variation in the development of my-
opia and its progression. For the prevention of myopia
and slowing its progression, it is of great interest to
have prediction tools to know in advance which chil-
dren are at risk of developing myopia. The methods
developed in this manuscript aim to improve the pre-
dictability of the development of myopia.
Application to Myopia Diagnosis: In myopia
management, these technologies may have a crucial
role in the development of screening tools that ac-
curately predict the onset and progression of my-
opia in children. AI algorithms can analyze vast
datasets, identifying patterns that precede myopia de-
velopment. For instance, machine learning models
have been trained to predict myopia based on bio-
metric data, environmental factors, and genetic data.
These models are increasingly being utilized to alert
healthcare providers and parents for early signs of
myopia, enabling timely intervention.
Challenges in Implementation: Despite their po-
tential, the deployment of AI/ML/NLP in myopia di-
agnosis is not without challenges. Issues such as
data privacy, the need for large and diverse datasets
for model training, and the integration of these tech-
nologies into existing healthcare infrastructures are
ongoing concerns. Moreover, ensuring these ad-
vanced tools are accessible across various socio-
economic backgrounds remains a hurdle to achieving
widespread benefit.
1.2 Selected Initiatives
United States. In response to the myopia surge
among children, the United States has launched AI-
powered initiatives that intertwine research with prac-
tical applications. The National Eye Institute (NEI)
has catalyzed this movement by funding research into
AI models capable of predicting myopia progression,
with recent studies demonstrating a 30% improve-
ment in early detection accuracy. School-based pro-
grams have seen an infusion of AI, particularly dur-
ing the COVID-19 pandemic, where increased screen
time has been linked to a marked rise in myopia cases
(Kuehn, 2021; Ma et al., 2022). These programs
benefit from collaborations such as the one between
the American Ophthalmological Society and tech gi-
ants, aiming to create standardized screening proto-
cols across various states.
China, Singapore, Japan, and South Korea. The
Far Eastern countries have established a collabora-
tive network, the East Asian Ophthalmology Alliance
(EAOA), to facilitate the exchange of AI research and
technologies. Groundbreaking studies, like China’s
AI-based analysis of retinal images, have reported an
80% accuracy in predicting myopia, showcasing the
power of collaborative data sharing and algorithm de-
velopment. For example the (Foo et al., 2023). Sin-
gapore’s national program, integrating genetic data,
has seen a 20% increase in predictive precision post-
COVID-19, addressing the lifestyle changes that have
potentially accelerated myopia rates in children. This
collective effort underscores the potential for an inter-
national standard in myopia risk assessment.
Europe. Europe’s integration of AI in myopia de-
tection is evolving, with the European Vision In-
stitute leading multi-country studies that emphasize
early biomarker identification. Despite challenges
with data fragmentation, recent EU directives have
sought to unify health data standards, promoting re-
search like the Pan-European Myopia Study (PEMS),
which reported a 15% increase in myopia detection
since the pandemic began. The GDPR (General Data
Protection Regulation), while stringent, is adapting to
foster secure data sharing for AI applications, with
the recent establishment of the European Health Data
Space aiming to facilitate this shift.
1.3 Machine Learning Models
Trustworthiness as an Imperative in
Healthcare Applications
Trustworthiness in machine learning models tran-
scends a mere desirable quality, becoming imperative
in sensitive applications like healthcare. Users, partic-
ularly medical professionals, must be confident in the
models’ predictive capabilities to make crucial clin-
ical decisions. Trustworthiness is a composite mea-
sure, including but not limited to, effectiveness, ro-
bustness, fairness, interpretability, reliability, trans-
Predicting Children’s Myopia Risk: A Monte Carlo Approach to Compare the Performance of Machine Learning Models
1093

parency, security, replicability, scalability, and com-
pliance with regulatory, environmental, and social
standards. In medical contexts, effectiveness equates
to predictive accuracy and clinical relevance, while
robustness reflects the model’s consistency across
diverse patient demographics and datasets. These
are the bedrock of operational reliability for clinical
AI/ML applications. Under this directive, the ML
models should aim to eliminate bias, ensuring equi-
table health outcomes. We implemented privacy safe-
guards, including advanced encryption and data man-
agement protocols, aligning with the HIPAA (Health
Insurance Portability and Accountability Act) stan-
dards. This comprehensive approach to trustworthi-
ness, grounded in the highest government guidelines,
aims to redefine the application of AI in healthcare,
ensuring machine learning models fulfill public ser-
vice while adhering to safety and ethical norms. Rec-
ognized authorities such as the American Medical In-
formatics Association AMIA and Institute of Elec-
trical and Electronics Engineers (IEEE) have long
stressed the significance of trustworthiness in clini-
cal AI/ML implementations. The FDA is delineating
regulations for AI in diagnostics, emphasizing the im-
portance of model validation and continuous monitor-
ing. The NIH promotes open science for model repli-
cability and independent verification, highlighting the
necessity for transparency and security in protecting
patient data and preventing system misuse.
2 METHODOLOGY
2.1 MRC Approach to Trustworthiness
of Machine Learning Models
The Myopia Risk Calculator Consortium (MRC) rec-
ognizes the complex imperative of trustworthiness in
machine learning models, especially within the deli-
cate context of pediatric ophthalmology. Our system-
atic, phased approach harnesses the collective exper-
tise of international ophthalmology experts, ensuring
that the project embodies a truly interdisciplinary col-
laboration. Data scientists, clinicians, and ophthal-
mologists contribute uniquely, combining clinical in-
sights with advanced computational methods to shape
our methodology. The main assessment ML model
methods proposed in the MRC methodology are the
following:
2.1.1 Applications of Monte Carlo Methods
Our use of Monte Carlo (Robert and Casella, 2013)
simulations extends beyond data augmentation; it en-
compasses the creation of synthetic datasets that mir-
ror complex real-world variations, thus supporting ro-
bust model training and validation. The application
of Monte Carlo Cross-Validation (MCCV) and boot-
strapping techniques (Kohavi, 1995) underpins our
models’ reliability, providing transparent and statis-
tically significant measures of performance.
2.1.2 Confidence Interval Evaluation
Performance evaluation of our models transcends
point estimates, with confidence intervals drawn from
MCCV-derived statistics, ensuring a replicable and
trustworthy assessment of model reliability. It is
worth to emphasize that:
• The application of Monte Carlo methods coupled
with confidence interval evaluations spearheaded
by MRC sets a proposal of new standards in the
evaluation of ML models’ effectiveness and ro-
bustness for medical applications, championing
their reliability and transparency.
• The techniques based on MCCV showcased
herein have affirmatively passed the initial litmus
test in the ongoing pursuit of a comprehensive
trustworthiness assessment framework for medi-
cal ML applications.
As we have navigated the initial phase, our tra-
ditional ML models, applied to alphanumeric data,
have been meticulously crafted to predict myopia risk
in children. This groundwork paves the way for in-
corporating more intricate data types, such as image
data, and sophisticated methods. In particular, the
WisTech approach to Interactive Granular Computing
(IGrC) (Jankowski, 2017; Polkowski and Artiemjew,
2015; Lin et al., 2023) will be explored for its poten-
tial to dissect and utilize causal relationships, enhanc-
ing our model’s predictive precision through nuanced
‘what-if’ scenario analyses. In the critical domain of
data privacy, the consortium adheres to stringent pro-
tocols aligned with global standards such as GDPR
and HIPAA, ensuring that our synthetic data genera-
tion process upholds the utmost patient confidentiality
and security. Our methodology’s integrity is under-
pinned by an ethical framework that guides synthetic
data application, with oversight from an institutional
review board dedicated to maintaining medical ethics
at the forefront of our efforts. While the current fo-
cus is on effectiveness and robustness, we are laying
a comprehensive foundation for a multi-dimensional
trustworthiness framework. This framework, adapt-
able across the trust spectrum, is crafted to meet the
apex of medical practice standards. Anticipating fu-
ture clinical validation trials, we are preparing for the
critical phase of practical application, aiming to inte-
ICAART 2024 - 16th International Conference on Agents and Artificial Intelligence
1094

grate our models seamlessly into the medical commu-
nity for the benefit of pediatric patient care.
3 EXPERIMENTAL PART
3.1 Performance of the MRC (Version
1.0)
Data and Variables. Data for 3989 children (7945
eyes) were used for the analysis of this study. Chil-
dren from the Shahroud Schoolchildren Eye Cohort
Study were included in this study. It is a prospec-
tive cohort study, conducted in Shahroud, northeast
Iran, that recruited 5620 children aged 6 to 12 in 2015
(baseline), with a follow-up in 2018 (Emamian et al.,
2019). Cycloplegic refractions were conducted to de-
tect myopia at baseline and its progression after three
years. A questionnaire was administered to collect
data such as age, gender, near work time, outdoor
time, living place, parental myopia, and mother’s ed-
ucation. Ocular biometrics were measured using the
Allegro Biograph. These are crucial risk factors to
understand and predict myopia.
In our study, we categorized variables for ML
models into four attribute classes:
1. Effortless Attributes: These are attributes that
can be calculated without advanced medical
knowledge or medical instruments. Intuitively,
the values of these attributes should be readily
available.
2. Advanced Attributes: These are attributes that
are not considered effortless, requiring more spe-
cialized knowledge or equipment.
3. Non-Cycloplegic Attributes: These are at-
tributes that do not require cycloplegic refraction.
4. Cycloplegic Attributes: These attributes require
cycloplegic refraction, indicating that they relate
to an eye examination procedure where the eye’s
ciliary muscle is temporarily paralyzed to deter-
mine refractive error.
Dependent Variables and Decision Classes. The
main outcome variable of this study was the three-
year spherical equivalent (SE2). The value of SE2 is
equal to the final SE (after 3 years). Machine learning
techniques were employed to create binary classifiers
for myopia risk prediction and regression models for
SE2 prediction. We focus on the following decision
classes for binary classifiers:
• M01: The SE2 value will be ≤ -0.5 D.
• M02: The SE2 value will be ≤ -4.0 D.
• M05: The SE2 value will be ≤ -1.0 D.
In these variants, the values -0.5, -1 and -4 are the
thresholds for creating a binary decision. In this way,
binary decision systems are formed to model the dis-
ease prediction process.
For the regression models, we use SE2 as the de-
pendent variable. In the considered cases, the vari-
able SE2 depends on the independent variables de-
rived from the initial examination (baseline).
Model Evaluation Methodology. We used an ag-
gregation of Monte Carlo cross-validation and boot-
strap methods for assessing models’ effectiveness and
robustness. We calculated bootstrap confidence in-
tervals for the following standard statistics: classifier
quality measures such as Sensitivity, Specificity, Pre-
cision, F1, Gm, AUC (Tharwat, 2021), and weighted
averages and regression quality measures like MSA,
MAE, and R
2
(Hastie et al., 2009).
Let us denote by S one of the above statistics. In
our project, we use the following calculation method-
ology for the value of the statistic S measuring the
model performance (e.g., Sensitivity, Specificity, Pre-
cision, AUC, F1, Gm, MSA, MAE, and R
2
(Hastie
et al., 2009), etc.):
1. Generate 20 Monte Carlo-simulated cross-
validations using 10 folds for model evaluation.
In other words, we obtain 200 evaluation folds
for model evaluation (i.e., ten times twenty). This
leads to 200 values of the statistic S measuring
the model performance (i.e., for any evaluation
model from 200).
2. As a result of the above first step, we have 200
values of S. If it is necessary, then you may use
more iterations for Monte Carlo-generated cross-
validations and employ Markov Chain Monte
Carlo (MCMC) methods for better approximat-
ing the empirical distribution of S (Robert and
Casella, 2000).
3. Calculate the percentiles (Eubank, 2006) for the
generated empirical distribution for S.
4. For each percentile p, report the Qp(S) value
(e.g., Q02(Sensitivity)). For example, if S is the
measure of AUC (i.e., Area Under the Curve),
then Q25(AUC) is the first quartile of AUC,
Q50(AUC) is the median, and Q75(AUC) is the
third quartile.
5. Primarily, focus on Q05(S), Q50(S), and Q95(S).
6. Apply percentiles from the empirical distribution
to determine confidence intervals for the statistic
S for the required significance level.
Predicting Children’s Myopia Risk: A Monte Carlo Approach to Compare the Performance of Machine Learning Models
1095
The quality of classifiers planned for deployment
in a specific world region should reflect the level of
medical care in a particular area. Generally, the most
important feature is always the sensitivity, which is as
high as possible on an acceptable level of precision
(and sometimes other parameters). Conditions may
be imposed on Precision based on physician availabil-
ity. For example, we may prefer classifiers with very
high Precision if doctors are unavailable. After the
discussion, we concluded that the primary assessment
of the classifiers should be using a weighted aver-
age, which we will symbolically denote as SimWAvr,
preferably according to the formula below.
SimWAvr =
1
2
Q05(Sensitivity)+
1
4
Q05(Speci f icity)
+
1
4
Q05(Precision).
(1)
Below, we present the classification results of
classifiers sorted by SimWAvr values.
Results. The effectiveness of traditional ML meth-
ods, such as Logistic Regression (LR), k-Nearest
Neighbor (kNN), Support Vector Machines (SVM),
Random Forest (RF), Gradient Boosting (GB), and
Artificial Neural Network (ANN), was verified. In ad-
dition, the models were constructed as an aggregation
of traditional models, i.e., ensemble models.
The best results for the binary classifiers of the
defined decision classes M01, M02, and M05 are as
follows.
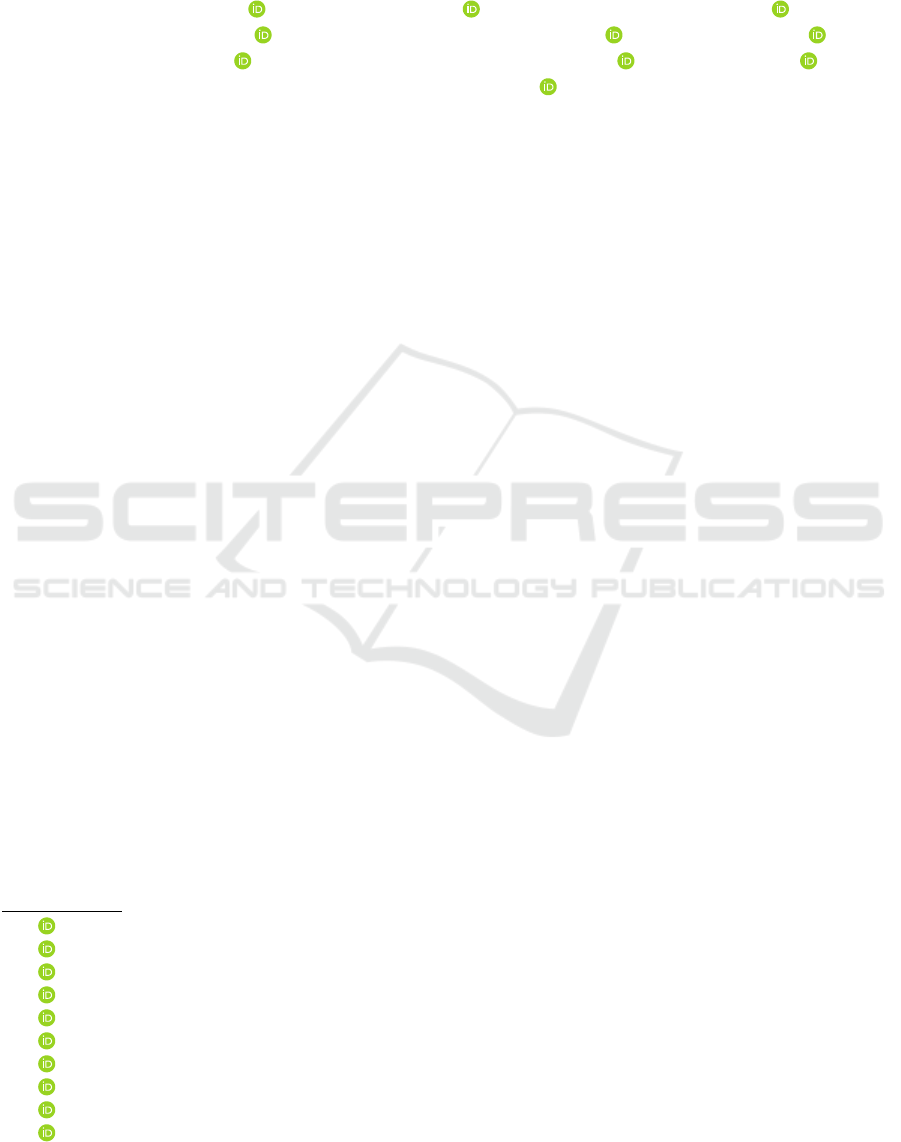
Table 1: Selected best results - a classification problem.
Using Cycloplegic Attributes; BestMet = Best ML model
method, RF = Random Forest, SVM = Support Vector Ma-
chine, LR+RF=Ensemble model of Lasso Regression and
Random Forest. See visualisation in Fig. 1.
Statistic M01 M02 M05
BestMet RF SVM LR+RF
SimWAvr 73% 64% 74%
Q05 (AUC) 86% 86% 87%
Q50 (AUC) 90% 94% 92%
Q05 (Sens) 79% 72% 79%
Q50 (Sens) 87% 91% 89%
Q05 (Spec) 91% 97% 94%
Q50 (Spec) 93% 98% 96%
Q05 (Prec) 44% 16% 44%
Q50 (Prec) 51% 22% 53%
In addition to binary classifiers, we have examined
regression models. We used SE2 as the dependent
variable for regression models in this case. The vari-
able SE2 depends on the independent variables de-
Figure 1: Visualisation of the results for Table 1: Using Cy-
cloplegic Attributes; BestMet = Best ML model method,
RF = Random Forest, SVM = Support Vector Machine,
LR+RF=Ensemble model of Lasso Regression and Random
Forest.
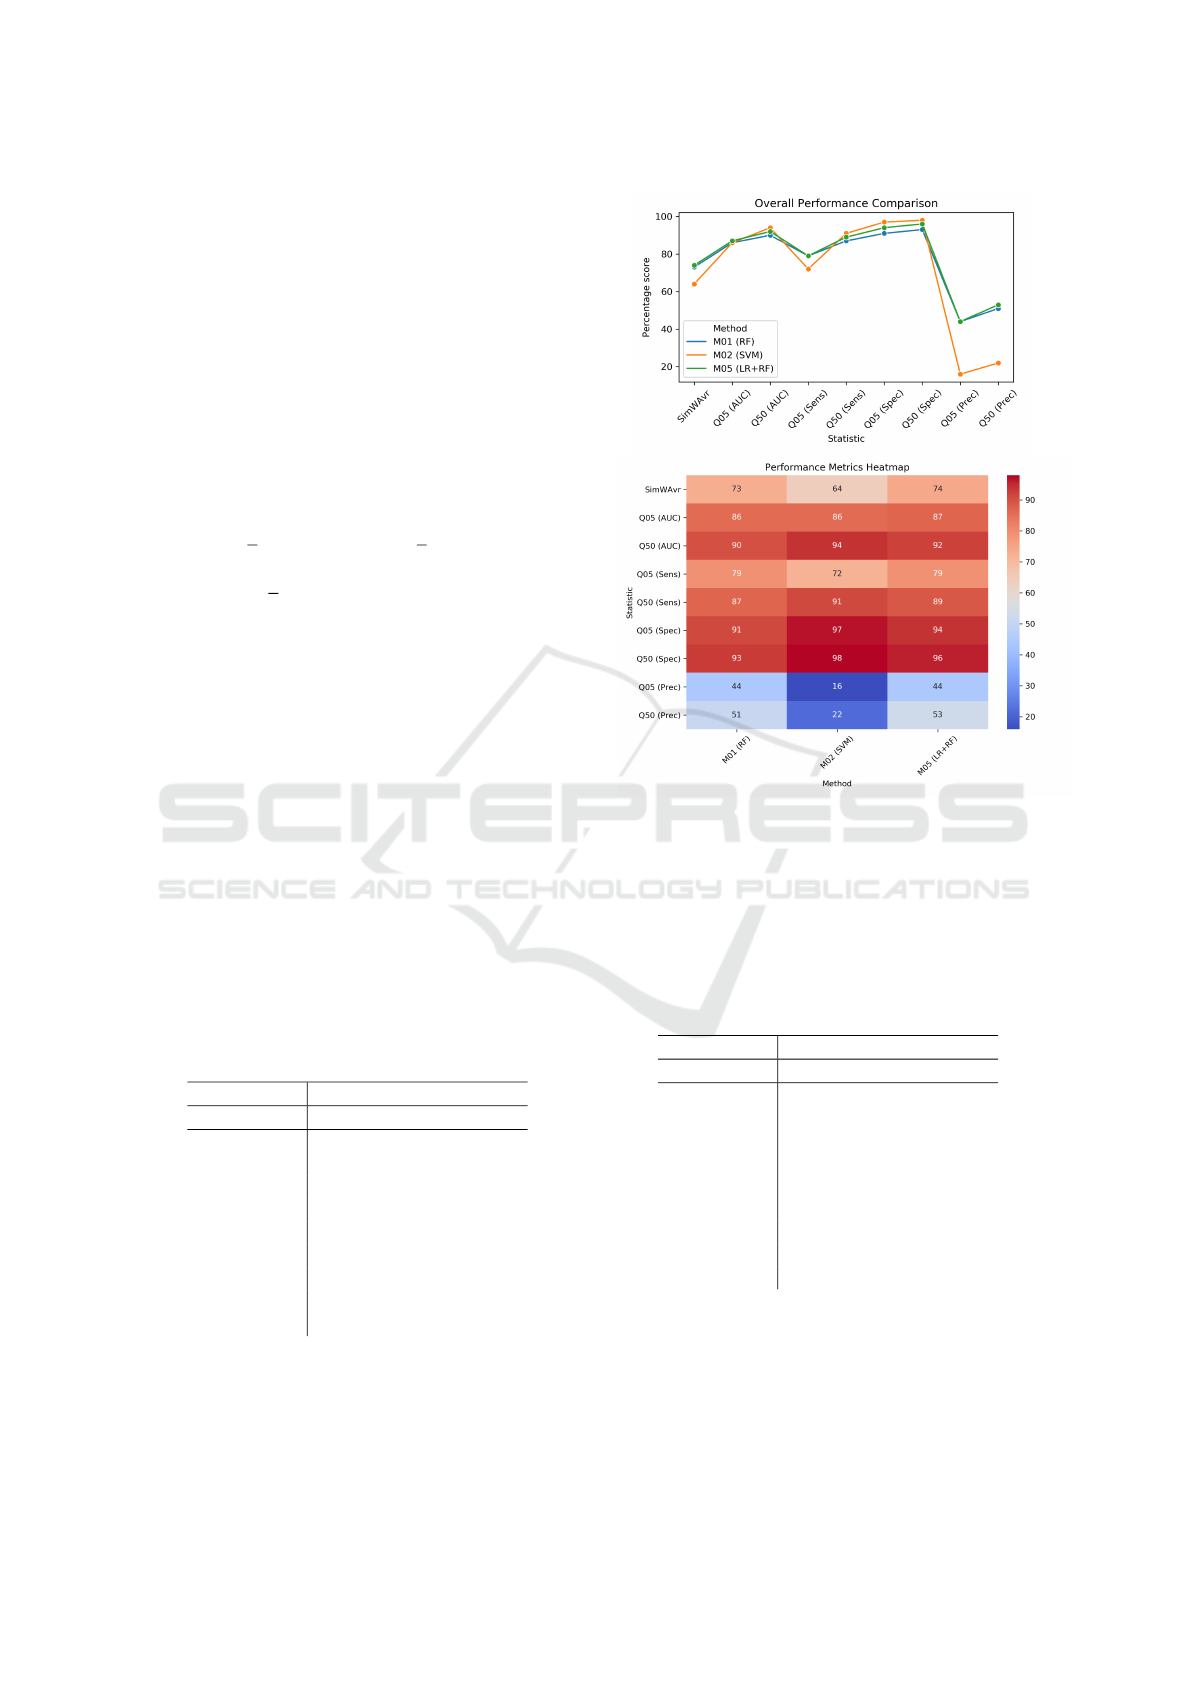
Table 2: Selected best results - a classification problem.
Using Non-Cycloplegic Attributes; BestMet = Best ML
model method, LR+RF=Ensemble model of Lasso Regres-
sion and Random Forest, SVM = Support Vector Machine,
RF = Random Forest. See visualisation in Fig. 2.
Statistic M01 M02 M05
BestMet LR+RF SVM RF
SimWAvr 66% 72% 68%
Q05 (AUC) 80% 91% 85%
Q50 (AUC) 85% 99% 90%
Q05 (Sens) 71% 84% 81%
Q50 (Sens) 82% 99% 90%
Q05 (Spec) 87% 98% 86%
Q50 (Spec) 89% 99% 88%
Q05 (Prec) 33% 20% 24%
Q50 (Prec) 38% 28% 29%
rived from the initial examination. Analogously to
binary classifiers, we analysed two types of models:
1. Type 1: Using cycloplegic independent variables.
2. Type 2: Using only non-cycloplegic independent
variables.
ICAART 2024 - 16th International Conference on Agents and Artificial Intelligence
1096
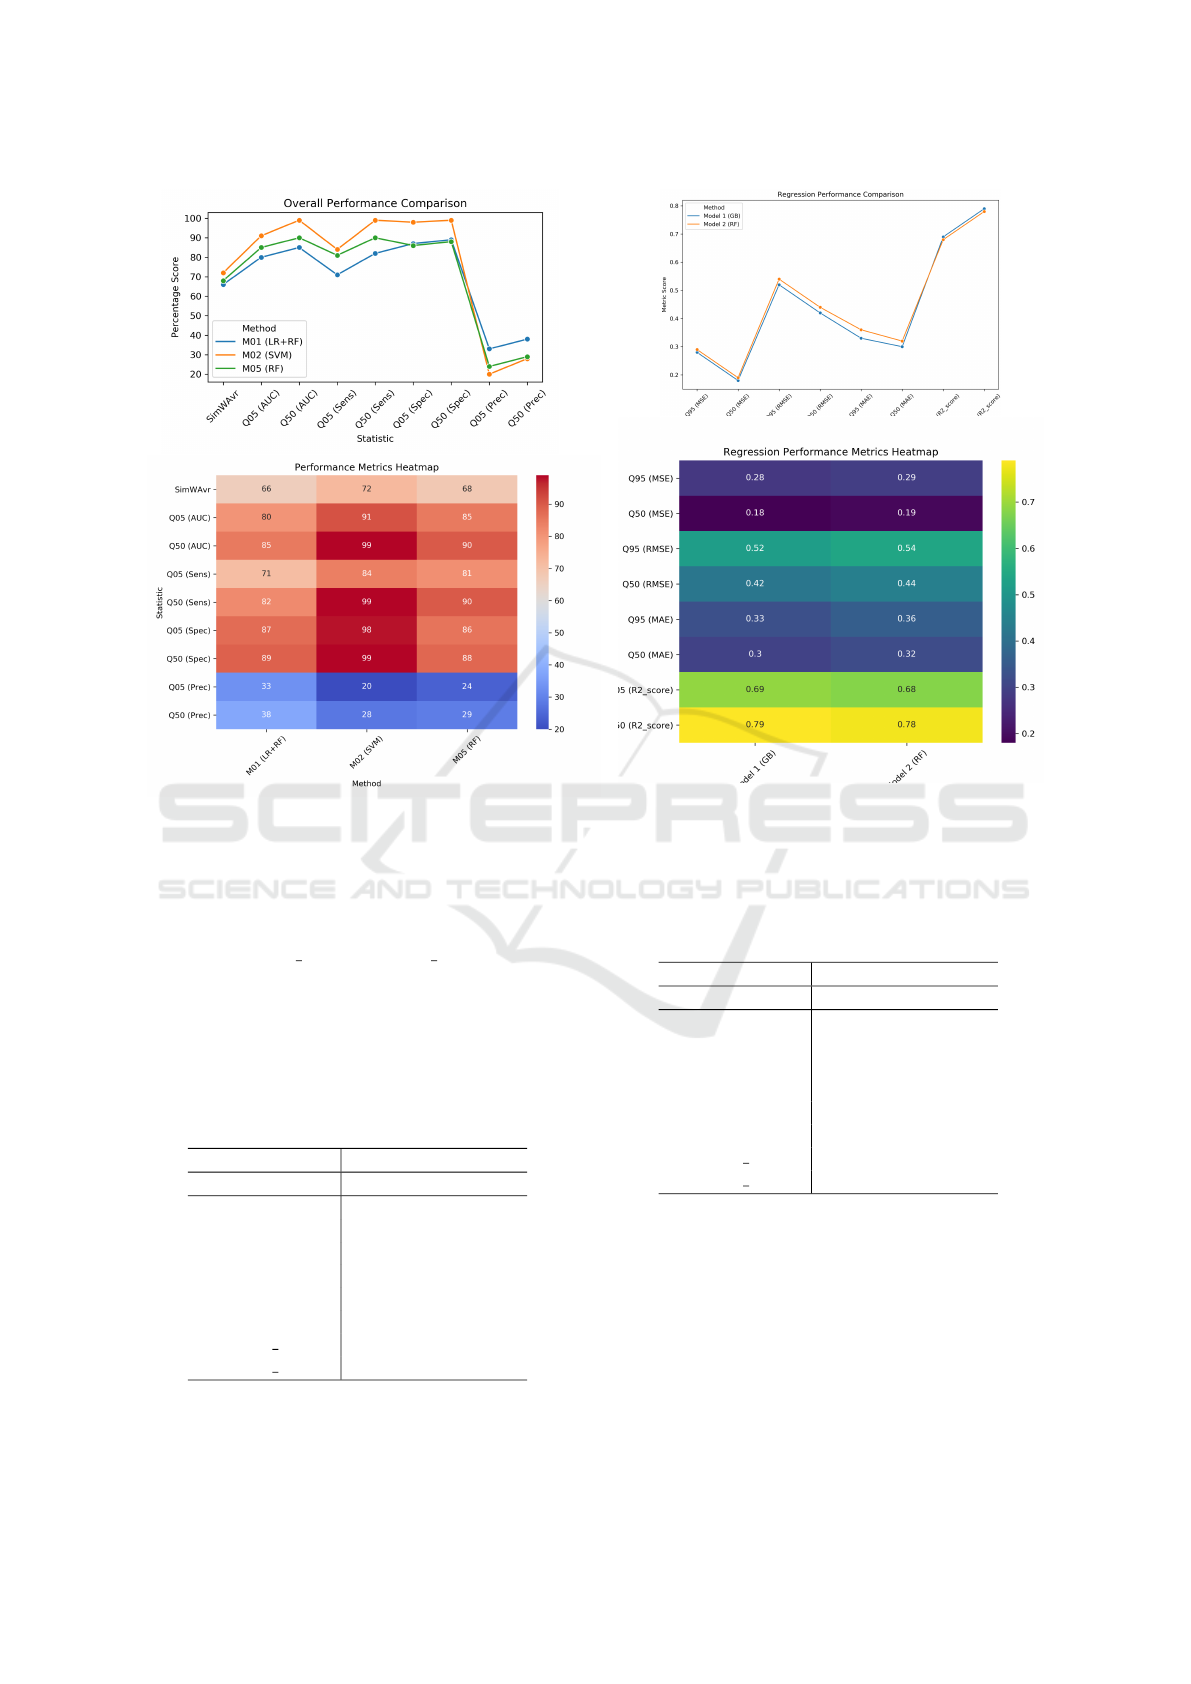
Figure 2: Visualisation of the results for Table 2: Using
Non-Cycloplegic Attributes; BestMet = Best ML model
method, LR+RF=Ensemble model of Lasso Regression and
Random Forest, SVM = Support Vector Machine, RF =
Random Forest.
We used typical regression model performance in-
dicators: Q05(R2 score), Q50(R2 score) and mea-
sured diopters: Q95(MSE), Q50(MSE), Q95(RMSE),
Q50(RMSE), Q95(MAE) and Q50(MAE). The most
interesting results are present in the following tables:
Table 3: Selected best results - a regression problem. Cy-
cloplegic Attributes; BestMet = Best ML model method,
GB = Gradient boosting, RF = Random Forest. See visual-
isation in Fig. 3.
Statistic Model 1 Model 2
BestMet GB RF
Q95 (MSE) 0.28 0.29
Q50 (MSE) 0.18 0.19
Q95 (RMSE) 0.52 0.54
Q50 (RMSE) 0.42 0.44
Q95 (MAE) 0.33 0.36
Q50 (MAE) 0.30 0.32
Q05 (R2 score) 0.69 0.68
Q50 (R2 score) 0.79 0.78
Figure 3: Visualisation of the results for Table 3: Cyclo-
plegic Attributes; BestMet = Best ML model method, GB
= Gradient Boosting, RF = Random Forest.
Table 4: Selected best results - a regression problem.
Non-Cycloplegic Attributes; BestMet = Best ML model
method, GB = Gradient Boosting, ANN = Artificial Neural
Network. See visualisation in Fig. 4.
Statistic Model 1 Model 2
BestMet GB ANN
Q95 (MSE) 0.50 0.63
Q50 (MSE) 0.40 0.48
Q95 (RMSE) 0.71 0.79
Q50 (RMSE) 0.63 0.69
Q95 (MAE) 0.53 0.59
Q50 (MAE) 0.46 0.52
Q05 (R2 score) 0.39 0.29
Q50 (R2 score) 0.53 0.45
4 CONCLUSIONS
This study represents a key advancement in us-
ing machine learning to predict the risk of myopia
among children. The Myopia Risk Calculator (MRC)
Consortium has successfully fused classical machine
learning methodologies with cutting-edge AI innova-
tions, forging a trailblazing path in ophthalmic health
Predicting Children’s Myopia Risk: A Monte Carlo Approach to Compare the Performance of Machine Learning Models
1097
Figure 4: Visualisation of the results for Table 4: Non-
Cycloplegic Attributes; BestMet = Best ML model
method, GB = Gradient Boosting, ANN = Artificial Neu-
ral Network.
solutions.
Key Findings:
• Validation of traditional ML methods for creat-
ing classifiers and regression models has been
achieved, with promising outcomes within the Ira-
nian pediatric cohort, hinting at the potential for
cross-population applicability subject to further
empirical investigation.
• The application of Monte Carlo methods coupled
with confidence interval evaluations spearheaded
by MRC sets a proposal of new standards in the
evaluation of ML models’ effectiveness and ro-
bustness for medical applications, championing
their reliability and transparency.
• The techniques based on MCCV showcased
herein have affirmatively passed the initial litmus
test in the ongoing pursuit of a comprehensive
trustworthiness assessment framework for medi-
cal ML applications.
Now lets present our future plans and final thoughts.
The MRC Consortium is strategically expanding its
investigative purview to include transfer learning
methodologies, seeking to augment the precision and
adaptability of our models to a variety of population
datasets, which will entail the generation of special-
ized synthetic data. Exploring image data, the consor-
tium anticipates unlocking advanced diagnostic po-
tential, thereby enhancing the utility of the models.
With a nod to the future, the application of the Wis-
Tech methodology for Interactive Granular Comput-
ing (IGrC) is anticipated to unravel the complexities
of causation, offering refined ’what-if’ analytical sce-
narios that could revolutionize predictive accuracy.
The MRC is at the vanguard of an evolving healthcare
paradigm wherein AI and ML transcend their roles as
mere computational tools to become integral allies in
the delivery of advanced medical care. Central to this
paradigm is the trustworthiness of ML models, a criti-
cal component that our research addresses with a pio-
neering assessment methodology. As we stand on the
brink of a transformative era in medical technology,
the consortium is propelling this movement with un-
wavering commitment and a vision for a future where
healthcare is both innovative and reliable.
ACKNOWLEDGEMENTS
Shahroud School Children Eye Cohort Study is
funded by the Noor Ophthalmology Research Cen-
ter and Shahroud University of Medical Sciences.
(Grant numbers: 9329, 960351). The experiments
were carried out, among others, by UWM MSc
students Mateusz
´
Sliwi
´
nski, Andrzej Strzeszewski,
Adam Jankowiak, Michał Domian, Paweł Budzi
´
nski,
Bartosz
´
Cwiek, Jakub Przyborowski, Jakub Kasja-
niuk.
REFERENCES
Emamian, M. H., Hashemi, H., Khabazkhoob, M., Malihi,
S., and Fotouhi, A. (2019). Cohort profile: Shahroud
schoolchildren eye cohort study (SSCECS). Interna-
tional Journal of Epidemiology, 48(1):27–27f.
Eubank, R. L. (2006). Quantile. John Wiley & Sons, Ltd.
Foo, L. L., Lim, G. Y. S., Lanca, C., Wong, C. W., Hoang,
Q. V., Zhang, X. J., Yam, J. C., Schmetterer, L., Chia,
A., Wong, T. Y., Ting, D. S. W., Saw, S.-M., and Ang,
M. (2023). Deep learning system to predict the 5-year
risk of high myopia using fundus imaging in children.
npj Digital Medicine, 6(10).
Haarman, A. E. G., Enthoven, C. A., Tideman, J. W. L.,
Tedja, M. S., Verhoeven, V. J. M., and Klaver, C. C. W.
(2020). The Complications of Myopia: A Review and
Meta-Analysis. Investigative Ophthalmology & Visual
Science, 61(4):49–49.
Hastie, T., Tibshirani, R., and Friedman, J. (2009). The Ele-
ments of Statistical Learning: Data Mining, Inference,
and Prediction. Springer Series in Statistics. Springer
New York, NY, 2 edition.
Huang, H.-M., Chang, D. S.-T., and Wu, P.-C. (2015). The
association between near work activities and myopia
ICAART 2024 - 16th International Conference on Agents and Artificial Intelligence
1098

in children—a systematic review and meta-analysis.
PLOS ONE, 10(10):1–15.
Jankowski, A. (2017). Interactive Granular Computations
in Networks and Systems Engineering: A Practical
Perspective. Lecture Notes in Networks and Systems.
Springer Cham, 1 edition. eBook Packages Engineer-
ing, Engineering (R0).
Kohavi, R. (1995). A study of cross-validation and boot-
strap for accuracy estimation and model selection. In
IJCAI, volume 14, pages 1137–1145.
Kuehn, B. M. (2021). Increase in Myopia Reported Among
Children During COVID-19 Lockdown. JAMA,
326(11):999–999.
Lin, T.-Y., Liau, C.-J., and Kacprzyk, J., editors (2023).
Granular, Fuzzy, and Soft Computing. Encyclopedia
of Complexity and Systems Science Series. Springer
New York, NY, New York, NY, 1 edition.
Ma, D., Wei, S., Li, S., Yang, X., Cao, K., Hu, J., Peng, X.,
Yan, R., Fu, J., Grzybowski, A., Jin, Z., and Wang,
N. (2022). The impact of study-at-home during the
covid-19 pandemic on myopia progression in chinese
children. Frontiers in Public Health, 9:720514.
Morgan, I., French, A., Ashby, R., Guo, X., Ding, X., He,
M., and Rose, K. (2018). The epidemics of myopia:
Aetiology and prevention. Progress in Retinal and Eye
Research, 62.
Morgan, I. G., Ohno-Matsui, K., and Saw, S.-M. (2012).
Myopia. The Lancet, 379(9827):1739–1748.
Polkowski, L. and Artiemjew, P. (2015). Granular Com-
puting in Decision Approximation - An Application of
Rough Mereology.
P
¨
arssinen, O. and Kauppinen, M. (2022). Associations
of near work time, watching tv, outdoors time, and
parents’ myopia with myopia among school children
based on 38-year-old historical data. Acta Ophthal-
mologica, 100(2):e430–e438.
Robert, C. and Casella, G. (2000). Monte carlo statistical
method. Technometrics, 42.
Robert, C. P. and Casella, G. (2013). Monte Carlo Statisti-
cal Methods. Springer.
Tharwat, A. (2021). Classification assessment methods. Ap-
plied Computing and Informatics, 17(1):168–192.
World Health Organization (2015). The impact of my-
opia and high myopia. Report, University of New
South Wales, Sydney, Australia. Report of the Joint
World Health Organization–Brien Holden Vision In-
stitute Global Scientific Meeting on Myopia.
Predicting Children’s Myopia Risk: A Monte Carlo Approach to Compare the Performance of Machine Learning Models
1099
