
Observational Study of a Digital Application
to Detect Attachment in Dyads Using Markov Chains
Sebastian Unger and Thomas Ostermann
Department of Psychology and Psychotherapy, Witten/Herdecke University, Witten, Germany
Keywords: Interpersonal Attachment, Digital Application, Observation, Mental Processes, Mental Health Care, Time
Series Analysis.
Abstract: Attachment is a widely used term and basically refers to a strong emotional relationship that one person
develops with another. It is often measured, for example, with the Adult Attachment Interview (AAI), one of
the most popular tools, or the Child Attachment Interview (CAI), an adaption of the former. Even though
these are two excellent tools for measuring attachment, they are labor-intensive and therefore not suitable for
quick use without an adequate training period. Moreover, the mindset towards attachment has changed over
time since the development of these tools, meaning that they can still be applied, but only in specific contexts.
The digital application "IU" is intended to address these two issues by being easy to learn on the one hand
and leaving plenty of freedom for measurement on the other. In this observational study, the interpersonal
attachment of dyads captured by the app is interpreted as three-dimensional time series and analyzed based
on a Markov chains. This approach shows how interpersonal attachment might be determined according to
the homogeneity of the Markov chains, which could probably be improved by capturing other factors such as
the interactions of dyads.
1 INTRODUCTION
In the field of psychology, attachment is a widely
used term that first entered the healthcare system in
the 1950s (Evans, 2004). In its origins, attachment
refers to the strong emotional relationship that an
infant or child develops with a caregiver (Bretherton,
1992). Back then, caregivers were mainly associated
with mothers, so that research also focused on
attachment between mothers and their children. One
of the most popular methods developed through this
mindset is the Adult Attachment Interview (AAI), a
tool for classifying attachment patterns of adults
based on childhood experiences with parents and the
influence of these experiences on personality
development (Main et al., 2008). Another tool is the
Child Attachment Interview (CAI), an adaptation of
the AAI for children (Target et al., 2003). Both AAI
and CAI provide reliable results, as evidenced in
multiple studies (Hesse, 1999; Privizzini, 2017; van
Ijzendoorn et al., 2008). This is why these tools are
very attractive and hard to replace. However, due to
their structural similarity, they have one major
drawback in common: they produce a high workload.
Nowadays, the mindset towards attachment has
considerably changed. One of the main claims is that
attachment is not only related to the child's behavior
but also to the socio-emotional contexts of adulthood
(Fearon et al., 2017). This can be seen in the various
literature in which attachment is addressed, including
studies on social relationships formation (Insel,
1997), on love couples (Brumbaugh et al., 2006), or
even on patient care (Agrawal et al., 2004; Blanco et
al., 2018). Because of this and because of the major
drawback of the AAI and CAI, new and innovative
measurement methods were developed or at least
investigated. The Adult Attachment Projective
(AAP), which uses attachment-related drawings
(George et al., 2004), is one of the few art-based
approaches. Other approaches that focus on
movement patterns are hardly seen in research. A few
examples on this topic are those that combine
conventional attachment methods with the
movements of the eyes, the facial expressions, or the
people themselves (Altmann et al., 2021;
Kammermeier et al., 2020; Uccula et al., 2022).
The approach in this article represents both an art-
based and a movement-based measurement method.
The measurement is performed on a tablet and has
Unger, S. and Ostermann, T.
Observational Study of a Digital Application to Detect Attachment in Dyads Using Markov Chains.
DOI: 10.5220/0012435200003657
Paper published under CC license (CC BY-NC-ND 4.0)
In Proceedings of the 17th International Joint Conference on Biomedical Engineering Systems and Technologies (BIOSTEC 2024) - Volume 2, pages 185-193
ISBN: 978-989-758-688-0; ISSN: 2184-4305
Proceedings Copyright © 2024 by SCITEPRESS – Science and Technology Publications, Lda.
185
already shown its potential using two-dimensional
time series (Unger et al., 2020). In contrast to the
approach from the previous proof of concept study, a
further meaningful dimension supplements here the
measurement of interpersonal attachment.
The assumption is that the addition of this third
dimension may increase the accuracy of the method,
leading to the research question: “Can interpersonal
attachment of a dyad be captured as three-
dimensional time series with a digital application?”.
To test the question exploratively, the time series are
checked for practical applicability using a Markov
chain approach. It has not yet been examined in this
context, but Markov models are increasingly being
used in clinical psychological research. In addition to
the individual case study by Elbing et al. (2022),
corresponding approaches, e.g., the analysis of
emotions of outpatients with schizophrenia (Strauss
et al. 2019; Strauss et al. 2023), the development of a
clinical decision support system for bipolar disorders
(Valenza et al., 2013), the modelling of emotional
brain states (such as “surprise”, “fear” or “anger”)
among university students (Kragel et al., 2022), or the
investigation of computer-based social interactions
with virtual objects (Dolev et al., 2020; Prasetio et al.,
2020), indicate promising results.
2 METHODS
2.1 Participants
Participants were recruited via the internal bulletin
board, social media, and verbal communication.
Eligible participants were between 18-65 years old,
were able to operate a tablet independently, had no
acute disorders that could interfere with the use of a
tablet, and were not pregnant due to unknown effects
on stress levels. In addition, an informed consent
form had to be signed by all participants before the
examination could start.
With this inclusion criteria, a total of 60 people
(43 females and 17 males) were motivated to
voluntarily participate, a lot of whom registered
directly with a familiar partner. The age of the
participants ranged between 19 and 37 years
(x
̅
age
= 23.78 years).
2.2 Examination Set-up
In a first step, the participants were organized into
dyads, as the examination could only be conducted in
a dyadic constellation. Participants registered with a
partner were automatically assigned to each other.
Otherwise, they were randomly assigned to a partner.
After 30 dyads were formed, the dyads were asked to
arrive in a specially prepared laboratory room. The
equipment included a table on which two tablets as
well as two styli were positioned and two chairs for
the participants to sit on. On site, there was also a
person in charge who informed the participants about
the procedure, checked their suitability, and had them
sign the informed consent form.
Next, the participants had to place themselves
opposite their partner. Once they were seated, the
person in charge handed each of them one of the two
tablets, which were already running an app called
“IU”. Participants were now asked to enter an
assigned identification number (ID) as well was their
age and gender in the text fields provided by the app.
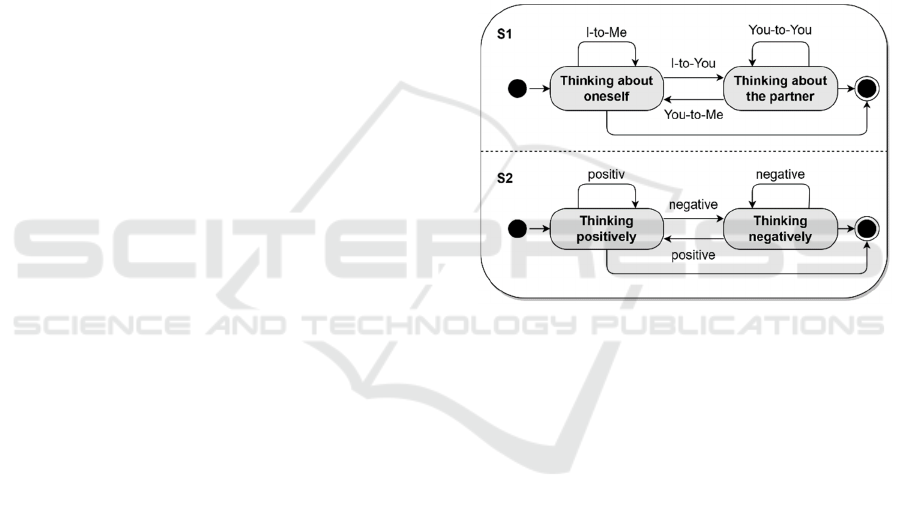
Figure 1: State diagram of the participants’ measurable
thoughts, showing the two first level states and the two
second level states.
In the last step, the person in charge handed the
participants a pen for digital drawing (stylus). The
task for the participants was to seek eye contact for
three minutes, while transferring their thoughts to the
tablet with the stylus. The thoughts that are attempted
to be captured are mapped on the basis of four mental
states, consisting of two first level states and two
second level states, as show in Figure 1. The two first
level states express if the participants are thinking
about themselves or about their partner, who is sitting
opposite to them. Therefore, the former state is called
“I”-state, named after the personal pronoun “I”,
whereas the latter state is called “U”-state, named
after the sound of the personal pronoun “You”. Both
states can each reach one of the two second level
states to express if the thought has a positive or
negative orientation. On the tablet, the combinations
of the four states are displayed by dividing the bottom
(“I”-state) from the top (“U”-state) half of the screen
and by dividing the left (negative orientation) from
the right (positive orientation) side of the screen.
HEALTHINF 2024 - 17th International Conference on Health Informatics
186

From this it follows that participants who are thinking
about themselves move the stylus to the bottom half
and participants who are thinking about the partner
move the stylus to the top half. At the same time,
participants have to consider the positive or negative
orientation of their thought by moving the stylus
either to the left (negative) or right (positive) side.
The stylus is then meant to remain in the
corresponding location of the screen as long as the
thoughts do not change. If there is a change, the stylus
is moved accordingly, which is likely be expected
during this examination.
2.3 Output Measures
While the participants look at each other and transfer
their thoughts to the tablet by moving the stylus back
and forth for 3 minutes, a tracking process runs in the
background of the app. With this tracking, the pixel
coordinates touched by the stylus (x
i
, y
i
) and the time
of this touch (t
i
) are saved for each participant
j
k
(k = A, B) of the dyad j continuously, creating a
time series (x
i
, y
i
, t
i
)
jk
. Such three-dimensional time
series describes the course of the thoughts of a
participant, whereby the x-coordinate, the y-
coordinate, and the time each correspond to one
dimension. To enable the individual time points of a
time series to be assigned to the four mental states in
retrospect, the vertical and horizontal screen divisions
are additionally saved.
2.4 Statistical Analysis
The analysis of the thoughts is based on Markov
chains, which aim to provide transition probabilities
from a long and uninterrupted observation
(Billingsley, 1961), as this method has repeatedly
demonstrated its usefulness in medical contexts.
However, since the raw values of the corresponding
three-dimensional time series are not of interest, a
reconversion into mental states must be conducted in
advance. This can be done using the pixel coordinates
(x
i
, y
i
) contained in the time series (x
i
, y
i
, t
i
)
jk
. The
chronologically correct order of these states is
determined using the time dimension (t
i
).
According to the four mental states, the resulting
Markov chain also has four states. To assign this, the
horizontal screen division is considered first. If a y-
coordinate is above this screen division, it is
interpreted as “U”-state, and if the y-coordinate is on
or below the screen division, it is interpreted as “I”-
state. Afterwards, the vertical screen division is
considered. If the corresponding x-coordinate is to the
left of this screen division, the state is given a
negative orientation, and if the x-coordinate is on or
to the right of this screen division, the state is given a
positive orientation. This leads to the mental state
constellations: thinking positive about the other (+U),
thinking negative about the other (-U), thinking
positive about oneself (+I), and thinking negative
about oneself (-I).
After determining the Markov chains, the Markov
property is subsequently tested. For this, the R
package “markovchain” (Spedicato et al., 2016;
version 0.9.1) is used. The method is based on a Chi-
Square Test: if the corresponding p-value of the Chi-
Square Test is above the level of significance of
α = 0.05, the Markov property is satisfied. The
purpose of testing this property is to ensure that a
future state depends only on the current state and not
on any other past states (Asmussen, 2003), which is
the necessary condition for a Markov chain. The
Markov chains of a dyad j are furthermore tested
against homogeneity. If, on the one hand, the Markov
property is present and there is homogeneity between
them, it is assumed that the time series of a dyad are
similar. If, on the other hand, there is heterogeneity
despite the Markov property, it is assumed that the
time series are different. Since the optimal interval
length between the mental states is unknown, the
procedure is repeated for different intervals, a
technique based on a study in which heatmaps
through different grid sizes were created to examine
the movement entropy of people (Unger et al., 2021).
Starting with a 100 ms interval predefined by the app,
the interval is repeatedly increased by 100 ms until
the maximum of 10,000 ms is reached.
3 RESULTS
To begin with, the data was checked for completeness
and applicability to the planned statistical procedures.
It was noticed that the time series of two participants
had too large gaps to apply the different interval
lengths to the three-minute measurement time. The
data of these participants had to be removed. In
addition, the data of their associated partners were
removed, because the time series of this dyad cannot
be tested for homogeneity. For the analysis, 28 dyads
with the corresponding 56 time series remained.
Table 1 shows the dyadic constellations that have
been formed. In most Dyads, the participants were
friends or colleagues. Only a few couples and a few
dyads of strangers were formed. From Table 1, it can
also be taken that the mean time since the dyads have
known each other is neither particularly low, i.e., a
few days or weeks (except for the strangers), nor
Observational Study of a Digital Application to Detect Attachment in Dyads Using Markov Chains
187
particularly high, i.e., more than 5 years, which
provides a good and stable basis for the data.
Table 1: Amount of dyadic constellations with an indication
of their self-reported form of interpersonal attachment and
the mean time of knowing each other.
Interpersonal
Attachment Form
Amount of
D
y
ads
Known since
(in Years)
Colleagues 9
1 ¾
[¼, 3]
Love Couples 2
3 ¼
[1 ½, 5]
Friends 14
1 ¼
[¼, 3 ½]
Strangers 3
-
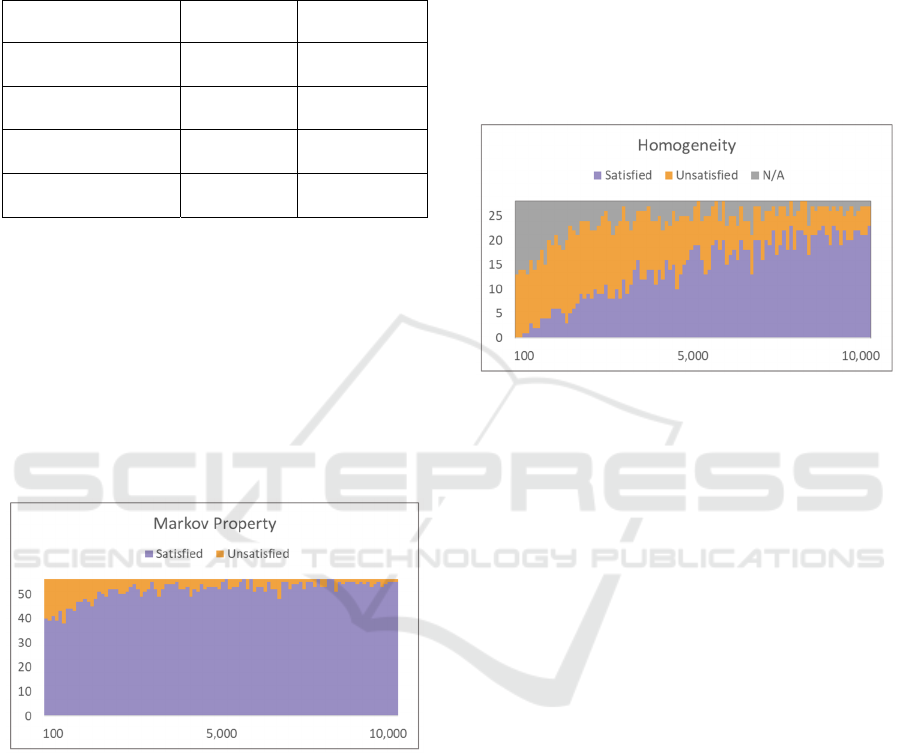
Looking at the results of the Markov property test,
it appears that most of the time series follow a Markov
chain. In Figure 2, the amount of time series that
satisfy the property is compared with the amount of
time series that do not satisfy the property. It is easy
to see that the Markov property increases with
increasing interval length. Nevertheless, even at the
smallest interval length of 100 ms, the proportion of
satisfied Markov properties (40 ≙ about 71 %) is
more than twice as high as the proportion of
unsatisfied Markov properties (16 ≙ about 29 %).
Figure 2: Overview of testing the time series with regard to
the Markov property. The amount is shown on the y-axis
and the interval (in ms) used for testing is shown on the x-
axis.
After the Markov property has been tested, the
homogeneity of the time series per dyad can be tested
next. However, the only dyads suitable for the test are
those in which both time series satisfy the Markov
property, as these time series can be interpreted as
Markov chains. Dyads can therefore have
homogeneous, heterogeneous, or not comparable
time series.
Figure 3 shows the results by comparing the
amount of the three cases. As expected from the
previous test, there are only a few dyads with
homogeneous time series when using the small
intervals. It must be noted that, unfortunately, the
time series that did not satisfy the Markov property
often belonged to different dyads, so that there are
many not comparable dyads, which could not be
tested in the first place. But as soon as the intervals
become larger and more time series satisfy the
Markov property, the time series of the dyads become
increasingly homogeneous. This can particularly be
seen around the maximum interval length.
Figure 3: Overview of testing the time series of dyads
against homogeneity. The amount is shown on the y-axis
and the interval (in ms) used for testing is shown on the x-
axis.
Figure 4 illustrates how both time series of a
randomly picked dyad change with increasing
interval lengths. The similarities that are consistently
revealed despite the change can be found in the
movements of both styli to mainly positive mental
states. In particular, the state of thinking positively
about the partner (+U) is predominant the greater the
interval becomes.
Starting with the preset default interval of 100 ms,
partner B shows noticeably more activity than partner
A. The states of the two corresponding time series
have a high probability of circling around themselves
and therefore a minimal probability of changing to
another state. The Markov property was not achieved
for either time series with this interval length, so that
homogeneity was not tested either, i.e., this dyad is
not comparable.
With 1,000 ms, partner B is still the more active
one, but the similarity that both think positively about
their partner (+U) becomes more visible. Now, the
probability of one state changing into another
increases slightly as the points in the time series
decrease. This time, the Markov property is satisfied
for both time series. However, homogeneity can still
not be achieved for this dyad, which is consistent with
the different drawings.
HEALTHINF 2024 - 17th International Conference on Health Informatics
188
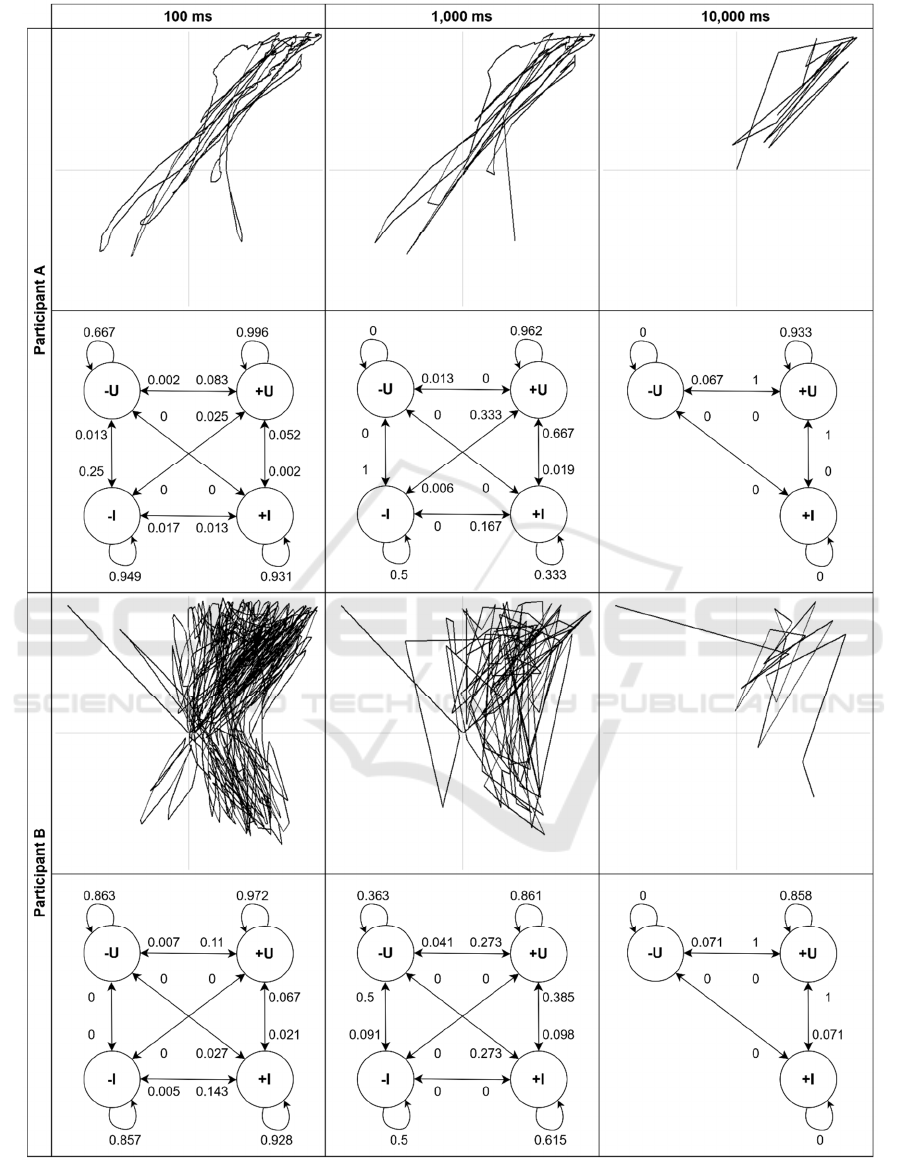
Figure 4: Time series of a dyad as Markov chains for the intervals 100 ms, 1,000 ms, and 10,000 ms. Above the Markov
chains, the corresponding drawings of the participants are shown. The mental states are emphasized by the vertical and
horizontal division lines within the drawings and match the positions of states in the Markov chains.
Observational Study of a Digital Application to Detect Attachment in Dyads Using Markov Chains
189

With last interval length of 10,000 ms, there are
much clearer effects due to the change in the time
series. The dyad has now much more harmonious
drawings and the state of thinking negatively about
oneself (-I) can no longer be detected, as it rarely
occurred in the beginning. The consequence is that
the Markov chains are simplified, so that both the
Markov property and homogeneity are now satisfied
for this dyad. The homogeneity is furthermore
consistent with the similar drawings.
4 DISCUSSION
4.1 Key Results
The first analysis shows that the participants' thoughts
generally can be modelled using a Markov chain
approach. This becomes particularly clear when the
lengths of the intervals between individual thoughts
are increased. One reason for this could be that fewer
states are included, as it can be seen in Figure 4 at an
interval of 10,000 ms. Thus, it seems that this interval
is no longer suitable for the analysis, even if all four
states were still present in some cases. In contrast,
when small interval lengths are applied, many of the
participants' thoughts lose the Markov property and
the probabilities that the states remain predominantly
in their state are very high. It could indicate that either
maintaining a mental state over a long period of time
cannot be determined as Markov chain or that the
screen area was too large to capture the states
accurately over time by this measurement method.
Whether thoughts can be accurately determined as
Markov chains remains unclear. Although Markov
chains have already been used as models, e.g., for the
development of caries in periodontology (Lu, 1966)
or for predicting the success of therapy, as in
outpatient departments for epileptics (Kriedel, 1979)
or in chronic cardiovascular diseases dependent on
therapy variants (Grimm et al., 1988), these
approaches never succeeded in gaining a global
acceptance in the field of medical research
methodology, which could be the reason for the lack
of relevant literature.
Based on the analysis of the homogeneity within
dyads, similarities can be drawn to the analysis on the
Markov property. For example, the strong trend
towards more homogeneous thinking dyads with
increasing interval lengths could be due to the
reduced states in thoughts, which most likely distorts
reality. Therefore, high intervals also seem rather
unsuitable here. In the smaller interval lengths, the
homogeneous and heterogeneous thinking dyads are
relatively evenly distributed, i.e., there are dyads that
are attached and dyads that are not attached. With
respect to the former study (Unger et al., 2020), from
which it appears that interpersonal attachment is
higher among couples and friends than among
colleagues and strangers, the approximately equally
distribution of constellations seem to explain the
equally distribution of interpersonal attachment in
this study. It is in accordance with studies that
investigated the interactions of dyads (Benjamin,
1979; Bollenrücher et al., 2023). It might indicate that
this novel approach is able to measure interpersonal
attachment with specific intervals, which at the same
would support the former results on this app. By
combining the two approaches, i.e., measuring
thoughts and interactions of dyads simultaneously, an
even more meaningful result could be provided. At
least, it is worth investigating.
In terms of Markov chain models, they seem very
useful for this type of stochastic research. As
highlighted in a recent opinion paper on research
methodologies for studying affect dynamics, Markov
chain models are powerful tools for analyzing the
underlying dynamics in the change of emotional
states and may provide substantial insights into the
dynamics of emotional responses and changes over
time (Cipresso et al. 2023). In combination with
machine learning approaches, Markov chains open
further opportunities, as they can be used not only to
analyze but also to predict emotional states (Sükei et
al. 2021) or students’ performance in a laboratory
environment (Paxinou et al. 2021).
4.2 Limitations
The innovative measurement method presented here
depends on continuous data collection and large gaps
in the data could lead to incorrect predictions, which
is one of the main limitations of this approach. Even
small gaps in the data may occur, as it was not
intended to entirely monitor the input. However, by
increasing the time intervals for the analysis, these
gaps can be covered.
Furthermore, the choice of interval lengths may
represent a limitation. At the time of the examination,
there was no literature on the optimal interval lengths
for analyzing thoughts. Only studies from other areas
that provide a solution to this issue could be found
(Sugimoto et al., 2021; Unger et al., 2021).
Nevertheless, the intervals could already be too wide
at 100 ms and it may possible that the optimum
interval was not covered by this incremental increase.
Nevertheless, the total of 100 different intervals
should provide a good basis for future research.
HEALTHINF 2024 - 17th International Conference on Health Informatics
190

Another limitation is the division of the screen
into four areas to represent the mental state. On the
one hand, the pixels of the vertical and horizontal
screen divisions relate to a specific state. The
corresponding counter-state is thereby reduced by a
few pixels. On the other hand, movements within a
state are always assigned to this state, even if the
thoughts were about the partner. While the former can
be neglected, the latter shows that states could be
missed. As this is the same for every participant, this
error compensates for itself. An alternative
measurement method would be to consider the
direction of the movement. Here, the predefined path
length of the movement should be calculated and
tested against a minimum distance to compensate for
the human tremor.
In terms of participants, the total amount is too
small to draw a final conclusion of this study. In
addition, only participants in a certain age range have
registered. Other age groups could possibly change
the result, as there could be cohort effects (Lindström
et al., 2002). And lastly, it is unclear whether the
participants understood their task immediately. As the
study was conducted on the basis of the movements
to be analyzed identically, the localization of the
states to which the stylus had to be moved was
predetermined. To achieve better results, it might be
advisable to consider personal movement preferences
or to include a familiarization phase in the future so
that the participants develop a feeling for the way to
move the stylus accordingly.
5 CONCLUSION
In this observational study, interpersonal attachment
in dyads was measured with a digital application.
During the measurement, the participants had to
transfer their thoughts to the app. The thoughts are
tracked as three-dimensional time series and analyzed
as Markov chains. Overall, the results showed that the
thoughts were mainly present as Markov chain. When
analyzing these thoughts of the dyads for
homogeneity, there were both heterogeneous as well
as homogeneous thinking dyads. Despite the
limitations, this study demonstrates from a
methodological point of view how time series data
captured by a tablet app as interpersonal attachment
can be analyzed using stochastic process models
outside the conventional methods of clinical studies.
In contrast, the limitations also lead to the need to
validate the results in further studies. Such studies
should incorporate other factors in the measurement.
In particular, the simultaneous examination of
thoughts and interactions of the dyads appears to be a
promising research project. Even an examination with
the addition of conventional tools, e.g., AAI or CAI,
would be an interesting project for the future.
ETHICAL VOTE
This study, which was conducted at Witten/Herdecke
University between 2021 and 2023, was approved by
the Ethics Committee of the Witten/Herdecke
University (Reference S-185/2021).
ACKNOWLEDGEMENTS
We would like to thank Theresa Frische and Fidan
Brand for their support in recruiting participants and
conducting the examination.
REFERENCES
Agrawal, H. R., Gunderson, J., Holmes, B. M., & Lyons-
Ruth, K. (2004). Attachment studies with borderline
patients: A review. Harvard review of psychiatry,
12(2), 94-104.
Altmann, U., Friemann, C., Frank, T. S., Sittler, M. C.,
Schoenherr, D., Singh, S., ... & Petrowski, K. (2021).
Movement and emotional facial expressions during the
adult attachment interview: Interaction effects of
attachment and anxiety disorder. Psychopathology,
54(1), 47-58.
Asmussen, S. (2003). Markov chains. Applied probability
and queues, 3-38.
Benjamin, L. S. (1979). Use of structural analysis of social
behavior (SASB) and Markov chains to study dyadic
interactions. Journal of Abnormal Psychology, 88(3),
303–319. https://doi.org/10.1037/0021-843X.88.3.303
Billingsley, P. (1961). Statistical methods in Markov
chains. The annals of mathematical statistics, 12-40.
Blanco, S., Peñacoba, C., Sanromán, L., & Pérez-Calvo, S.
(2018). Analysis of quantitative and qualitative
measures of attachment in patients with fibromyalgia:
The influence on nursing care. International Journal of
Mental Health, 47(1), 50-63.
Bretherton, I. (1992). The origins of attachment theory:
John Bowlby and Mary Ainsworth. Developmental
Psychology, 28(5), 759–775.
https://doi.org/10.1037/0012-1649.28.5.759
Brumbaugh, C. C., & Fraley, R. C. (2006). The Evolution
of Attachment in Romantic Relationships. In M.
Mikulincer & G. S. Goodman (Eds.), Dynamics of
romantic love: Attachment, caregiving, and sex (pp.
71–101). The Guilford Press.
Observational Study of a Digital Application to Detect Attachment in Dyads Using Markov Chains
191

Bollenrücher, M., Darwiche, J., & Antonietti, J. P. (2023)
Dyadic pattern analysis using longitudinal Actor-
Partner Interdependence Model with Markov chains for
unique case analysis. The Quantitative Methods for
Psychology, 19(3), 230-243.
https://doi.org/10.20982/tqmp.19.3.p230
Cipresso, P., Borghesi, F., & Chirico, A. (2023). Affects
affect affects: A Markov Chain. Frontiers in
Psychology, 14, 1162655.
Dolev, S., Frenkel, S., Cwikel, J., & Zakharov, V. (2020).
Probabilistic Models of Psychological Aspects in
Computer–based Social Interactions. In 2020
International Conference Engineering Technologies
and Computer Science (EnT) (pp. 133-139). IEEE.
Elbing, U., Appelbaum, S., & Ostermann, T. (2022).
Adverse events and contradictory effects of
benzodiazepine in a case with intellectual disability and
challenging behaviour. Journal of intellectual
disabilities, 17446295221134420.
https://doi.org/10.1177/17446295221134420
Evans, S. (2004). Attachment in old age: Bowlby and
others. In S. Evans & J. Garner (Eds.), Talking over the
years: A handbook of dynamic psychotherapy with
older adults (pp. 43–56). Brunner-Routledge.
Fearon, R. M. P., & Roisman, G. I. (2017). Attachment
theory: Progress and future directions. Current Opinion
in Psychology, 15, 131–136.
https://doi.org/10.1016/j.copsyc.2017.03.002
George, C., & West, M. (2004). The Adult Attachment
Projective: Measuring individual differences in
attachment security using projective methodology. In
M. J. Hilsenroth & D. L. Segal (Eds.), Comprehensive
handbook of psychological assessment, Vol. 2.
Personality assessment (pp. 431–447). John Wiley &
Sons, Inc..
Grimm, J., Hempel, W. E., Gerst, H., Richter, K., &
Hempel, B. (1988). Assessment of prognosis with
Markov chains in chronic cardiovascular diseases in
relation to various therapies. Zeitschrift fur die Gesamte
Innere Medizin und Ihre Grenzgebiete, 43(8), 205-209.
Hesse, E. (1999). The adult attachment interview:
Historical and current perspectives. In J. Cassidy & P.
R. Shaver (Eds.), Handbook of attachment: Theory,
research, and clinical applications (pp. 395–433). The
Guilford Press.
Insel, T. R. (1997). A neurobiological basis of social
attachment. American Journal of Psychiatry, 154(6),
726-735.
Kammermeier, M., Duran Perez, L., König, L., & Paulus,
M. (2020). Attachment security and attention to facial
emotional expressions in preschoolers: An eye‐tracking
study. British Journal of Developmental Psychology,
38(2), 167-185.
Kragel, P. A., Hariri, A. R., & LaBar, K. S. (2022). The
temporal dynamics of spontaneous emotional brain
states and their implications for mental health. Journal
of cognitive neuroscience
, 34(5), 715-728.
https://doi.org/10.1162/jocn_a_01787
Kriedel, T. (1979). Die Prognose von Therapieerfolgen
mittels Markov-Ketten: Eine Anwendung auf
Epilepsieambulanzen. Methods of Information in
Medicine, 18(01), 31-35. https://doi.org/10.1055/s-
0038-1636451
Lindström, J., & Kokko, H. (2002). Cohort effects and
population dynamics. Ecology Letters, 5(3), 338-344.
https://doi.org/10.1046/j.1461-0248.2002.00317.x
Lu, K. H. (1966). A path-probability approach to
irreversible Markov chains with an application in
studying the dental caries process. Biometrics, 22(4),
791-809. https://doi.org/10.2307/2528075
Main, M., Hesse, E., & Goldwyn, R. (2008). Studying
differences in language usage in recounting attachment
history: An introduction to the AAI. In H. Steele & M.
Steele (Eds.), Clinical applications of the Adult
Attachment Interview (pp. 31–68). The Guilford Press.
https://psycnet.apa.org/record/2008-04549-002
Paxinou, E., Kalles, D., Panagiotakopoulos, C. T., &
Verykios, V. S. (2021). Analyzing sequence data with
Markov chain models in scientific experiments. SN
Computer Science, 2, 1-14.
https://doi.org/10.1007/s42979-021-00768-5
Prasetio, B. H., Tamura, H., & Tanno, K. (2020). Deep
time-delay Markov network for prediction and
modeling the stress and emotions state transition.
Scientific Reports, 10(1), 18071.
https://doi.org/10.1038/s41598-020-75155-w
Privizzini, A. (2017). The Child Attachment Interview: A
Narrative Review. Frontiers in Psychology, 8, 384.
https://doi.org/10.3389/fpsyg.2017.00384
Spedicato, G. A., Kang, T. S., Yalamanchi, S. B., Yadav,
D., & Cordón, I. (2016). The markovchain package: a
package for easily handling Discrete Markov Chains in
R. Accessed Dec.
Strauss, G. P., Zamani Esfahlani, F., Visser, K. F.,
Dickinson, E. K., Gruber, J., & Sayama, H. (2019).
Mathematically modeling emotion regulation
abnormalities during psychotic experiences in
schizophrenia. Clinical Psychological Science, 7(2),
216-233.
Strauss, G. P., Esfahlani, F. Z., Raugh, I. M., Luther, L., &
Sayama, H. (2023). Markov chain analysis indicates
that positive and negative emotions have abnormal
temporal interactions during daily life in schizophrenia.
Journal of Psychiatric Research, 164, 344-349.
https://doi.org/10.1016/j.jpsychires.2023.06.025
Sükei, E., Norbury, A., Perez-Rodriguez, M. M., Olmos, P.
M., & Artés, A. (2021). Predicting emotional states
using behavioral markers derived from passively
sensed data: data-driven machine learning approach.
JMIR mHealth and uHealth, 9(3), e24465.
https://doi.org/10.2196/24465
Sugimoto, F., Kimura, M., & Takeda, Y. (2022).
Investigation of the optimal time interval between task-
irrelevant auditory probes for evaluating mental
workload in the shortest possible time. International
Journal of Psychophysiology, 177, 103-110.
https://doi.org/10.1016/j.ijpsycho.2022.04.013
Target, M., Fonagy, P., & Shmueli-Goetz, Y. (2003).
Attachment representations in school-age children: the
development of the child attachment interview (CAI).
HEALTHINF 2024 - 17th International Conference on Health Informatics
192

Journal of Child Psychotherapy, 29(2), 171–186.
https://doi.org/10.1080/0075417031000138433
Uccula, A., Mercante, B., Barone, L., & Enrico, P. (2022).
Adult Avoidant Attachment, Attention Bias, and
Emotional Regulation Patterns: An Eye-Tracking
Study. Behavioral Sciences, 13(1), 11.
Unger, S., Appelbaum, S., Ostermann, T., & Niedermann,
C. (2021). Movement Entropy in a Gardening Design
Task as a Diagnostic Marker for Mental Disorders:
Results of a Pilot Study. In Proceedings of the 14th
International Joint Conference on Biomedical
Engineering Systems and Technologies (BIOSTEC
2021) - Volume 5: HEALTHINF (pp. 337-343).
https://doi.org/10.5220/0010227203370343
Unger, S., Theis, C., & Ostermann, T. (2020). Examination
of Interpersonal Attachment with the Help of a Digital
Tablet Application: A Proof of Concept Study. In
Proceedings of the 13th International Joint Conference
on Biomedical Engineering Systems and Technologies
(BIOSTEC 2020) - Volume 5: HEALTHINF (pp. 310–
315). https://doi.org/10.5220/0008881003100315
Valenza, G., Nardelli, M., Lanata, A., Gentili, C., Bertschy,
G., Paradiso, R., & Scilingo, E. P. (2013). Wearable
monitoring for mood recognition in bipolar disorder
based on history-dependent long-term heart rate
variability analysis. IEEE Journal of Biomedical and
Health Informatics, 18(5), 1625-1635.
van Ijzendoorn, M. H., & Bakermans-Kranenburg, M. J.
(2008). The distribution of adult attachment
representations in clinical groups: A meta-analytic
search for patterns of attachment in 105 AAI studies. In
H. Steele & M. Steele (Eds.), Clinical applications of
the Adult Attachment Interview (pp. 69–96). The
Guilford Press.
Observational Study of a Digital Application to Detect Attachment in Dyads Using Markov Chains
193
