
An Algorithmic Approach for Quantitative Motion Artefact Grading in
HRpQCT Medical Imaging
Thomas A. Cox
1 a
, Sasan Mahmoodi
1 b
, Elizabeth M. Curtis
2 c
, Nicholas R. Fuggle
2 d
,
Rebecca J. Moon
2,4 e
, Kate A. Ward
2 f
, Leo D. Westbury
2 g
and Nicholas C. Harvey
2,3 h
1
Faculty of Engineering and Physical Sciences, Electronics and Computer Science, University of Southampton,
University Road, Southampton, U.K.
2
MRC Lifecourse Epidemiology Centre, University of Southampton, Southampton, U.K.
3
National Institute for Health Research (NIHR) Southampton Biomedical Research Centre, University of Southampton,
and University Hospital Southampton NHS Foundation Trust, U.K.
4
Paediatric Endocrinology, Southampton Children’s Hospital, University Hospital Southampton NHS Foundation Trust,
Southampton, U.K.
Keywords:
Medical Imaging, HRpQCT, High Resolution Peripheral Computed Tomography, Computed Tomography,
Motion Artefact, Artefact Detection.
Abstract:
High Resolution Peripheral Quantitative Computed Tomography (HRpQCT) is a modern form of medical
imaging that is used to extract detailed internal texture and structure information from non-invasive scans.
This greater resolution means HRpQCT images are more vulnerable to motion artefact than other existing
bone imaging methods. Current practice is for scan images to be manually reviewed and graded on a one to
five scale for movement artefact, where analysis of scans with the most severe grades of movement artefact
may not be possible. Various approaches to automatically detecting motion artefact in HRpQCT images
have been described, but these typically rely on classifying scans based on the qualitative manual gradings
instead of determining the amount of artefact. This paper describes research into quantitatively calculating
the degree of motion affecting an HRpQCT. This is approached by analysing the jumps and shifts present
in the raw projection data produced by the HRpQCT instrument scanner, rather than using the reconstructed
cross-sectional images. The motivation and methods of this approach are described, and results are provided,
along with comparisons to existing work.
1 BACKGROUND
There are various radiographic clinical methods
which allow clinicians to understand overall bone
health and detect and diagnose osteoporosis, a con-
dition characterized by low bone mineral density
and microarchitectural deterioration in bone struc-
ture. The current gold standard method is using Dual-
Energy X-ray Absorptiometry (DXA), which is used
to calculate areal bone mineral density (BMD). This
a
https://orcid.org/0000-0002-1343-8306
b
https://orcid.org/0000-0003-2507-659X
c
https://orcid.org/0000-0002-5147-0550
d
https://orcid.org/0000-0001-5463-2255
e
https://orcid.org/0000-0003-2334-2284
f
https://orcid.org/0000-0001-7034-6750
g
https://orcid.org/0009-0008-5853-8096
h
https://orcid.org/0000-0002-8194-2512
measurement is currently used in the definition of os-
teoporosis, but provides no detail on the microstruc-
ture of bone. High Resolution Peripheral Qualita-
tive Tomography (HRpQCT) is a modern computed
tomography (CT) technique for acquiring highly de-
tailed structural and texture information of bones. In
contrast to DXA, which generates only a two dimen-
sional image of the skeleton, HRpQCT provides a
three dimensional reconstruction of the internal struc-
ture of the subjects bones, which is used to derive
further quantitative parameters. A two dimensional
cross-sectional slice from a HRpQCT scan is shown
in figure 1. The unparalleled resolution and detail of
HRpQCT scans comes at the cost of high sensitiv-
ity to motion artefact. Motion artefact in CT scans
is quite different than what we traditionally think of
as motion artefact in regular images, such as those
taken with a standard camera. Whilst motion during
Cox, T., Mahmoodi, S., Curtis, E., Fuggle, N., Moon, R., Ward, K., Westbury, L. and Harvey, N.
An Algorithmic Approach for Quantitative Motion Artefact Grading in HRpQCT Medical Imaging.
DOI: 10.5220/0012434900003654
Paper published under CC license (CC BY-NC-ND 4.0)
In Proceedings of the 13th International Conference on Pattern Recognition Applications and Methods (ICPRAM 2024), pages 833-840
ISBN: 978-989-758-684-2; ISSN: 2184-4313
Proceedings Copyright © 2024 by SCITEPRESS – Science and Technology Publications, Lda.
833
traditional photography may appear as a blurring or
smearing of the subject, motion artefact in CT scans
appears as tangential streaking and a distorted view of
the subject. Figure 2 shows an example of this.
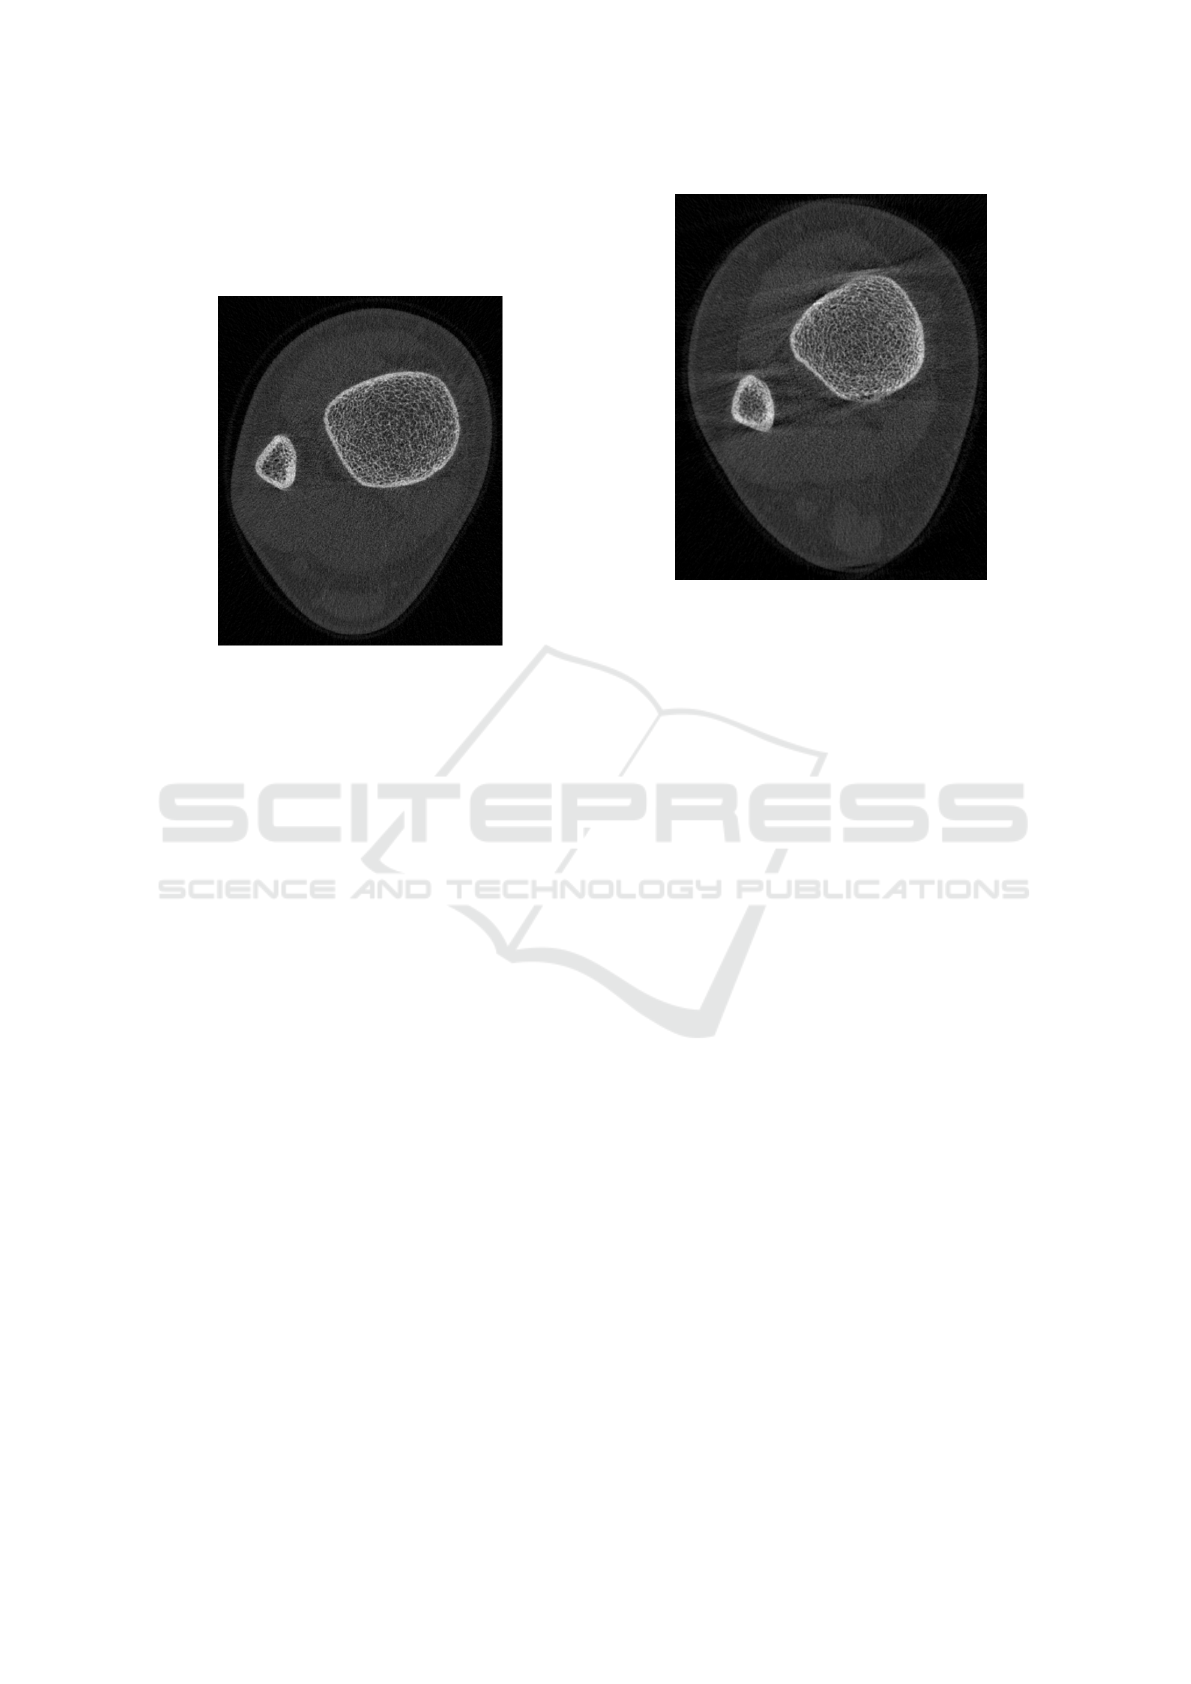
Figure 1: An example of a single 2D slice from a Tibial
HRpQCT scan. The bright white lines around the edge of
the bones is the cortex, while inside of this the trabecular
structure can be seen.
Currently motion artefact in HRpQCT scans is
manually graded using a scale from one to five. A
grade of one represents no motion artefact, and a
grade of five means the scan has an extreme amount
of motion artefact. According to the standard oper-
ating procedure provided by the hardware manufac-
turer (Scanco Medical), it is recommended that scans
with a motion grade of four or five are excluded from
analysis in research studies (Laib, 2023). Previous
research suggests that there is a a high level of agree-
ment between trained manual graders (Spearman cor-
relation of ρ
s
= 0.85), but it remains a subjective mea-
sure, and does not provide a continuous scale of arte-
fact severity (Pauchard et al., 2012).
The negative impact of motion artefact on
HRpQCT parameters has been investigated by both in
the scaphoid (Benedikt et al., 2023), and in the tibia
(Pauchard et al., 2011). Benedikt et al. compared
scaphoid bone parameters derived from HRpQCT
scans of the same patients with and without move-
ment, while Pauchard et al. compared images of ca-
daveric tibiae using a machine to precisely induce
movement. Both studies were able to demonstrate
significant deviation in HRpQCT derived parameters,
highlighting the importance of considering motion
artefact while examining these scans.
There has been a wealth of previous research
into automatic motion artefact detection in HRpQCT
scans, and in the field of motion correction for CT
scans in general. Walle et al. constructed and trained
Figure 2: An example of a single 2D slice from a tibial
HRpQCT with a high level motion artefact. This image
has been manually graded with a motion artefact score of
5. Streaking can clearly be seen across the image tangential
to the top and bottom of the bones. Additionally the cortex
of the tibia can be seen to be distorted as it does not connect
together at the top and bottom correctly. Compare to figure
1 for an image without motion artefact.
a deep convolutional neural network trained on 3312
2D slices taken from 414 manually graded HRpQCT
scans. This model was able to successfully classify
and differentiate scans graded less than three, from
those graded above three which would require exclu-
sion or a repeated scan. Walle et al. calculated the
f1 score, precision and recall of this model as 86.8%,
87.5% and 86.7% respectively. However, the authors
recognise that the performance of this model was
much lower when classifying the scans by grade with
an f1 score of 43.4% due to their model often mis-
classifying by one artefact grade (Walle et al., 2023).
The subjective nature of the manual grading makes
it impossible for a network trained using that data to
provide a completely objective motion artefact score.
Other researchers have been using convectional
neural networks to classify artefact in other types of
CT images. In a study identifying motion in head
CT images Liu et al. developed a graph based ap-
proach whereby two dimensional slices of cranial CT
scans were converted into a complex graph and then
used to train a convolution neural network to clas-
sify scans into those affected by motion artefact or
unaffected. From the construction of these graphs,
they demonstrated the significant differences in graph
node clustering and degree between the two groups
of scans, and when trained they showed the model
outperformed traditional pixel based learning meth-
ods (Liu et al., 2022).
ICPRAM 2024 - 13th International Conference on Pattern Recognition Applications and Methods
834

Throughout this paper, we will describe our novel
approach for detecting HRpQCT motion artefact.
First we provide our motivation for a sinogram based
detection method, then we describe our algorithm
and implementation using a U-Net architecture. Fi-
nally we discuss our preliminary results, and share our
plans for future work.
2 ANALYSING HRPQCT
SINOGRAMS
2.1 The Radon Transform
Before a CT image can be evaluated, the raw projec-
tion data needs to be processed and transformed to
produce a cross sectional slice of the region of in-
terest. CT instruments are able to do this by emit-
ting x-rays through the region of interest at many dif-
ferent angles measuring the attenuation of the x-ray
(the loss of energy) caused by the internal parts of
the object at each angle. At each of these different
angles the x-rays will pass through different planes
through the subject, and result in different attenua-
tions or projections of these planes. By combining
these projections by using the Radon transform (also
known as back projection) the scanner can produce a
reconstructed cross-sectional image of the region of
interest such that the internal structure of their bones
can be analysed. The raw projection data from a CT
scan is known as a sinogram, as off-centre objects in
the subject will appear to oscillate as the scanner ro-
tates around them. An example sinogram from a sin-
gle 2D slice is shown in Figure 3. The Xtreme CT II
scanner (developed by Scanco Medical in Brutteslein,
Switzerland) takes all 110 2D slices over an area of
the subject simultaneously and gradually rotates 180
◦
around the subject, constructing a sinogram for each
slice row by row. Because of this, each row of the
sinogram represents a projection taken of the subject
from a given angle. In Figure 3 there are three distinct
objects: the soft tissue of the leg appearing in light
grey, and inside of this there are two darker cross-
ing sections representing the bones. The wider sec-
tion is the tibia and the narrower section is the fibula.
Towards the top of the scan, the tibia and fibula ap-
pear to overlap as those at the angles those rows were
captured at the x-rays passed through both bones. In
other words, the scan began with a side on view of the
leg but about half way down the scan, the tibia and
fibula stop overlapping, and in each row there are two
distinct darker patches where there is bone. This is
because after the scanner has rotated halfway through
the scan, x-rays either pass though one bone or the
other, effectively meaning that once the scanner has
rotated halfway through the scan (about 90
◦
) it is pro-
jecting a side on view of the leg. Once the scanner has
finished rotating around the subject and has all 110
full sinograms, it applies the Radon transform to each
one resulting in the cross sectional HRpQCT image
shown in Figure 2. The Radon transform effectively
maps and combines each row of the sinogram onto a
different diameter of a circle, reconstructing the im-
age into a cross section. It is able to extract depth in-
formation by the amplitudes of the vertical sine waves
in the sinogram. If there was a circular object directly
at the centre of the scan, it would remain in the same
horizontal position in each row of the sinogram. The
further away from the centre a circular object is, the
greater its position will vary in different rows of a
sinogram.
Additional research that deals with detecting mo-
tion artefact in HRpQCT scans focuses on properties
of these sinograms, as in these images, motion arte-
fact is much clearer. As each angle of the sinogram is
taken sequentially, the vertical axis can be treated as
time. Therefore, if a subject moves half way through a
scan, the sinogram should show motion artefact in the
rows in the middle of the sinogram. Figure 3 shows
an example of a sinogram with motion artefact. In
this sinogram the subject has moved their leg near the
beginning of the scan, so when the scanner moves on
to subsequent angles, the positions of their soft tissue
and bones seem shifted to the side. The single jump
shown in Figure 3 is what causes the artefact shown in
Figure 2, as the rows in the radon transform no longer
agree on where objects are, causing streaking and dis-
connects in the edges of the bones.
2.2 Artefact Detection
By inspecting sinograms, motion artefact is much eas-
ier to understand. Artefact is seen simply as the
amount that the sinogram jumps or shifts, which be-
gins to provide a way of quantitatively measuring the
amount of motion in a HRpQCT image. Pauchard et
al. have proposed a method to automatically quantify
motion artefact based on the first and second moments
of the sinogram (Pauchard et al., 2011). The authors
show that these moments which they use to calculate
the in-plane translation during the scan are accurate
when compared to experiments where a scan is taken
of a sample with controlled motion.
Sode et al. also use HRpQCT sinograms to im-
plement a quantitative way of measuring the motion
artefact (Sode et al., 2011). The authors exploited
the nature of the sinogram in order to compare the
first and last lines and determine the net difference.
An Algorithmic Approach for Quantitative Motion Artefact Grading in HRpQCT Medical Imaging
835

Figure 3: An example sinogram from a slice of a tibial HRpQCT scan with motion artefact. Each row of the scan represents
an angle where X-rays were passed through the subject. The pixels in each row show the projection created by a plane of
X-rays passing though the subjects leg at a given angle. Here a clear jump can be seen roughly a quarter of the way down the
scan, this represents where the subject has moved and their leg is now in a different location. This jump is the cause of the
motion artefact seen in Figure 2.
This is effective as the HRpQCT scanner emits x-rays
through a 200
◦
range. As such, the rows at the top of
the sinogram, from 0
◦
to 20
◦
, should mirror those at
the bottom, from 180
◦
to 200
◦
, as they represent pro-
jections of the subject from the opposite side. Given
this, assuming the subject has not moved during the
duration of the scan, the difference between the top
and bottom rows of the sinogram should be minimal.
Conversely, if the subject has shifted, these will be
noticeably different. This process is, however, com-
plicated by the nature in which the Xtreme CT II scan-
ner emits x-rays; the cone beam configuration causes
slight magnification of the subject to different extents
at 0
◦
and 180
◦
ranges. Sode et al. were able to correct
this by transforming the sinogram from the cone beam
domain (where x-rays are emitted in a cone from a
single point) to the parallel beam domain, as if the x-
rays were emitted equally spaced and in parallel. Af-
ter performing this transformation, they showed that
their Quantitative Motion Estimates (QMEs) derived
from the sum squared of the difference between the
top and bottom rows of the sinogram correlate with
the manual grades given to HRpQCT images. For ex-
ample, they show that HRpQCT images with a grade
of five have significantly increased QMEs that those
with lower artefact grades.
This method is effective at detecting overall mo-
tion during the scan, however it has two major draw
backs. First, it only determines the net motion be-
tween the start and end of the scan. Thus if a sub-
ject was to twitch, briefly moving and then moving
back, it is possible that this method would result in
a misleading low to zero QME, as their method only
considers the net difference between the first and last
lines of the sinogram. Second, this method provides
no means of detecting where or when the jumps oc-
curred during the scan, and therefore does not assist
in correcting the artefact. Sode et al. address the fact
that while there is a difference in QME derived from
scans with a manual quality grade of five, the QMEs
overlap for scans graded between one and four. The
authors attribute this in part to the subjective nature of
manual grades, but we hypothesis that it is also caused
by the global nature of the way their QMEs are calcu-
lated. In Section 3 we discuss our proposed strategy
for detecting all motion that occurs throughout a sino-
gram.
3 IMPLEMENTATION
We used HRpQCT scans taken as part of the Mater-
nal Vitamin D Osteoporosis Study (MAVIDOS) (Har-
vey et al., 2012) and Southampton Women’s Survey
(SWS) (Inskip et al., 2006) studies in order to investi-
gate methods of detecting motion artefact from sino-
gram data. We initially tried to detect motion arte-
fact entirely algorithmically in the sinogram by us-
ing a combination of edge detection and the Hough
transform. However we found that the edges were
simply too faint in comparison to the CT noise to ac-
curately detect this. This method relied on detecting
horizontal lines across the image where ”jumps” had
occurred, as seen near the top of Figure 3. Unfor-
ICPRAM 2024 - 13th International Conference on Pattern Recognition Applications and Methods
836

tunately, where jumps occurred, due to the nature of
trabecular bone, there were little to no pixel to pixel
differences between lines around the jump, resulting
in failure in both edge and ridge detection failed to
detect where the jumps occurred. Nonetheless, using
this method in conjunction with the Hough transform
with tuned parameters would often detect small seg-
ments of lines where jumps occurred along the edges
of the bone. Still, we found it difficult to ensure that
these jumps were accurately detected in the presence
of noise without over-smoothing the image and losing
edge information.
Realizing the main indicators of a jump occurring
were most evident along the edge of the bones, we
began working on detecting and tracing the six ma-
jor vertical edges of the image, corresponding to the
edges of the soft tissue, tibia and fibula. Our mo-
tivation was that if we could extract traces of these
sinusoidal edges, we would be able to detect where
anomalies or jumps occurred in each edge. Then hav-
ing detected these anomalies in the same place on a
sufficient number of edges, we would be able to con-
fidently say that a jump had occurred at that location.
With this method, severity and direction of the shift
would also be detected by analysing how much the
edge deviated from its sinusoidal pattern. This ap-
proach has motivated the remainder of our research
into motion artefact detection and correction, as it
should be able to accurately detect where in a sino-
gram jumps have occurred, as well as measure the
severity of each jump independently. This approach
will be beneficial both for automatically calculating
a quantitative measure of motion artefact in the scan,
and to subsequently inform how individual shifts can
be corrected or reduced. Initially we used a simple
canny edge detection algorithm to detect and trace
these six major edges; however, too much noise was
included in the traces to allow for accurate detection
of where anomalies occurred. To solve these prob-
lems, we segmented the sinograms using machine
learning to quickly and accurately find the traces of
the edges needed.
3.1 U-Net Segmentation
In order to accurately segment the sinogram images,
we used the state-of-the-art U-Net architecture. U-
Net is a fully convolutional neural network that is
widely used for CT and other biomedical imaging
tasks due to its fast training speed and high accu-
racy even with comparatively low amounts of data
(Yin et al., 2022). Before we could begin training
a U-Net model to segment our HRpQCT sinograms,
we split the combined scans from the MAVIDOS and
SWS cohorts equally into a training and testing group.
Then to increase the amount of data we had available,
we decided to sample three random slices from each
HRpQCT scan in the training set and treat them as
separate images. While different slices of the same
scan will be similar, we hypothesised that the differ-
ences caused by viewing a different section of bone
increased size of our dataset without the risk of over-
fitting. This resulted in a training sample of up to
1,110 different sinogram slices. We manually masked
600 of these different sinograms in order to gather
some preliminary results and determine whether U-
Net segmentation would be effective.
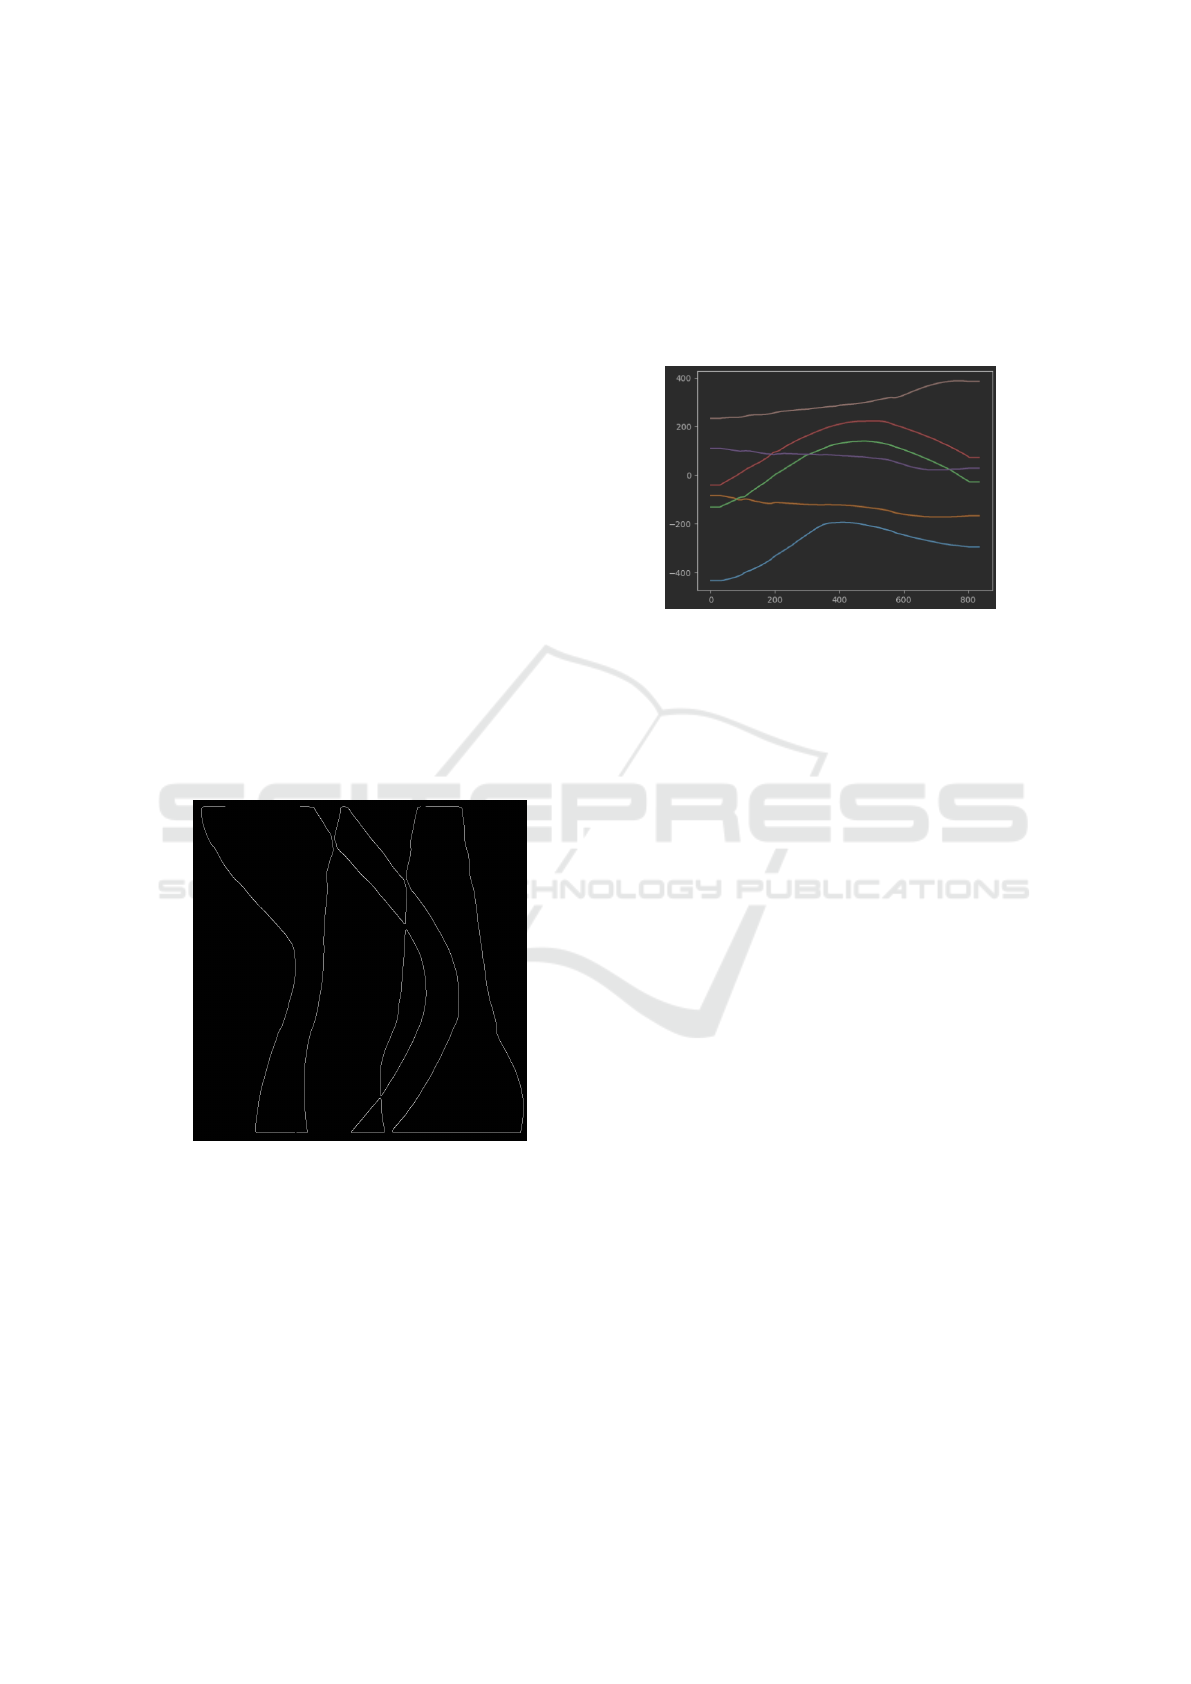
Figure 4: Here an overlay of masks predicted by our U-
Net model for the distinct segmented areas in a HRpQCT
sinogram is shown. The areas segmented in this image,
shown in different colours accurately trace out the appro-
priate areas even where motion artefact has occurred during
the scan. The scan shown here was manually assigned a
motion artefact grade of five.
With this training sample, we constructed a U-
Net model in python with Keras using the segmen-
tation methods library. As a proof of concept we used
the default U-Net construction of 4 encoding and 4
decoding layers. We defined the loss function us-
ing a combination of categorical focal loss and dice
loss, used a softmax activation function to assign each
pixel to its appropriate mask/class. Once the net-
work was constructed, we trained it on the labeled
HRpQCT sinograms for 80 epochs with a learning
rate of 0.00001 and a batch size of 10 images. Af-
ter 80 epochs of training the network reached a loss
of 0.0512, an intersection over union score of 0.9154
and an f1-score of 0.9492. Once we were satisfied
that it was accurate, we began predicting masks for
the sinograms in the test set and were able to confirm
that the network was automatically masking images
correctly. An example of the output masks that the
model predicted for an image with high motion arte-
fact is shown below in Figure 4. As seen in the figure
An Algorithmic Approach for Quantitative Motion Artefact Grading in HRpQCT Medical Imaging
837
we segmented the sinogram into five main areas: left
and right soft tissue, central soft tissue between the
tibia and fibula, and where the tibia and fibula overlap
at the top and bottom of the sinogram. By segmenting
these areas, we ensured that every edge was captured
by at least one of these segments, ensuring that we
can capture any distortion caused by motion artefacts
in these masks.
From visual inspection of the results produced by
our U-Net model for the testing set, we determined
that jumps and shifts in the sinogram were being cap-
tured by the masks. Our next challenge was devel-
oping an algorithm to piece together traces of the six
major edges in the image from these masks. We be-
gan by using a simple Canny filter to extract the edges
from each of the masks. Then after combining the
edges into one image, such as the image shown in Fig-
ure 5, our algorithm detects the points where each of
the masks get closest to each other to find the points
where the edges of the tibia and fibula would intersect
in the image. Then it splices together the appropriate
parts of each of the edges around these points in or-
der to construct the six major edge traces which are
displayed in Figure 6. This figure in fact shows the
distance between each of the traces and the vertical
centre line of the sinogram.
Figure 5: This figure shows a combined image of all of the
edges detected from a masks produced by U-Net. In order
to convert these edges into the actual edges of the subjects
leg, tibia and fibula, our algorithm detects where the edges
would cross and splices together edges at these points to
construct the edge signals shown in 6.
One disadvantage of the method used to segment
the sinograms is that our algorithm will fail to capture
any motion artefact in the unlikely case that it occurs
in a sinogram exactly where the edges of the tibia and
fibula intersect. In the future it may be possible to
retrain the U-Net with images where the soft tissue,
tibia and fibula are segmented more directly, but it
would require manually tracing some edges multiple
times plus more segmentation regions where the tibia
and fibula overlap. For the time being we have ac-
cepted this as a shortcoming of our current approach,
but any net shift in these regions should still be de-
tected.
Figure 6: This figure shows the edge traces captured from
the masks shown in Figure 4. Each different coloured
curve in the image plots the distance between each of the
traces and the vertical center line of the sinogram, where
the horizontal-axis shows the row of the sinogram, and the
vertical axis shows the distance . The lines are constant
at the beginning and end of the plot where the traces were
cropped in order to make the edge detection more robust.
4 PRELIMINARY RESULTS
As shown in Figure 6, shifts and jumps in the the
sinogram slice of an HRpQCT scan can be captured
via examining edge traces, even when to the edge
is very small. Although the original HRpQCT scan
shown in Figure 4 has been assigned a motion artefact
grade of five and has pronounced discontinuities, the
peaks and troughs detected from the edge traces are
quite smooth. Nonetheless we implemented a sim-
ple anomaly detection algorithm, where we detected
where local peaks and troughs occurred in each sig-
nal and measured their prominences. Then to create
a simple quantitative measure of motion artefact that
occurred in the image, we summed the prominences
at each location across all six of the edges, and set
a threshold to determine that if more than one edge
agreed, there was a shift or jump at a particular loca-
tion. This gives a list of locations and prominences
for where motion artefact had occurred in the sino-
gram, which we summed to derive an estimate of how
much motion had occurred in a sinogram slice. Sub-
sequently for 600 images in the test set, the U-Net
model was used to predict masks. These were then
used to capture edge traces and calculate a quanti-
tative motion artefact estimate for them as described
ICPRAM 2024 - 13th International Conference on Pattern Recognition Applications and Methods
838
above. Figure 7 shows the range of grades this algo-
rithm assigned to the test sinograms organized by the
preassigned manual motion artefact grading. While
this figure does show that our rudimentary algorithm
gives a larger number of high scores to sinograms
from images with a higher manual motion artefact
grade, it also suggests that some of the images with
high manual grade motion artefact are given very low
motion artefact estimates. We had hoped to produce a
similar diagram to that by Sode et al. showing a cor-
relation between our motion estimates and the man-
ual grades, however, it appears as though many in-
stances of motion artefact are not being appropriately
detected. We are hopeful that through refinement of
our algorithm, we will be able to use the edge traces
we extracted to better detect motion artefact.
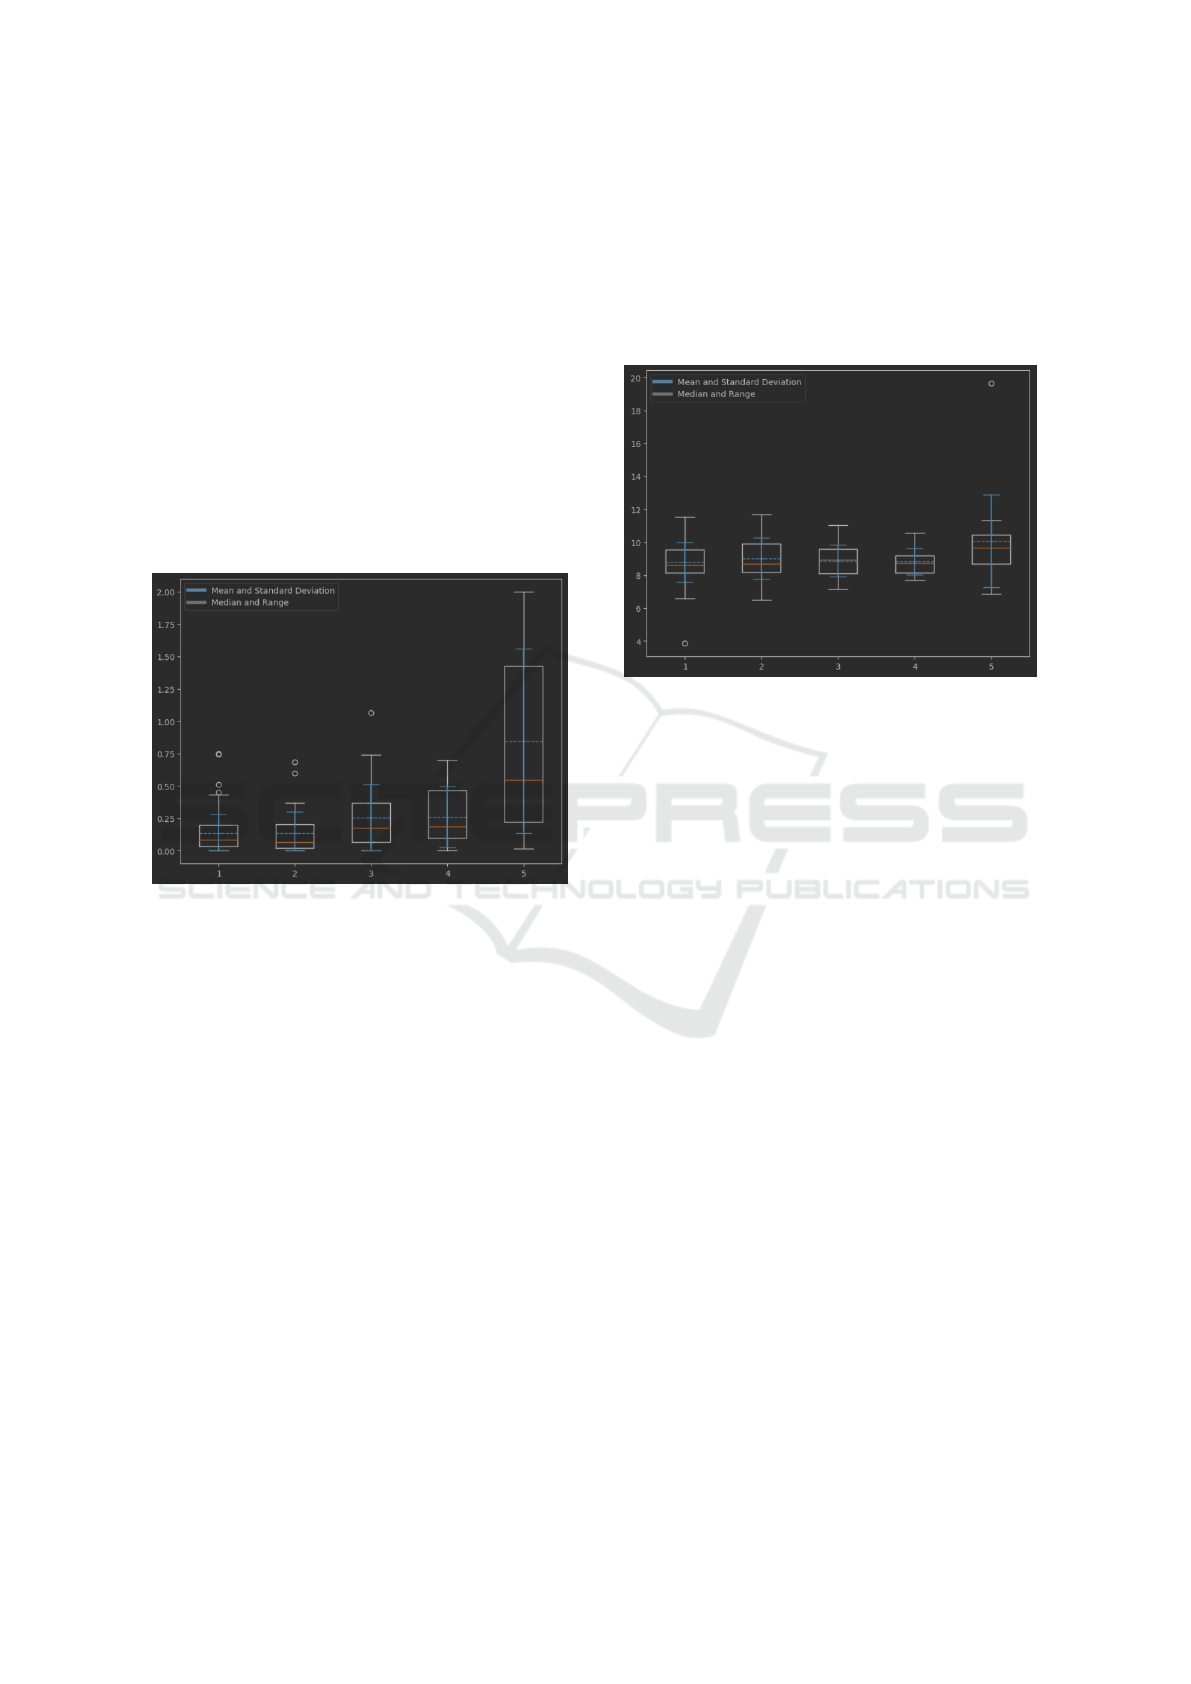
Figure 7: This plot shows the spread and means of motion
artefact estimates our algorithm assigned to sinograms from
the testing set, organized by their manually assigned quality
scores. This shows an association between our calculated
quantitative measure of artefact in scans with the manually
assigned grade. Scans with a high motion artefact grade (5)
receive higher estimated scores.
5 DISCUSSION
While our current scoring algorithm fails to fully cor-
relate with the manual motion artefact grades, it does
still somewhat capture the levels of motion artefact,
generally giving scans with motion artefact grade five
higher scores. The main drawback of of current al-
gorithm is assigning low scores to scans that contain
high levels of motion artefact. From inspection of
the algorithm’s results, it is clear that the main cause
of this miss-classification are cases where the current
anomaly detection method fails to detect jumps in the
sinogram. While we hope to improve by retraining
our U-Net model and improving our edge detection,
even our current algorithm shows promising results in
cases where motion artefact is scored appropriately.
Visual inspection of the graded sinograms confirms
that where our algorithm assigns a high motion arte-
fact score, artefact is detected where jumps and shifts
occur in the sinograms. This feature of our algorithm
forms the basis for subsequent approaches to correct
motion artefact in HRpQCT scans.
Figure 8: The correlation between QMEs and manual grad-
ing of scans our testing dataset are shown in this plot. For
each of the five categories of manually assigned scores, the
spread and standard deviation of QMEs in each of those
categories are shown. QMEs shown in this plot where cal-
culated using the methods and algorithm described by Sode
et al. (Sode et al., 2011).
In order to compare our results, we re-
implemented the QME algorithm described by Sode
et Al. (Sode et al., 2011) to classify the motion arte-
fact in our dataset. However, their methods lower per-
formance when applied to our dataset, displaying to a
weaker association between high quantitative scores
of scans with a high manual grade than in our algo-
rithmic results. Our numerical results clearly demon-
strate a superior performance for our algorithm in
motion artefact detection in comparison with our re-
implementation of the previous work done by Sode et
al. especially in scans with motion artefact of grade
five, our results show a significant separation between
motion artifacts of grade five with the other motion
artefact levels. This could be attributed to two fac-
tors. First, as part of their approach the HRpQCT
sinogram data is converted into a parallel beam format
using proprietary code provided by Scanco Medical.
This ensures that differences between the projections
from opposite ends of the sinogram are minimized
and the QMEs can be calculated correctly. When re-
implementing this we were unable to gain access to
this proprietary code. Instead we coded our own con-
version to the parallel beam format manually, which
may have introduced some differences in the results.
Second, the dataset used by Sode et al. is composed
An Algorithmic Approach for Quantitative Motion Artefact Grading in HRpQCT Medical Imaging
839

of middle-aged adults (Sode et al., 2011), whereas
our dataset included only children under ten years
old. Because of this, our dataset contains many ex-
amples of extreme motion artefact, which the QMEs
calculated by Sode et al. in their paper may not be
able to accurately depict. Nonetheless we would still
like to highlight the potential of clinical applications
of our algorithm. Not only would clinicians be able
to immediately repeat a scan in which motion arte-
fact has been automatically detected, but additionally,
scans were artefact may be unavoidable, such as those
with young children, may be corrected and included
in study.
6 FUTURE WORK
Our preliminary results have shown that our al-
gorithmic approach to detecting motion artefact in
HRpQCT scans can distinguish between scans with
high and low levels of motion artefact. However,
as described above, there are some limitations, as
our current model cannot accurately distinguish the
amounts of motion contained in scans graded one to
four. In our further research we plan to increase our
training samples and refine our U-Net model to im-
prove our sinogram segmentation and make it more
robust to noise. We predict that this will improve the
accuracy of our detection of jumps in the sinogram
data, and therefore increase the accuracy of our nu-
merical motion artefact measures. We plan to con-
tinue to iterate on this approach to ensure that our
quantitative results accurately reflect the amount of
distortion caused by motion in the image, and can be
used to inform the accuracy of HRpQCT parameters
derived from artefact affected scans.
ACKNOWLEDGEMENTS
TC is supported through a doctoral studentship at
the University of Southampton funded jointly by
the MRC Lifecourse Epidemiology Centre and the
Institute for Life Sciences. This work was sup-
ported by MRC [MC PC 21003; MC PC 21001],
and National Institute for Health Research (NIHR)
Southampton Biomedical Research Centre, Uni-
versity of Southampton, and University Hospital
Southampton NHS Foundation Trust, UK.
REFERENCES
Benedikt, S., Horling, L., Stock, K., Degenhart, G., Pal-
lua, J., Schmidle, G., and Arora, R. (2023). The im-
pact of motion induced artifacts in the evaluation of
HR-pQCT scans of the scaphoid bone: an assessment
of inter- and intraobserver variability and quantitative
parameters. Quant. Imaging Med. Surg., 13(3):1336–
1349.
Harvey, N. C., Javaid, K., Bishop, N., Kennedy, S., Papa-
georghiou, A. T., Fraser, R., Gandhi, S. V., Schoen-
makers, I., Prentice, A., and Cooper, C. (2012).
MAVIDOS maternal vitamin D osteoporosis study:
study protocol for a randomized controlled trial. the
MAVIDOS study group. Trials, 13:13.
Inskip, H. M., Godfrey, K. M., Robinson, S. M., Law, C. M.,
Barker, D. J. P., Cooper, C., and SWS Study Group
(2006). Cohort profile: The southampton women’s
survey. Int. J. Epidemiol., 35(1):42–48.
Laib, A. (2023). Sop quality grading.
Liu, Y., Wen, T., Sun, W., Liu, Z., Song, X., He, X., Zhang,
S., and Wu, Z. (2022). Graph-based motion artifacts
detection method from head computed tomography
images. Sensors, 22(15):5666.
Pauchard, Y., Ayres, F. J., and Boyd, S. K. (2011). Auto-
mated quantification of three-dimensional subject mo-
tion to monitor image quality in high-resolution pe-
ripheral quantitative computed tomography. Physics
in Medicine & Biology, 56(20):6523.
Pauchard, Y., Liphardt, A.-M., Macdonald, H. M., Hanley,
D. A., and Boyd, S. K. (2012). Quality control for
bone quality parameters affected by subject motion in
high-resolution peripheral quantitative computed to-
mography. Bone, 50(6):1304–1310.
Sode, M., Burghardt, A. J., Pialat, J.-B., Link, T. M., and
Majumdar, S. (2011). Quantitative characterization of
subject motion in hr-pqct images of the distal radius
and tibia. Bone, 48(6):1291–1297.
Walle, M., Eggemann, D., Atkins, P. R., Kendall, J. J.,
Stock, K., M
¨
uller, R., and Collins, C. J. (2023). Mo-
tion grading of high-resolution quantitative computed
tomography supported by deep convolutional neural
networks. Bone, 166:116607.
Yin, X.-X., Sun, L., Fu, Y., Lu, R., and Zhang, Y. (2022).
U-Net-based medical image segmentation. J. Healthc.
Eng., 2022:4189781.
ICPRAM 2024 - 13th International Conference on Pattern Recognition Applications and Methods
840
