
Aggregating Predicted Individual Hospital Length of Stay to Predict
Bed Occupancy for Hospitals
Mattis Hartwig
1 a
, Simon Schiff
2 b
, Sebastian Wolfrum
3 c
and Ralf M
¨
oller
2 d
1
singularIT GmbH, 04109 Leipzig, Germany
2
German Research Center for Artificial Intelligence, Ratzeburger Allee 160, 23562 L
¨
ubeck, Germany
3
University Medical Center Schleswig–Holstein, Campus L
¨
ubeck, Ratzeburger Allee 160, 23538 L
¨
ubeck, Germany
Keywords:
Bed Occupancy Prediction, Emergency Department, MIMIC-IV, CatBoost Architecture.
Abstract:
This paper addresses the important issue of optimizing hospital bed management by integrating machine
learning-based length of stay (LoS) predictions with bed occupancy forecasting. The study primarily uti-
lizes the MIMIC-IV dataset to compare actual bed occupancy against predictions derived from estimated LoS.
A novel approach is adopted to translate individual patient LoS predictions into bed occupancy forecasts for
the entire hospital. Through various simulations, the paper evaluates the effects of different error margins
and patterns in LoS predictions on bed occupancy forecasting accuracy. Key findings reveal that a more sym-
metric error distribution in LoS predictions significantly enhances the accuracy of bed occupancy forecasts
compared to merely reducing the overall prediction error. The paper makes significant contributions to the
field. The paper introduces a practical translation scheme from LoS prediction to bed occupancy, which is cru-
cial for hospital administrators in resource planning and management. Also the paper illuminates how various
improvements in state-of-the-art LoS prediction models can directly impact the accuracy of bed occupancy
forecasts, thereby setting clear objectives for future machine learning research.
1 INTRODUCTION
The efficient management of hospital resources, par-
ticularly bed allocation, remains a critical challenge
for healthcare providers worldwide. In recent years,
a considerable body of research has focused on pre-
dicting hospital length of stay (LoS) as a means to
optimize patient flow and resource utilization (Baek
et al., 2018; Buttigieg et al., 2018; Gentimis et al.,
2017; Mak et al., 2012; Rocheteau et al., 2021; Stone
et al., 2022; Lequertier et al., 2021; Winter et al.,
2023). With the advance of data science applica-
tions in the healthcare sector, researchers have used
machine learning techniques to forecast LoS for indi-
vidual patient’s at different points in patient’s hospital
life-cycle.
For hospitals the patient’s LoS has a direct im-
pact on the occupancy rates (Majeed et al., 2012).
Other studies have examined the opposite effect that
a
https://orcid.org/0000-0002-1507-7647
b
https://orcid.org/0000-0002-1986-3119
c
https://orcid.org/0000-0001-6941-0030
d
https://orcid.org/0000-0002-1174-3323
for example a high occupation in the hospital leads to
longer length of stay for emergency department (ED)
patients (Forster et al., 2003). Overall the relation
is very straight-forward, when a patient has a longer
LoS a bed in the hospital is blocked for a longer pe-
riod of time. Therefore an overall lower LoS across
multiple patients decreases the occupancy rates of the
hospital and allows the treatment of more patients.
Currently the work on forecasting or simulating
bed occupancies in hospitals is detached from the LoS
prediction performed with classic machine learning
methods. This gap in research presents a significant
opportunity for improving hospital bed management
strategies. In this paper, we focus on translating the
LoS prediction for individual patients into a predic-
tion of bed occupancy for the whole clinic. Therefore
we look at state-of-the-art hospital length of stay pre-
diction research on the MIMIC-IV data set and com-
pare calculated bed occupancy based on the actual
LoS to the calculated bed occupancy based on pre-
dicted LoS. We conduct several simulations to better
understand the impact of different error margins and
error curves of LoS predictions on prediction of bed
occupancy. By establishing a clear linkage between
Hartwig, M., Schiff, S., Wolfrum, S. and Möller, R.
Aggregating Predicted Individual Hospital Length of Stay to Predict Bed Occupancy for Hospitals.
DOI: 10.5220/0012433600003657
In Proceedings of the 17th International Joint Conference on Biomedical Engineering Systems and Technologies (BIOSTEC 2024) - Volume 2, pages 175-184
ISBN: 978-989-758-688-0; ISSN: 2184-4305
Copyright © 2024 by Paper published under CC license (CC BY-NC-ND 4.0)
175
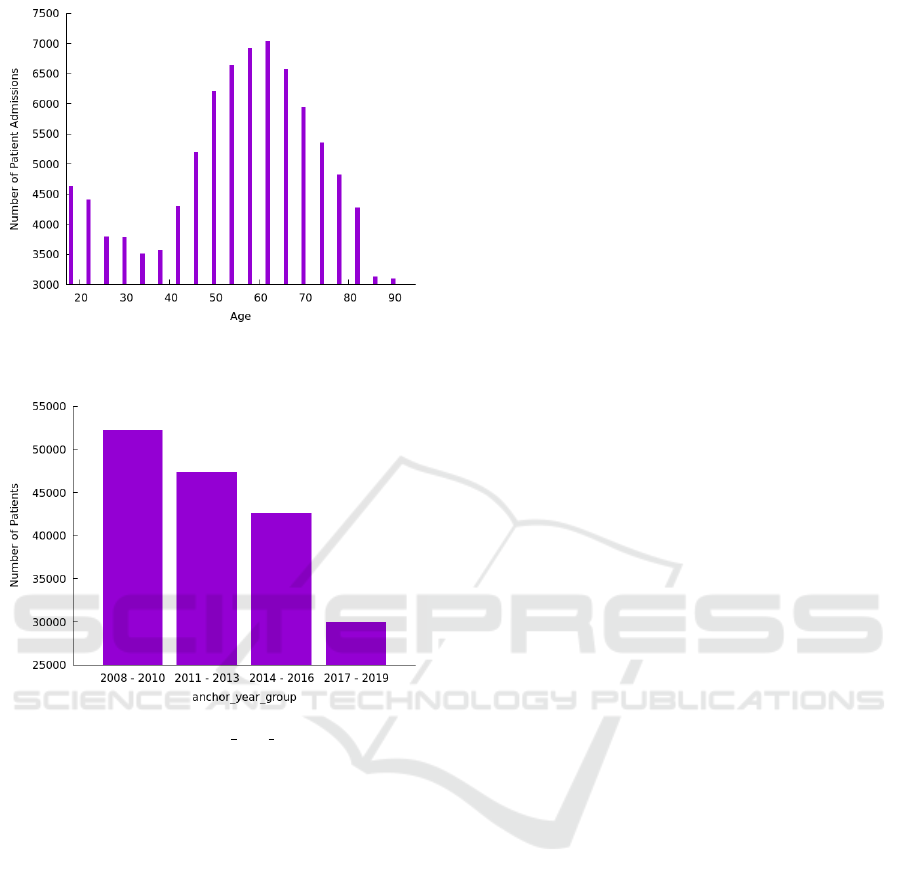
Figure 1: Patients age at when they where admitted to the
hospital ED.
Figure 2: Aggregated anchor year group distribution.
these two predictive domains, we endeavor to present
a model that not only anticipates patient flow but also
serves as a tool for strategic planning, ultimately con-
tributing to improved patient care and hospital effi-
ciency.
One core finding is that a more symmetric error
distribution in state-of-the-art LoS prediction would
have higher impact on predicting a bed occupancy
than halving the error for all predictions in the dataset.
Another finding is that in use case where we predict
a bed occupancy three days in advance, using an av-
erage number of admissions and average LoS for the
patients does result in poor prediction underlying the
need for detailed patient by patient LoS prediction.
The remainder of the paper is structured as fol-
lows. Section 2 covers the related work on LoS pre-
diction and bed occupancy in hospitals. Section 3
describes the used data set and the methodology to
calculate occupancy. Section 4 contains experiments.
Section 5 discusses the results. Section 6 concludes
and provides ideas for further research directions.
2 RELATED WORK
The related work for this paper consists of research
on hospital length of stay and of research on bed oc-
cupancy in hospitals. As mentioned in the introduc-
tion there has been various research using machine
learning for predicting hospital length of stay. For us
the main related work is the work from Winter et al.
(2023) where the authors predict the stationary LoS
after a patient moves from the ED to the stationary
hospital units. This work also uses the MIMIC-IV
data set, uses state-of-the-art machine learning mod-
els and allows an aggregation of the predicted LoS
versus the actual LoS of patients. The authors also
provide the model for us in order to look at the er-
ror curve and make several adjustments in our exper-
iment.
There are of course other papers focusing on re-
lated machine learning tasks that predict LoS in dif-
ferent scenarios. Gentimis et al. (2017) predict the
LoS after a patient leaves the intensive care unit (ICU)
and Rocheteau et al. (2021) predict the remaining
days in the ICU. Regarding bed occupancy there have
been different research streams that can be related
to our work. First, model the decisions which pa-
tients to take into the hospital and assign a bed as
a queuing problem. Examples are the work from
Gorunescu et al. (2002) who formulated a queuing
model that can be used to schedule patients to re-
duce delay and the work from Belciug and Gorunescu
(2015) who included an evolutionary optimization ap-
proach in their queuing. Second, using compartment
models to describe the flow of patients through com-
partments within the total number of patients. Exam-
ples are the work from Harrison (1994) and Mackay
and Lee (2005). Third, using classical time-series
forecasting methods. Examples are the early work
from Farmer and Emami (1990) who used ARMA
models and the work of Kutafina et al. (2019) who
used RNN models. Notably, Mackay and Lee (2005)
has already mentioned critique on using average LoS
to calculate occupancy and therefore introduced com-
partment modeling. Since 2005 the work on machine
learning for predicting individual LoS for patient has
advanced a lot. In this paper we therefore address a
very important conceptual gap that combines thoughts
from early research on occupancy with the power of
machine learning on individual patients.
HEALTHINF 2024 - 17th International Conference on Health Informatics
176
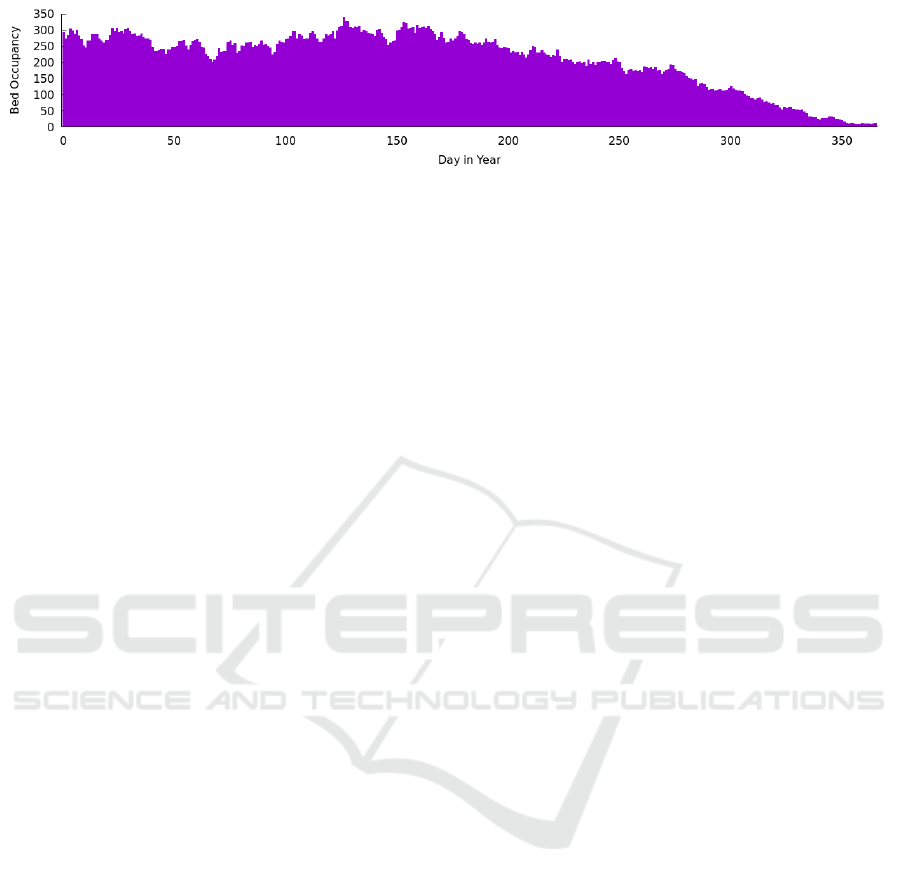
Figure 3: Bed occupancy distribution for an example year.
3 DATA SET AND BED
OCCUPANCY
In this section, we describe the underlying dataset cre-
ated from the MIMIC-IV collection and the method-
ology for calculating bed occupancy.
3.1 MIMIC-IV
MIMIC-IV is a centralized medical information
mart, containing real-world electronic health records
(EHRs) about roughly 300k patients, who visited in a
total of 430k times the Beth Israel Deaconess Medical
Center in Boston between the years 2008 and 2022
(Johnson et al., 2023). All data is stored separately
into four different modules, namely the core, hosp,
icu, and recent published ED module. Patients where
de-identified according to Health Insurance Portabil-
ity and Accountability Act (HIPAA) in order to en-
sure patient data privacy. Among others, for each pa-
tient, all dates where shifted by a randomly selected
offset. Hence, dates are not real anymore, however
the interval between dates for each patient is still pre-
served. We describe in the following selected fea-
tures, how to extract these and which outliers where
removed for first predicting LoS as described by Win-
ter et al. (2023). Only data is extracted at when a
patient is located at the ED, as otherwise we would
consider too many information for predicting the LoS
of a patient in the hospital. By removing outliers, the
following statistics about selected features may differ
from those listed in Johnson et al. (2023). We dis-
tinguish between demographic, medical, and triage
features extracted from the MIMIC-IV database and
selected four demographic ones:
Gender. The gender is of type binary and extracted
from the patient’s relation. It is either “F” or “M”.
Age. The age of a patient is extracted as well as the
gender from the patients relation and is rounded
to whole numbers. The distribution is depicted in
Figure 1.
Ethnicity. Eight different ethnicities where extracted
from the admissions relation.
Insurance. The insurance is extracted from the ad-
missions relation. Approximately 15k are “medi-
caid”, 66k are “medicare”, and 90k are “other”.
We extracted nine different medical features from the
database:
ICD Code. The International Statistical Classifica-
tion of Diseases and Related Health Problems
(ICD) code is extracted from the diagnosis rela-
tion within the ED module. It encodes the pri-
mary diagnose of the patient that entered the ED.
Within the data, 50% are ICD-9 and 50% are ICD-
10 codes.
Admission Location. The location of a patient prior
being submitted to the hospital is extracted from
the admissions relation. Patients were submit-
ted from eleven different locations in our dataset
from, among others, “walk-in/self referral” or the
“physician referral”.
Diagnosis Count. The total count of diagnoses were
made at when a patient is located in the ED.
Medicine Count. Patients are asked to provide a list
of medications they currently take. We extract the
count of different medications as a feature from
the medrecon relation within the ED module.
Previous Admissions. The total count of admissions
of a patient in the past to the hospital extracted
from the admissions relation.
Average LoS of Previous Stays. The average LoS
of previous stays extracted from the admissions
relation.
ED LoS. The LoS of a patient in the ED extracted
from the edstays relation within the ED module.
LoS. The LoS of a patient in the hospital is the target
feature we aim to predict, has as well as the ED
LoS an accuracy of minutes and its distribution is
depicted in Figure 5.
Finally, we extracted seven different features from the
triage relation within the ED module.
Resprate. The patient’s respiratory rate per minute.
Temperature. Measured temperature of the patient.
Aggregating Predicted Individual Hospital Length of Stay to Predict Bed Occupancy for Hospitals
177
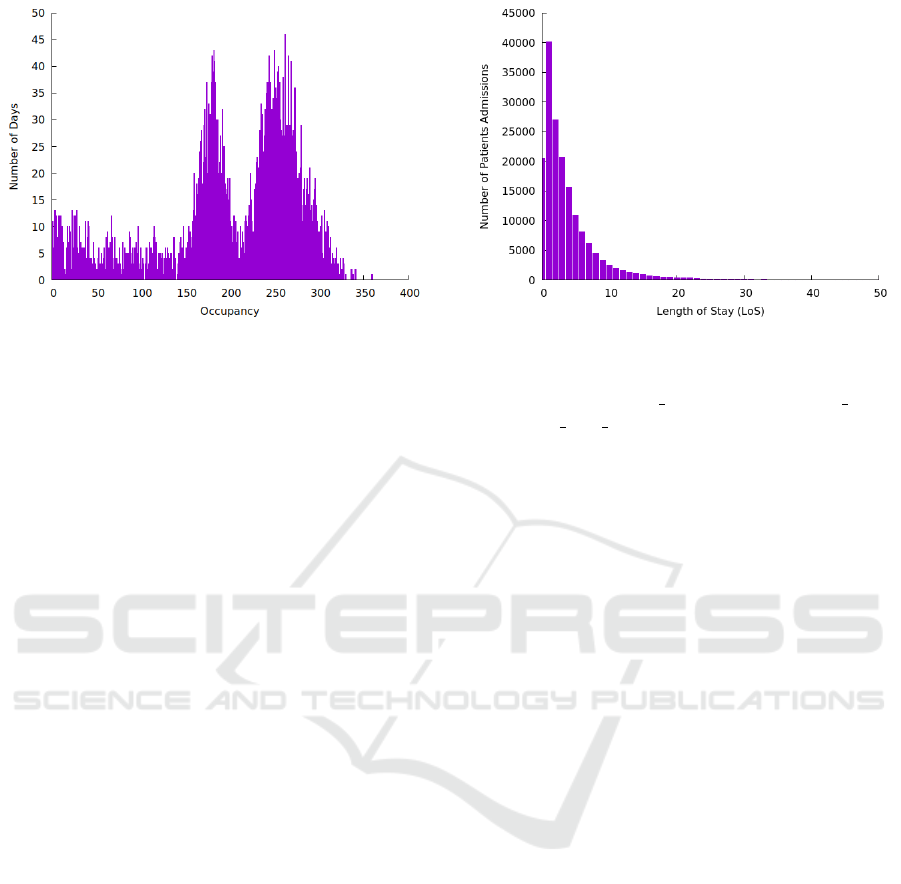
Figure 4: Actual Occupancy.
O2sat. Oxygen saturation of the patients blood.
SBP. Systolic blood pressure.
DBP. Diastolic blood pressure.
Pain. The pain felt during the admission. Measured
between one and ten.
Acuity. The priority between one and five of how ur-
gently the patient needs treatment.
In total, MIMIC-IV contains EHRs of 299, 712
patients from which 180, 733 where admitted to the
hospital with 431, 231 individual admissions, from
which 205, 504 patients entered the ED. From these
patients, who entered the ED, 93, 114 patients with
171, 606 individual admissions are used in the final
training dataset after extracting features and remov-
ing outliers. Outliers are filtered out by removing pa-
tients under the age of 18 and admissions with a LoS
of more than 50 days. For us the 171, 606 admissions
will be the basis for all further analyses.
3.2 Bed Occupancy
Although predicting the LoS with an EHR is useful,
it does not directly help hospital staff to know how
many patients may be occupying the hospital within
the next days. Hence, given the predicted LoS of a
patient, we aim to predict the total bed occupancy for
the next days. Predicting the total bed occupancy of
a hospital requires access to exact dates at when a
patient was admitted to a hospital. However, due to
the anonymization process applied to the MIMIC-IV
database, only a range of anchor years is available to
indicate when a patient was admitted in the hospital
as illustrated in Figure 2.
Exact dates are shifted consistently for each pa-
tient by a randomly selected offset. For instance, a
patient is 50 years old in the year 2150, visited the
ED in 2160-01-14 08:14:02, and visited the hospital
Figure 5: Distribution of LoS.
ED somewhere in reality between the years 2008 and
2010, then the anchor year is 2150, anchor age is
50, anchor year group is 2008−2010, and the intime
is 2160-01-14 08:14:02. Hence, it is known that at
2160-01-14 08:14:02 the patient is 60 years old when
visiting the ED, however the real date at when the pa-
tient visited the ED is completely unknown. In this
paper, we use the shifted the admission date to have a
relative even spread over the years and map all admis-
sion dates to the real data collection period of twelve
years between 2008 and 2019.
With the patients spread over the time we can cal-
culate a corresponding bed occupancy by counting all
patients that are in the hospital on that day. It is im-
portant to understand that this method implies that the
individual patients LoS and the occupation are not in-
dependently measured. We cannot make any claims
that say the LoS of ED patients is driving the hospi-
tal bed occupancy because we directly calculate the
occupancy using the LoS. But those claims are not in
focus of this paper. Instead we want to analyse how
different accuracy or shapes of error curves of predict-
ing LoS effect the accuracy or the shape of predicting
bed occupancy in the process of aggregation.
The bed occupancy for one artificial year (after the
shift) in the mimic database is depicted in 3 and ag-
gregated over all years in Figure 4. It can be seen that
the spread is relatively even throughout the year with
occupancy ranging from 8 to 338 patients. The mean
is 208.6 and the standard deviation through the year
is 88.54.
4 GENERATING LOS
PREDICTIONS
As described by Winter et al. (2023) and in Subsec-
tion 3.1, we approximate the LoS of a patient, given
HEALTHINF 2024 - 17th International Conference on Health Informatics
178
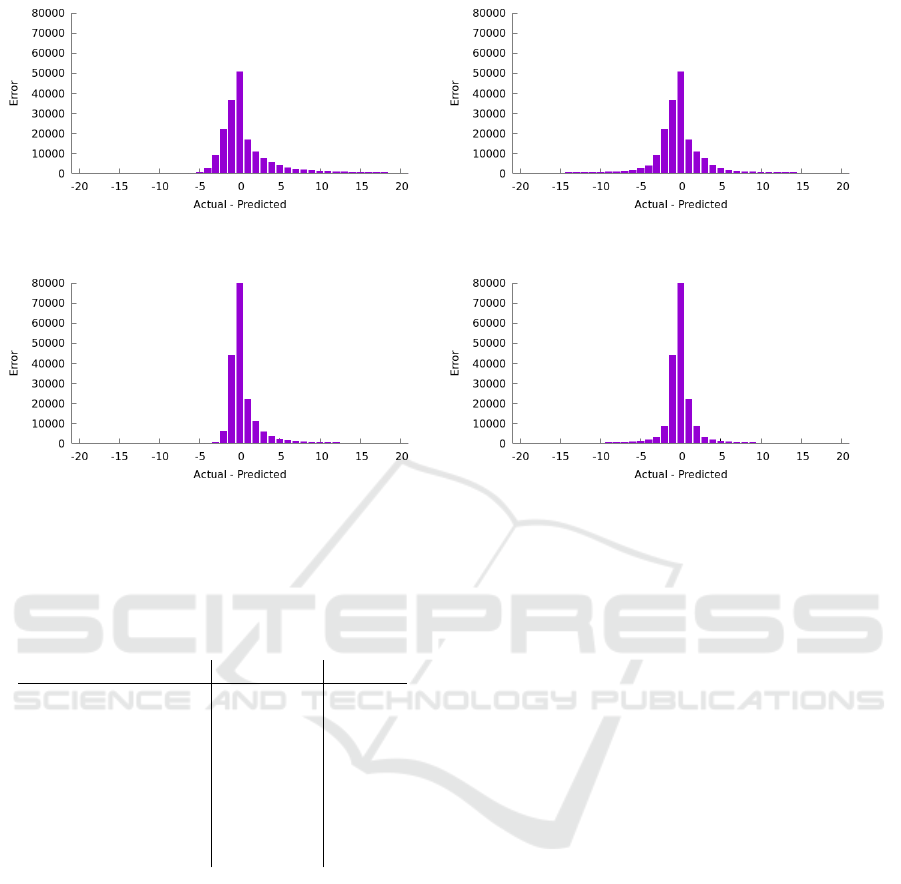
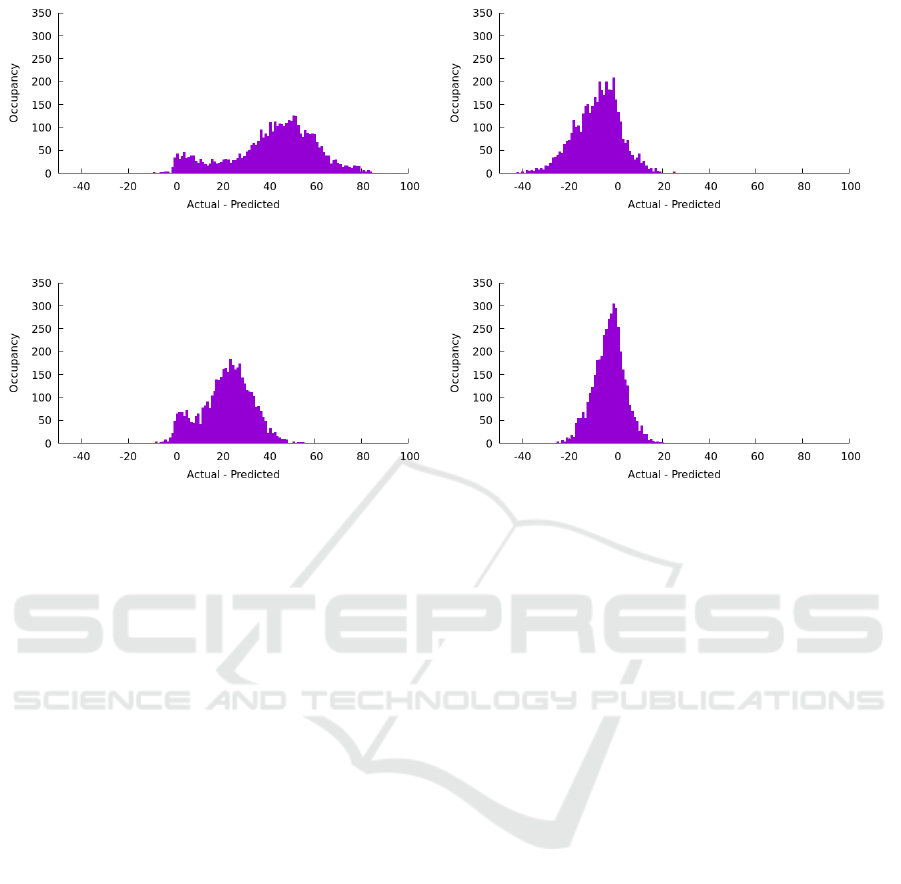
(a) LoS prediction error in the basis scenario (Winter et al.,
2023) with mean = 0.98 and derivation = 4.51.
(b) Symmetric LoS prediction error with mean = −0.25 and
derivation = 4.61.
(c) Narrowed LoS prediction error distribution with mean =
0.49 and derivation = 2.25.
(d) Symmetric and then narrowed LoS prediction error with
mean = −0.12 and derivation = 2.31.
Figure 6: LoS error distribution for all four scenarios.
Table 1: Hyperparameter selection of the final CatBoost
model, after the grid search has been performed Winter et al.
(2023).
Hyperparameter Value Default
Learning rate 0.1 no
Tree depth 6 no
L2 regularization 50 no
Random strength 1 yes
Bagging temperature 1 yes
Border count 128 yes
Internal dataset order False yes
Tree growing policy Symmetric yes
only those information one could obtain during the
patients stay in the ED of the hospital. We generate
four scenarios for different LoS error distributions.
4.1 Scenario 1 (Basis)
The basis scenario just uses the CatBoost model ar-
chitecture with the hyperparameter, as listed in Table
1, and training regime from Winter et al. (2023) to
generate LoS predictions. The corresponding distri-
bution of the LoS error can be found in 6a. The mean
absolute error is 2.34. The distribution has a skew
resulting in an overall underestimation of the LoS.
4.2 Scenario 2 (Simulation, Symmetry)
The second scenario is a simulation that enforces the
error distribution to be more symmetric. The main
skew is introduced by the patients with long stay that
are not predicted by the model resulting in a long tail
of positive errors (errors were the actual is larger than
the predicted value). To enforce symmetry, we calcu-
late the difference in number of admissions between
a positive error bucket (e.g. 5) and its corresponding
negative bucket (e.g. -5) and shift half of the differ-
ence in the negative bucket by overriding the predic-
tion with the corresponding value. Because the center
is already relative symmetric we start this shift begin-
ning at an LoS error of 3. This shift does not affect the
mean absolute error of the prediction because for each
admission the absolute error stays the same (only the
sign has changed). The LoS error distribution can be
found in Figure 6b.
4.3 Scenario 3 (Simulation, Narrow)
The third scenario is a simulation that assumes a bet-
ter prediction of the LoS. It is simply taking the orig-
inal LoS prediction and the actual LoS for each ad-
mission and takes the average of both values as a new
prediction, thus halving the error for each admission.
The resulting mean absolute error is 1.17. The LoS
error distribution can be found in Figure 6c.
Aggregating Predicted Individual Hospital Length of Stay to Predict Bed Occupancy for Hospitals
179
(a) Occupancy error from LoS distribution with Mean =
42.05, MAE = 42.10.
(b) Occupancy error from symmetric LoS distribution with
Mean = -7.53, MAE = 9.82.
(c) Occupancy error from narrowed LoS distribution with
Mean = 22.13, MAE = 22.20.
(d) Occupancy error from symmetric and then narrowed
LoS distribution with Mean = -2.68, MAE = 5.78.
Figure 7: Occupancy error distributions for all four scenarios.
4.4 Scenario 4 (Simulation, Narrow,
Symmetric)
The last scenario is a simulation that combines both
changes. The errors are made symmetric and then
halved. The resulting mean absolute error is again
1.17. The LoS error distribution can be found in Fig-
ure 6d.
5 ANALYSIS OF BED
OCCUPANCY
In this section, we describe two analyses of the bed
occupancy in a hospital, given four different scenarios
for the predicted LoS of an admission, as described in
Chapter 4. The first analysis takes an outside perspec-
tive and compares a fully predicted vs. a fully actual
view. The second more realistic analysis takes a hos-
pital administrator view and takes the time at which
the prediction is made into account.
5.1 Overarching View
First we take an overarching view where we just ag-
gregate the actual and the predicted LoS into a bed oc-
cupancy respectively and then compare the two num-
bers day by day. Of course that analysis reflects
not how a real hospital provider would actually use
the data, because at everyday there would be already
some information of the patient and for the follow-
ing days there would be data missing but this gives an
idea about the direct relation of the two different error
types.
Using the predicted LoS of a patient in Scenario
1 underestimates the bed occupancy as can be seen
in the error curve in Figure 7a. This behavior is ex-
pected, as the LoS of a patient is underestimated as
well. The MAE (the average daily error for bed oc-
cupancy) is 42.10 whereas the mean is 42.05 showing
the skew towards underestimation.
In Scenario 2 where we enforced the symmetry,
the MAE is reduced to 9.82 whereas the mean is even
slightly negative. The resulting error curve in bed oc-
cupancy can be seen in Figure 7b. The view over time
in 8b shows that the bed occupancy errors are now less
one-sided and even slightly negative.
In Scenario 3 where the prediction was made sig-
nificantly better in the simulation, the MAE is reduced
to 22.20 but the skew is still present (even if it is of
course also scaled down). The resulting error curve
in bed occupancy can be seen in Figure 7c. The view
over time in 8c shows that the bed occupancy have
still a skew to the underestimation even though it is
smaller.
In Scenario 4 where both improvements were in
the simulation, the MAE is reduced to 5.78. The re-
HEALTHINF 2024 - 17th International Conference on Health Informatics
180
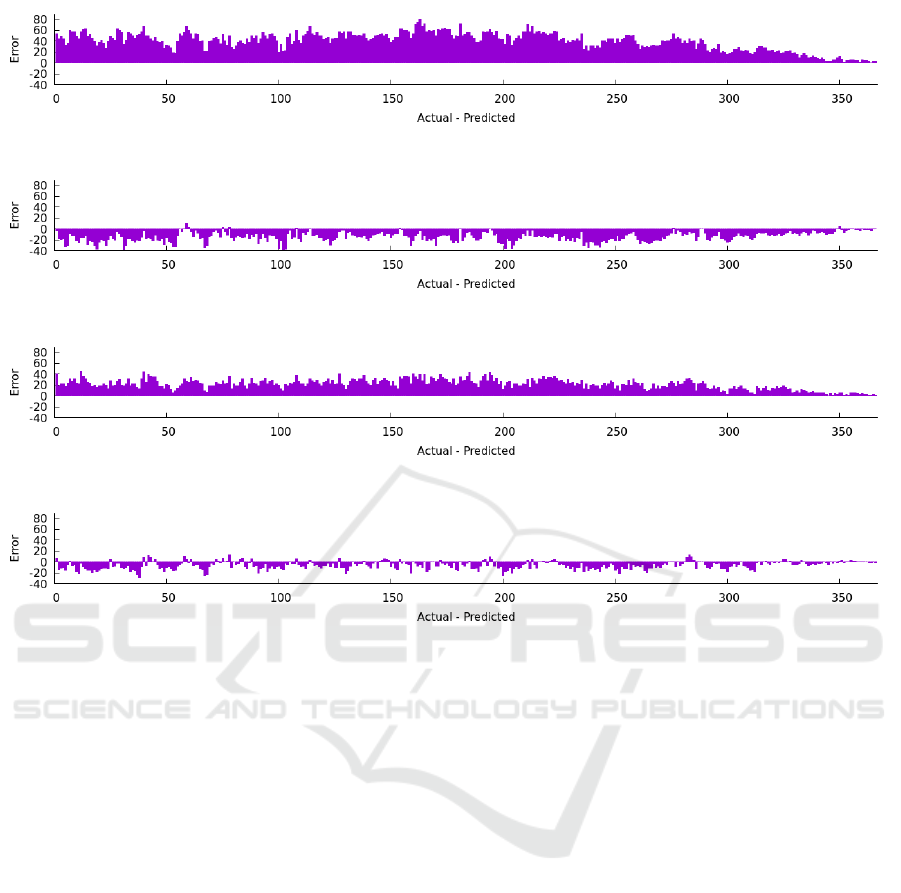
(a) Occupancy error from LoS distribution over the year 2010.
(b) Occupancy error from symmetric LoS distribution over the year 2010.
(c) Occupancy error from narrowed LoS distribution over the year 2010.
(d) Occupancy error from symmetric and then narrowed LoS distribution over the year 2010.
Figure 8: Occupancy error within an example year all four scenarios.
sulting error curve in bed occupancy can be seen in
Figure 7d. The view over time in 8d shows the most
balanced errors in both directions.
5.2 Time-Dependent View
The more realistic scenario involves a hospital admin-
istrator using a LoS prediction in real-world condi-
tions. At a fixed point in time, t
n
, the administrator
seeks to forecast hospital occupancy for a specific fu-
ture date, t
n+i
, i days ahead.
In practice, predictions can only utilize data
within the time range (t
0
, t
n
). The LoS is calculated
for patients admitted between (t
0
, t
n
) who have not yet
been discharged. By summing the estimated number
of patients likely to be in the hospital at t
n+i
, one can
approximate the bed occupancy for that date. This
estimation can be refined by considering the average
number of patients admitted post t
n
and their likeli-
hood of remaining in the hospital at t
n+i
.
In the following example, at each t
n
, the hospi-
tal administrator aims to predict the patient count for
t
n+3
, i.e. three days later. This involves forecasting the
LoS for patients currently in the hospital at t
n
and es-
timating the average admissions between (t
n+1
, t
n+3
),
including those likely to stay at least until t
n+3
, as il-
lustrated in Figure 10.
On average, 40.85 patients are admitted daily, and
their LoS distribution is shown in Figure 5. As in-
dicated in Figure 10, of the daily 40.85 average ad-
missions, 22.05 are expected to remain in the hospital
at least until t
n+3
. By t
n+2
, an average of 29.00 pa-
tients will likely stay for at least one more day, thus
still present at t
n+3
. Additionally, 40.85 patients are
projected to be admitted on t
n+3
itself. Therefore, the
forecasted patient count at t
n+3
is the sum of these fig-
ures, plus the number of patients in the hospital at t
n
expected to stay until t
n+3
.
Scenario 1’s predicted LoS tends to overestimate
bed occupancy at t
n+3
, with a mean error of −5.99,
as depicted in Figure 9a. Scenario 2, shown in Fig-
ure 9b, demonstrates a slightly improved mean abso-
lute error (MAE) compared to Scenario 1, but with a
higher mean error of −13.44. In Scenarios 3 and 4,
illustrated in Figure 9c and Figure 9d respectively, the
mean error is lower, although the MAE is marginally
worse than in Scenarios 1 and 2.
Overall, the error across all four scenarios is
Aggregating Predicted Individual Hospital Length of Stay to Predict Bed Occupancy for Hospitals
181
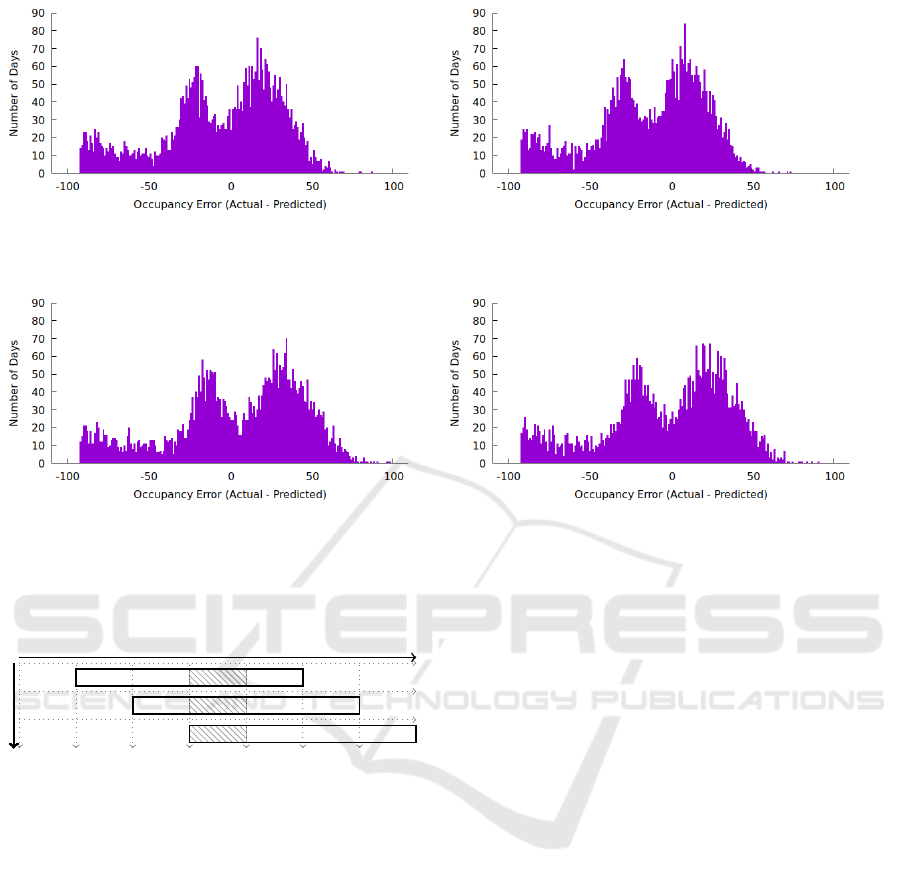
(a) Occupancy error with a forecast of three days with fill-
ing from LoS distribution with Mean = −5.99 and MAE =
29.87.
(b) Occupancy error with a forecast of three days with filling
from a symmetric LoS distribution with Mean = −13.44 and
MAE = 28.30.
(c) Occupancy error with a forecast of three days with filling
from a narrowed LoS distribution with Mean = 4.13 and
MAE = 34.08.
(d) Occupancy error with a forecast of three days with filling
from a symmetric and then narrowed LoS distribution with
Mean = −2.74 and MAE = 31.57.
Figure 9: Time dependent occupancy error distribution with a forecast of three days.
t
n+0
t
n+1
t
n+2
t
n+3
t
n+4
t
n+5
t
n+6
#los ≥ 2 = 22.05 Patients
#los ≥ 1 = 29.00 Patients
#los ≥ 0 = 40.85 Patients
Figure 10: Occupancy filling at t
0
for predicting bed occu-
pancy at t
3
with 22.05 + 29.00 + 40.85 ≈ 92 patients being
in average additionally at the hospital at t
3
nearly identical, stemming from the assumption that
the number of patients admitted post t
n
and present
at t
n+3
is a constant, estimated at 92. An overview
of all four scenarios, including the overarching and
time-dependent view, can be found in Table 2.
6 DISCUSSION OF THE RESULTS
When we examine the MAE across the four scenar-
ios from an overarching perspective, it becomes ev-
ident that reducing the skew in predicting hospital
LoS has a more significant impact on the accuracy
of bed occupancy forecasts than halving the distance
between all predictions and actual values. Although
this general effect might have been anticipated, its ex-
tent is quite remarkable. For hospital providers, man-
aging occupancy is more crucial than predicting in-
dividual LOS for patients. Hence, focusing on these
real-world aggregations and their improvement is es-
sential. In a generalized view, it is clear that more em-
phasis should be placed on creating a more symmet-
ric error curve rather than solely enhancing accuracy.
This symmetry also affects the occupancy error over
time, as illustrated in Figure 8. A more balanced er-
ror curve, with equal under- and overprediction, could
facilitate hospital administrators in optimally schedul-
ing elective procedures during periods of lower-than-
expected bed occupancy.
In the time-dependent analysis, the errors appear
relatively consistent across all scenarios. Due to the
large number of patients with short LoS, using the
average number of patients with average LoS signifi-
cantly impacts bed occupancy predictions for the fol-
lowing three days, proving this method to be an inad-
equate predictor. These findings highlight the impor-
tance of using individual patient-based LoS predic-
tions for accurate bed occupancy forecasting. Relying
solely on averages omits crucial information. For fu-
ture predictions, where upcoming patient admissions
are unknown, additional research should consider sea-
sonal or other factors to better estimate the number
and types of incoming patients.
HEALTHINF 2024 - 17th International Conference on Health Informatics
182

Table 2: Overview of all four scenarios including the overarching as well as the time dependent view (*actual LoS of 0 left
out).
LoS Error Occupancy Error
Scenario Mean MAE MAPE Mean MAE MAPE
Overarching
Scenario 1 0.98 2.34 134.25 42.05 42.10 21.80
Scenario 2 −0.25 2.35 134.28 −7.53 9.82 7.40*
Scenario 3 0.49 1.17 67.12 22.13 22.20 11.95
Scenario 4 −0.12 1.17 67.14 −2.68 5.78 4.04
Dependent
Scenario 1 0.98 2.34 134.25 −5.99 29.87 88.58
Scenario 2 −0.25 2.35 134.28 −13.44 28.30 89.01
Scenario 3 0.49 1.17 67.12 4.13 34.08 89.08
Scenario 4 −0.12 1.17 67.14 −2.74 31.57 89.01
7 CONCLUSION
Overall we made three major contributions in the pa-
per. First, we introduced a translation scheme from
well-researched LoS prediction to the bed occupancy
that is needed for a hospital administrator to work
with. Second, we show-cased how different improve-
ments in the state-of-the-art LoS prediction would
impact the accuracy of the bed occupancy predic-
tion and thus gave clear tasks for further research
in the machine learning community. Third, we dis-
cussed a time-depended hospital administrator view,
that showed the importance of individual information
about patients for adequately predicting a realistic bed
occupancy.
There are a couple of further research questions
that can be tackled based on this paper. One future
research direction is to include more intelligent han-
dling of the time-depended view, i.e. a better way of
including yet unknown patients based on seasonal or
other time-depended patterns. Another research di-
rection would be to validate the approach in a clinic
where patient’s LoS is recorded independently from
bed occupation. There might be effects (e.g. block-
ings, room dependencies, etc.) that lead to a more
noisy relationship between LoS and bed occupancy
than assumed in this paper which could be interesting
to research. Additionally, not only CatBoost should
be considered as a model to predict the LoS of a pa-
tient’s admission and it would be interesting to test
different models on different datasets. Many fac-
tors have a high impact on the LoS of a patient’s
admission, as shown by Winter et al. (2023), where
some are directly available in the dataset and others
are engineered from available features in the dataset.
However, some are hidden in the hospitals policies,
staffing levels, etc. which are not available in the data.
In the future, we aim to collaborate with an hospi-
tal on an interdisciplinary level, ensuring these factors
are thoroughly considered and addressed.
ACKNOWLEDGEMENTS
The research for the paper was funded by the state
of Schleswig-Holstein as part of the APONA project,
project no. 220 23 020.
REFERENCES
Baek, H., Cho, M., Kim, S., Hwang, H., Song, M., and
Yoo, S. (2018). Analysis of length of hospital stay
using electronic health records: A statistical and data
mining approach. PLOS ONE, 13(4):e0195901.
Belciug, S. and Gorunescu, F. (2015). Improving hospital
bed occupancy and resource utilization through queu-
ing modeling and evolutionary computation. Journal
of biomedical informatics, 53:261–269.
Buttigieg, S. C., Abela, L., and Pace, A. (2018). Vari-
ables affecting hospital length of stay: a scoping re-
view. Journal of Health Organization and Manage-
ment, 32(3):463–493.
Farmer, R. and Emami, J. (1990). Models for forecasting
hospital bed requirements in the acute sector. Journal
of Epidemiology & Community Health, 44(4):307–
312.
Forster, A. J., Stiell, I., Wells, G., Lee, A. J., and Van Wal-
raven, C. (2003). The effect of hospital occupancy on
emergency department length of stay and patient dis-
position. Academic Emergency Medicine, 10(2):127–
133.
Gentimis, T., Alnaser, A. J., Durante, A., Cook,
K., and Steele, R. (2017). Predicting hospital
length of stay using neural networks on MIMIC
III data. 2017 IEEE 15th Intl Conf on De-
pendable, Autonomic and Secure Computing, 15th
Intl Conf on Pervasive Intelligence and Comput-
ing, 3rd Intl Conf on Big Data Intelligence and
Computing and Cyber Science and Technology
Congress(DASC/PiCom/DataCom/CyberSciTech).
Gorunescu, F., McClean, S. I., and Millard, P. H. (2002). A
queueing model for bed-occupancy management and
planning of hospitals. Journal of the operational Re-
search society, 53:19–24.
Aggregating Predicted Individual Hospital Length of Stay to Predict Bed Occupancy for Hospitals
183

Harrison, G. (1994). Compartmental models of hospital pa-
tient occupancy patterns. Modelling hospital resource
use: a different approach to the planning and control
of health care systems, pages 53–61.
Johnson, A. E. W., Bulgarelli, L., Shen, L., Gayles, A.,
Shammout, A., Horng, S., Pollard, T. J., Hao, S.,
Moody, B., Gow, B., wei H. Lehman, L., Celi, L. A.,
and Mark, R. G. (2023). MIMIC-IV, a freely acces-
sible electronic health record dataset. Scientific Data,
10(1).
Kutafina, E., Bechtold, I., Kabino, K., and Jonas, S. M.
(2019). Recursive neural networks in hospital bed oc-
cupancy forecasting. BMC medical informatics and
decision making, 19:1–10.
Lequertier, V., Wang, T., Fondrevelle, J., Augusto, V., and
Duclos, A. (2021). Hospital length of stay predic-
tion methods: A systematic review. Medical Care,
59(10):929–938.
Mackay, M. and Lee, M. (2005). Choice of models for the
analysis and forecasting of hospital beds. Health Care
Management Science, 8:221–230.
Majeed, M. U., Williams, D. T., Pollock, R., Amir, F., Liam,
M., Foong, K. S., and Whitaker, C. J. (2012). Delay in
discharge and its impact on unnecessary hospital bed
occupancy. BMC health services research, 12(1):1–6.
Mak, G., Grant, W. D., McKenzie, J. C., and McCabe, J. B.
(2012). Physicians’ ability to predict hospital length
of stay for patients admitted to the hospital from the
emergency department. Emergency Medicine Inter-
national, 2012:1–4.
Rocheteau, E., Li
`
o, P., and Hyland, S. (2021). Temporal
pointwise convolutional networks for length of stay
prediction in the intensive care unit. Proceedings of
the Conference on Health, Inference, and Learning.
Stone, K., Zwiggelaar, R., Jones, P., and Mac Parthal
´
ain,
N. (2022). A systematic review of the prediction of
hospital length of stay: Towards a unified framework.
PLOS Digital Health, 1(4):e0000017.
Winter, A., Hartwig, M., and Kirsten, T. (2023). Pre-
dicting Hospital Length of Stay of Patients Leav-
ing the Emergency Department. In Proceedings of
the 16th International Joint Conference on Biomedi-
cal Engineering Systems and Technologies (BIOSTEC
2023) - HEALTHINF, pages 124–131. INSTICC,
SCITEPRESS - Science and Technology Publications.
HEALTHINF 2024 - 17th International Conference on Health Informatics
184
