
A Quantitative Assessment Framework for Modelling and Evaluation
Using Representation Learning in Smart Agriculture Ontology
Khadija Meghraoui
1 a
, Teeradaj Racharak
2 b
, Kenza Ait El Kadi
1,3 c
, Saloua Bensiali
4 d
and
Imane Sebari
1,3 e
1
Unit of Geospatial Technologies for a Smart Decision, Hassan II Institute of Agronomy and Veterinary Medicine, Rabat,
Morocco
2
School of Information Science, Japan Advanced Institute of Science and Technology, Ishikawa, Japan
3
School of Geomatics and Surveying Engineering, Hassan II Institute of Agronomy and Veterinary Medicine, Rabat,
Morocco
4
Department of Applied Statistics and Computer Science, Hassan II Institute of Agronomy and Veterinary Medicine, Rabat,
Morocco
Keywords:
Ontology, Ontology Embedding, Agriculture, Word Embedding, Ontology Evaluation.
Abstract:
Understanding agricultural processes and their interactions can be improved with trustworthy and precise mod-
els. Such modelling boosts various related tasks, making it easier to take informed decisions in the realm of
advanced agriculture. In our study, we present a novel agriculture ontology, primarily focusing on crop produc-
tion. Our ontology captures fundamental domain knowledge concepts and their interconnections, particularly
pertaining to key environmental factors. It encompasses static aspects like soil features, and dynamic ones such
as climatic and thermal traits. In addition, we propose a quantitative framework for evaluating the quality of the
ontology using the embeddings of all the concept names, role names, and individuals based on representation
learning (i.e. OWL2Vec*, RDF2Vec, and Word2Vec) and dimensionality reduction for visualization (i.e. t-
distributed Stochastic Neighbor Embedding). The findings validate the robustness of OWL2Vec* among other
embedding algorithms in producing precise vector representations of ontology, and also demonstrate that our
ontology has well-defined categorization aspects in conjunction of the embeddings.
1 INTRODUCTION
Historically, ontologies have been a cornerstone for
intelligent agricultural systems in terms of knowledge
modelling (Abbasi et al., 2022). Numerous agricul-
tural ontologies, such as Crop Ontology (CO) (Arnaud
et al., 2012), ARGOVOC (Rajbhandari and Keizer,
2012), Plant Ontology (PO) (Jaiswal et al., 2005), and
AgriOnt (Ngo et al., 2018) have been developed by
experts. Among these, CO stands out as an ontology
designed to represent the vocabulary associated with
various crops traits focusing on plants such as wheat,
soybean, and rice. Developed by the Food and Agri-
culture Organization (FAO), AGROVOC is a compre-
hensive thesaurus that spans various domains within
a
https://orcid.org/0000-0003-3925-0691
b
https://orcid.org/0000-0002-8823-2361
c
https://orcid.org/0000-0001-6483-3704
d
https://orcid.org/0000-0003-1753-2209
e
https://orcid.org/0000-0002-6754-8404
agriculture, covering multiple subcategories. One of
its advantages is its multilingual vocabulary, encom-
passing a wide range of concepts and terms. However,
AGROVOC is mainly an expansive vocabulary rather
than a full and a complete ontology designed for direct
applications by users. Indeed, its relational structures
lack clarity and brevity; it is more like a combination
of different vocabularies than a singular, and cohe-
sive one. On the other hand, PO acts as a structured
repository detailing plant morphology, anatomy, and
growth stages, integrating particular relationships, es-
pecially the “is-a” and “part-of” links. AgriOnt is a
prime example of a robust agricultural Knowledge-
Base (Kaewboonma et al., 2020). This ontology is
applied in various domains, such as geographical data
and the Internet of Things (IoT), addressing a large
number of practical applications. Yet, it is worth
pointing out that these ontologies omit some funda-
mental factors relevant to crop growth, and the de-
fined concepts might not be user-friendly for small-
1044
Meghraoui, K., Racharak, T., El Kadi, K., Bensiali, S. and Sebari, I.
A Quantitative Assessment Framework for Modelling and Evaluation Using Representation Learning in Smart Agr iculture Ontology.
DOI: 10.5220/0012432900003636
Paper published under CC license (CC BY-NC-ND 4.0)
In Proceedings of the 16th International Conference on Agents and Artificial Intelligence (ICAART 2024) - Volume 3, pages 1044-1051
ISBN: 978-989-758-680-4; ISSN: 2184-433X
Proceedings Copyright © 2024 by SCITEPRESS – Science and Technology Publications, Lda.

scale farmers. As a result, its main audience seems
to be researchers. For instance, (Ngo et al., 2020) de-
veloped a knowledge map model based on AgriOnt to
represent and store the insights extracted from datasets
related to crops. By analyzing these ontologies to-
wards their goals, it is evident that there is a significant
gap in the agricultural ontology, specifically focusing
on crop-related aspects. Creating a newly designed
smart agriculture ontology centered on crop yield and
related concepts agrees with (Xie et al., 2008)’s asser-
tion that every smart knowledge system should pos-
sess its own distinct ontology.
In this manuscript, we introduce a novel smart
ontology within the framework of intelligent agricul-
tural systems. We discuss the selection for its diverse
concepts, the data employed for knowledge acquisi-
tion, and the origin of this information. With this re-
spect, an existing deficiency is the lack of quantitative
framework for comprehensive and fair judgement on
the modelled ontology in an intrinsic manner. Note
that traditional ontology modelling employs extrinsic
manner with stakeholders on extrinsic tasks.
Nevertheless, there is sill no quantitative meth-
ods for evaluating the quality of ontologies. This
lack could hinder the process of ontology constric-
tion and ontology adoption in areas that lack involve-
ment of domain experts; therefore, having clear un-
derstanding on extrinsic and intrinsic approaches are
necessary and helpful. This work extends the state
of the art of representation learning for ontologies
(Asim et al., 2018) for evaluating our proposed on-
tology on three aspects: (1) the categorization as-
pect, (2) the hierarchical aspect, (3) the relational as-
pect. Indeed, our evaluation process focuses on the
embeddings of the ontological concepts, roles, and
individuals, through the utilization of OWL2Vec*,
RDF2Vec, and Word2Vec. Our intrinsic evaluation is
conducted through multiple steps, including the cal-
culation of cosine similarity metric and visualizing
it using heatmaps for several entities as well as two-
dimensional t-SNE visualization to further ensure the
aforementioned aspects of the modelled ontology.
This paper offers a significant contribution by in-
troducing a novel smart agriculture ontology. The de-
veloped ontology focuses on key elements influencing
crop yield and offers flexibility for further expansion
and integration, aiming for enhanced knowledge pre-
cision. The authors also utilizes the embeddings tech-
nique for learning representations of the agricultural
ontology, taking into account both the Assertional
Box (ABox) and the Terminological Box (TBox) el-
ements of the knowledge base. This represents a pio-
neering application of this technique within the realm
of agricultural ontologies, providing an automated ap-
proach to evaluate the newly formulated ontology,
gauging the integrity of the introduced knowledge-
base via diverse metrics and methods stemming from
the learned embeddings.
2 PRELIMINARIES
2.1 Ontology-Based Knowledge Base
Originally rooted in philosophy, the term “ontology”
was initially used to describe and explain existence
in the universe (Wei et al., 2012). However, given
the rapid advancements in information science, it has
emerged as a pivotal research area in knowledge rep-
resentation. Mathematically, ontologies are expressed
using formal structures and logical principles based on
Description Logics (DLs).
DL-based ontologies have three disjoint sets: con-
cepts, roles, and individuals, and thus form two com-
ponents of ontologies: TBox and ABox. Briefly, a
TBox (or a terminology) is a finite set of general con-
cept inclusions and role hierarchy axioms, whose syn-
tax is an expression of the form 𝐶 ⊑ 𝐷 and 𝑟 ⊑ 𝑠, re-
spectively, where 𝐶, 𝐷 are concepts and 𝑟, 𝑠 are roles.
An ABox (or assertions) is a finite set that captures
the relationships of individuals with their concepts
and the relationships between individuals themselves.
Formally, this set contains expressions of the forms
𝐶(𝑎) and 𝑟(𝑎, 𝑏), where 𝑎,𝑏 are individuals.
2.2 Agriculture Ontology
Agricultural ontologies offer farming terms and elu-
cidates their interconnections (Zheng et al., 2012).
These ontologies act as a foundation for subsequent
semantic applications (Wei et al., 2012). The goal is to
encourage the reuse, distribution, analysis, and man-
agement of knowledge in the agricultural domain.
In (Bhuyan et al., 2021), an agricultural ontology
was introduced for intelligent farming processes us-
ing a lattice framework. They also developed a rule-
based mining algorithm leveraging the features of this
structure. Their knowledge representation spanned
both spatial and temporal dimensions, and they uti-
lized cube data for orderly and sequential informa-
tion representation. Every agricultural location, its as-
sorted attributes, and multiple time markers were con-
ceptualized as a unique triple, which then populated
the lattice structure. From these agriculture-related
triples, they derived association rules to uncover new
relationships between entities. To validate their ap-
proach, a limited dataset comprising ten locations and
six characteristics spanning four time intervals was
A Quantitative Assessment Framework for Modelling and Evaluation Using Representation Learning in Smart Agriculture Ontology
1045

used. However, they did not incorporate real-world
examples and they did not explain how their knowl-
edge model could boost and enhance crop production,
a point they initially highlighted. Moreover, their pre-
sented knowledge can be better described as a knowl-
edge graph rather than a complete ontology.
In (Li et al., 2013), the authors proposed a knowl-
edge representation methodology focusing on crop
cultivation procedures. The study delves into Good
Agricultural Practices (GAP) and the foundational
theories of agricultural ontologies. Within this re-
search, the domain ontology encompasses informa-
tion on soil and agricultural equipment, while the task
ontology focuses on agricultural processes like variety
selection and determining suitable soil types. Using
pepper as their subject for tests, the authors concluded
that their proposed approach effectively offers a struc-
tured knowledge representation, making this specific
agricultural area more accessible.
In (Zheng et al., 2012), an ontology-driven agri-
cultural management framework was implemented,
consisting of the acquisition, organization, and mining
of the represented knowledge. In their study, informa-
tion about agriculture was derived from a variety of
sources, particularly plants-based food. The authors
also incorporated a data mining approach to provide
users with pertinent content by identifying their re-
quirements through comprehensive data analysis.
3 PROPOSED METHODOLOGY
FOR SMART FARMING
DEVELOPMENT
3.1 Ontology Requirements
Constructing an ontology is a crucial process that typ-
ically requires expertise and insights from specialists.
In our study, we adhered to the approach suggested by
(Xie et al., 2008) who outlined that the development of
an ontology should encompass three primary phases
as follows: (1) constructing a hierarchy tailored to the
specific domain; (2) outlining the properties and for-
mulating axioms; (3) knowledge gathering, which in-
volves populating values to the ontology.
Our specific agriculture ontology has been devel-
oped following the detailed steps:
1. Investigation of the primary factors influencing
agricultural yields.
2. Determination of concepts and the relationships
that may link those concepts.
3. Creation of a knowledge hierarchy based on the
predefined concepts and roles.
4. Development of the ontology taxonomy using an
editor interface.
5. Knowledge acquisition based on the taxonomy.
6. Validating and ensuring the consistency of the on-
tology.
Our ontology comprises four distinct categories of
factors that we believe influence crop yields. These
factors assist stakeholders in precisely managing their
fields when they have access to this knowledge. The
first category pertains to “Soil”. Soil attributes are
constant factors that have a direct impact on crop pro-
duction. Such characteristics often guide farmers in
making informed decisions for various planting sce-
narios. This can lead to enhanced crop cultivation
under suitable conditions and also aids in mitigating
losses under less favorable agricultural circumstances
(Malik et al., 2021). In our ontology, we have incor-
porated various soil attributes, which are as follows:
1. Soil bdod indicates the Bulk Density of the Dry
soil, and refers to soil compaction. It is determined
by dividing the dehydrated soil by the volume, and
expressed in cg/cm
3
(de Sousa et al., 2020).
2. Soil cec denotes the Cation Exchange Capacity by
determining the total amount of cations that can
be held by a portion of soil.
3. Soil cfvo represents the Volumetric fraction of
coarse fragments measured in cm
3
/dm
3
.
4. Soil clay identifies the proportion of clay particles
(under the 0.002 mm value) in the fine fraction.
5. Soil nitrogen measures the total amount of the ni-
trogen chemical element in the given soil.
6. Soil phh2o signifies the pH of a fraction of the
soil.
7. Soil sand indicates the proportion of sand parti-
cles (over 0.05 mm) in the fine fraction.
8. Soil silt represents the proportion of silt particles
between 0.002 mm and 0.05 mm in the fine earth.
9. Soil soc labels the Soil Organic Carbon content in
the soil.
10. Soil ocd designates the Organic Carbon Density
of a considered soil.
11. Soil ocs is another soil characteristic which mea-
sures the Organic Carbon Stocks.
The second category of environmental factors in-
cludes climatic conditions. These dynamic attributes
can directly influence crop yields. Various climatic
elements have a clear correlation with crop produc-
tion, especially factors related to droughts (Poudel and
Shaw, 2016), water stress (Wang et al., 2018), and so-
lar radiation, which impacts the rate of photosynthetic
ICAART 2024 - 16th International Conference on Agents and Artificial Intelligence
1046

activity on plant surfaces (Holzman et al., 2018). In
our ontology, we have incorporated the following cli-
matic properties:
1. Climate aet stands for Actual EvapoTranspiration,
representing the genuine evapotranspiration of the
ground cover (Li et al., 2016).
2. Climate def indicates Climatic Water Deficit, and
integrates the impact of rainfall and temperature
(Micheli et al., 2012).
3. Climate pdsi denotes Palmer Drought Severity In-
dex, which is a common marker for detecting dry-
ness (Wang et al., 2022).
4. Climate pet represents Potential Evapo-
Transpiration and denotes the potential volume of
evaporation and transpiration from a vast region
fully covered in vegetation (Li et al., 2016).
5. Climate pr denotes precipitation, a vital compo-
nent of the hydrological cycle (Zhang et al., 2022).
6. Climate ro designates the Runoff phenomenon,
that occurs when the ground can not absorb all the
existing water.
7. Climate srad indicates the Solar RADiation, a vi-
tal factor for planning and establishing agricultural
research (Ikram et al., 2022). Solar radiation en-
compasses the energy and other emissions emitted
by the Sun (Book, 2002).
8. Climate vap stands for VApor Pressure, rep-
resenting the pressure exerted by the vapor
(Schr
¨
oder et al., 2017). It is a method used to mea-
sure humidity.
9. Climate vpd stands for Vapor Pressure Deficit, a
critical factor influencing the photosynthesis pro-
cess (Yuan et al., 2019), which directly affects crop
production.
10. Climate vs represents wind speed, measured in
m/s (Terraclimate, 2020).
Another significant factor impacting crops is tem-
perature, especially the extreme lows and highs.
These temperature variations influence the metabolic
activities of plants, including cellular respiration
(Sharma et al., 2022), transpiration (Bueno et al.,
2019), and nitrogen fixation (Bytnerowicz et al.,
2022). The ontology we developed incorporates the
temporal dimension via the “year” concept. This is
essential because each agricultural yield is associated
with a specific year or farming season. Typically, the
target variable of our ontology is related to this tem-
poral aspect, emphasizing the significance of the year
class. Agricultural yields can fluctuate yearly based
on various factors, some of which have been previ-
ously highlighted and discussed.
Once the ontology taxonomy has been defined and
fixed, the next step is to populate individuals and
instances from the real world to the ontology. In
this case, the knowledge acquisition has been done
using data from the Consultative Group for Inter-
national Agricultural Research (CGIAR) (CGIAR,
2021). Transformation rules were used to populate the
created classes and properties with data. An example
of these rules is shown as follows:
Individual ∶ @𝐵
Types ∶ 𝐹 𝑖𝑒𝑙𝑑 𝐼𝐷
Facts ∶ ℎ𝑎𝑠𝑐𝑙𝑖𝑚𝑎𝑡𝑒𝑎𝑒𝑡@𝑃
(1)
This affects the values of column P, representing the
climateaet property, to the corresponding individuals
in column B, representing the Field ID.
3.2 Modeled Ontology
Following the requirements discussed in Section 3.1,
our ontology has 29 classes, including 91,672 ax-
ioms, with 76,668 of them being logical. The ontol-
ogy has been populated with approximately 14,950
individuals. Note that our modeled ontology is
available online at https://github.com/realearn-jaist/
evaluation-framework-with-agri-onto.
Figure 1 offers a comprehensive illustration of the
concepts and relationships within the developed on-
tology. Through these classes and properties, the on-
tology elucidates various factors influencing crop pro-
duction. Figure 2 provides an example of individuals
from multiple classes of the ontology and their rela-
tionships.
4 QUANTITATIVE EVALUATION
Developing new ontologies allows for the representa-
tion of real-world concepts and their interconnected
relationships. In our context, constructing an ontology
that delineates these agricultural concepts is invalu-
able. Asserting that this ontology is suitable means
that it can accurately classify the instances within
it. One technique employed for this classification in-
volves generating vectors for each instance, a method
commonly referred to as representation learning. By
visualizing these vectors, we can observe the catego-
rization based on our ontology. In contrast to extrinsic
processes that often involves humans, our evaluation
goals here focus on three aspects on the embedding
vectors: (1) the categorization aspect, (2) the hierar-
chical aspect, (3) the relational aspect.
A Quantitative Assessment Framework for Modelling and Evaluation Using Representation Learning in Smart Agriculture Ontology
1047
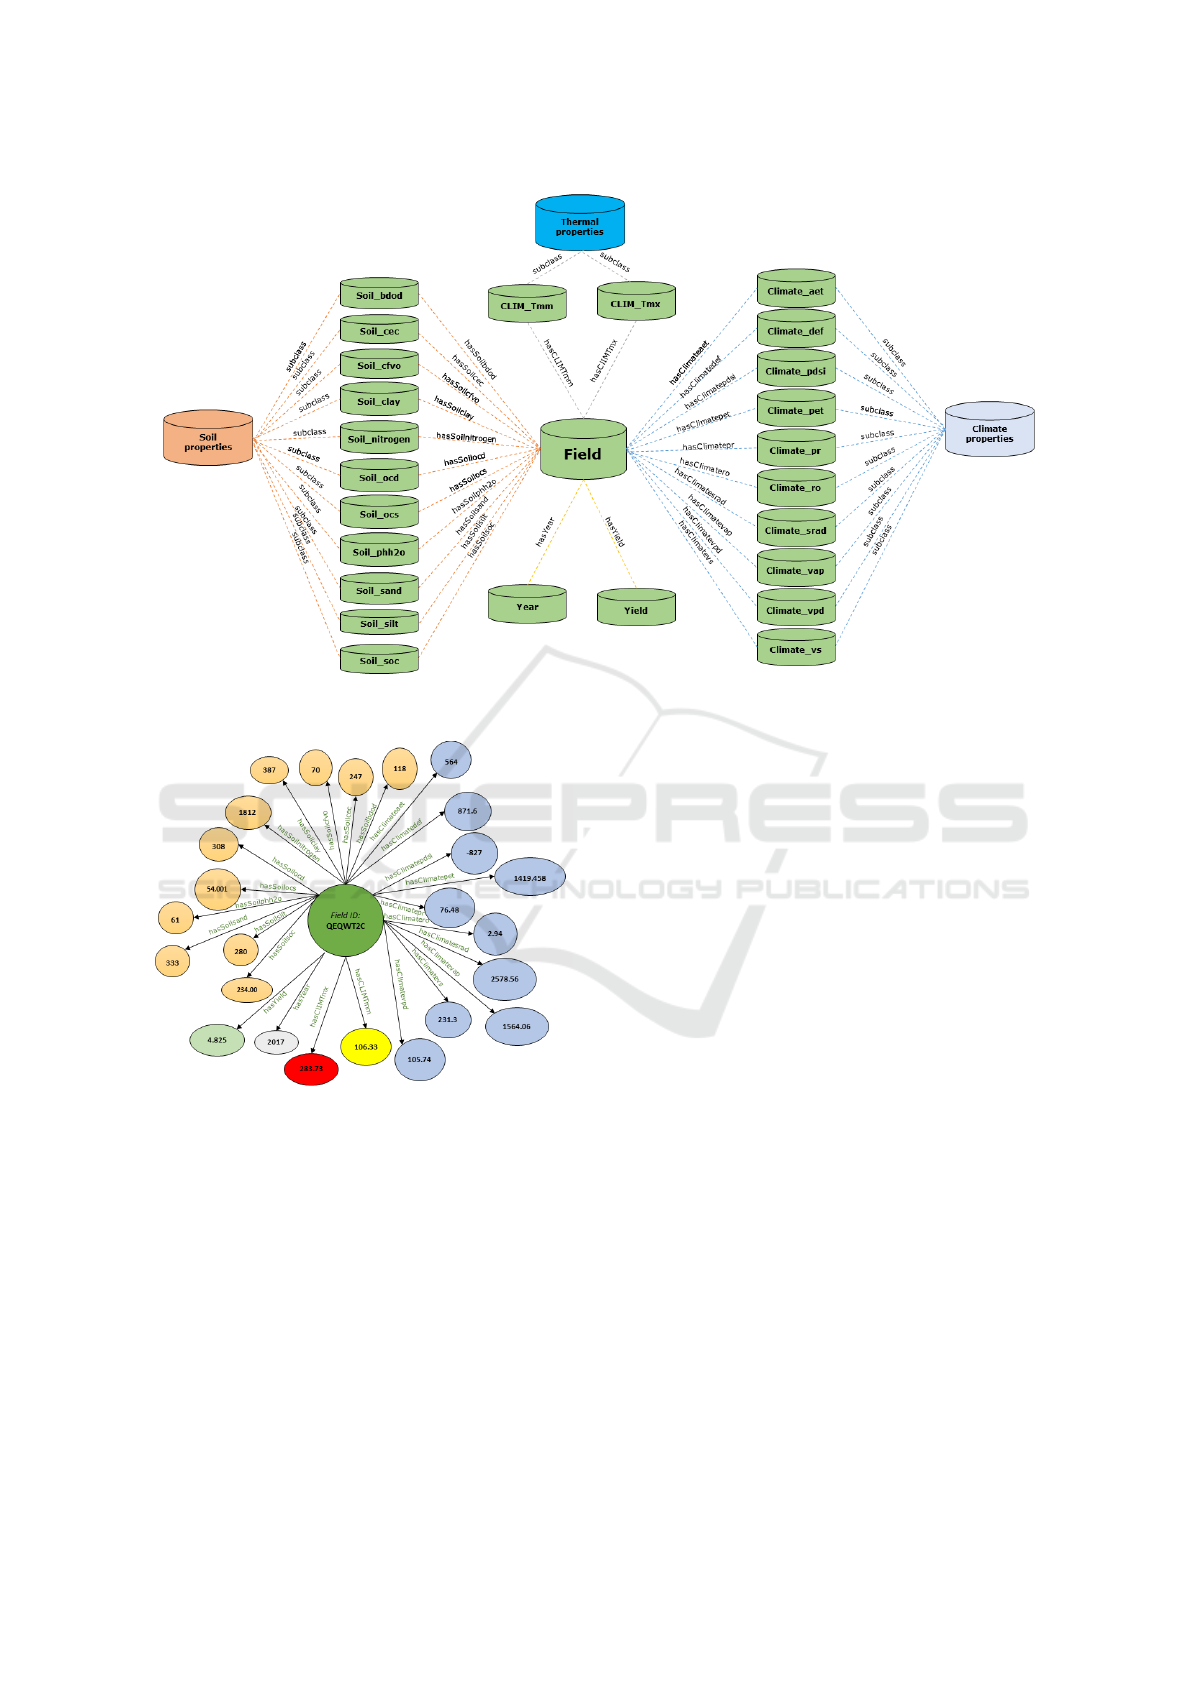
Figure 1: Detailed concepts and relationships of our created ontology.
Figure 2: Examples of individuals populated in the smart
agriculture ontology.
4.1 Vector-Based Evaluation Process
We implement OWL2Vec* proposed in (Chen et al.,
2021) to learn the embeddings of our ontology, which
takes into account both TBox and ABox. To ensure
the best representation, we also implement Word2Vec
and RDF2Vec as benchmarks, as discussed below.
One popular technique to learn these embed-
dings through artificial neural networks is Word2Vec
(Karani, 2018). Word2Vec can produce embeddings
using either the Skip Gram or Continuous Bag Of
Words (CBOW) methods. When using CBOW, a core
word is predicted using its adjacent terms. Conversely,
Skip Gram models aim to predict surrounding words
based on a given term (Onishi and Shiina, 2020).
Semantic embedding through OWL2Vec* is di-
vided into two primary stages. Initially, a corpus is
generated from the ontology (Chen et al., 2021). This
corpus is utilized to train the word embedding model.
Within OWL2Vec*, the corpus is divided into three
types of documents: structural, lexical, and a merged
version. Both the structural and lexical documents ex-
plore the ontology’s graph organization, including its
constructors and its lexical attributes and labels. The
merged document is designed to preserve potential
associations between the Internationalized Resource
Identifiers (IRIs) and other components. The model
takes an OWL file as its input and produces vector rep-
resentations for each entity and relationship within the
ontology. Several parameters can be configured, such
as the embedding dimension, the walker type, the win-
dow size, and the minimum count.
Regarding RDF2Vec, the initial step is to convert
the RDF graph into sentences using graph walks (Ris-
toski et al., 2019). These produced sequences are then
fed into a neural network model. Once trained, this
model can predict sentences and produce a vector rep-
resentation for each graph entity. Various parameters
can be also configured, such as the embedding dimen-
sion, the window size, the minimum count, and a cho-
sen embedding models (either CBOW or Skip Gram).
ICAART 2024 - 16th International Conference on Agents and Artificial Intelligence
1048

4.2 Implementation and Analysis
Our implementation utilized OWL2Vec* from the
original repository
1
. The parameters we adopted are:
‘random’ for the walker, a window size of 5, a mini-
mum count of 1, and an embedding dimension of 100.
We trained the Word2Vec model with an embed-
ding dimension of 100, a window size of 5, and a min-
imum count of 1. These identical parameters were ap-
plied to RDF2Vec after converting the graph structure
into a collection of sentences. We implemented the
three representation learning techniques in the Colab
notebook environment, using Python libraries.
We assessed our developed smart agriculture on-
tology by employing an automated evaluation method,
analyzing the embeddings produced by various tech-
niques. Before applying and using in-depth evalua-
tion methods, and for identifying any potential log-
ical inconsistencies within our ontology, we utilized
automated reasoning verification via the HermiT rea-
soner within the Prot
´
eg
´
e interface. To ensure a thor-
ough and reliable evaluation of our designed ontology,
we adopted multiple evaluation metrics. Initially, we
assessed similarity by computing the cosine similar-
ity metric. Subsequently, we employed dimension-
ality reduction, where the high-dimensional data or
the resulting embeddings are transformed into low-
dimensional points using t-SNE. The following sub-
sections give a detailed insight into these evaluation
metrics and their results.
Note that our implementation and experimen-
tal results are available online at https://github.com/
realearn-jaist/evaluation-framework-with-agri-onto.
4.2.1 Ontology Evaluation Using Cosine
Similarity Measure
For our ontology, and given the significant number of
individuals within each class, we opted to compute
the cosine similarity measure using only ten instances
from every class. Essentially, we determined the co-
sine similarity between every possible pair among
these ten instances and then took the average cosine
value from the resulting matrix as the representative
cosine similarity for that class.
In our study involving 29 classes, we calculated the
cosine similarity measure for each class and then de-
termined an average value. This facilitates a compar-
ison of our OWL2Vec* representation learning tech-
nique with other benchmark methods like Word2Vec
and RDF2Vec. Table 1 and 2 present the average
cosine similarity values for these three techniques.
Specifically, they show values for individuals within
1
https://github.com/KRR-Oxford/OWL2Vec-Star
Table 1: Similarity between individuals of the same class.
Embedding method Cosine similarity
OWL2Vec* 0.817
Word2Vec 0.672
RDF2Vec 0.942
Table 2: Similarity between individuals of different classes.
Embedding method Cosine similarity
OWL2Vec* 0.655
Word2Vec 0.601
RDF2Vec 0.901
the same class and for those from different classes,
termed as negative sampling. For instances belong-
ing to the same class, OWL2Vec* and RDF2Vec re-
ported high similarity values of 0.817 and 0.942, re-
spectively. Conversely, Word2Vec had a lower sim-
ilarity score of 0.672. When assessing individuals
from different classes, a decrease in cosine similarity
was observed, with this decline being particularly ev-
ident in OWL2Vec* and Word2Vec.
To better understand the computed cosine simi-
larity, we have visualized the representations using
heatmaps, primarily for individuals within the same
class. As depicted in Figures 3 it becomes evident
that OWL2Vec* effectively distinguished between in-
dividuals from different classes while capturing their
inherent similarities. This distinction is further high-
lighted in the diagonal heatmap of Figure 3, as it shows
a darker colour. In contrast, RDF2Vec produced vec-
tors that were remarkably similar despite having dis-
tinct properties. Word2Vec exhibited moderate dif-
ferentiation. Due to the space limitation, we provide
more displayed figures in our GitHub repository to
support the above explanation.
4.2.2 Ontology Evaluation Using t-SNE
Visualization
Not only similarity-based evaluation, we also per-
formed visualization to see through the characteristics
of modeled ontology. To this aim, we used t-SNE to
assess the ontology we developed, by visualizing the
vector representations derived from the three ontology
embedding techniques.
Figure 4 clearly shows that OWL2Vec* adeptly
clustered similar instances and entities. Due to
the space limitation, we show more detailed images
within our GitHub repository. Indeed, RDF2Vec
failed to distinguish between distinct classes, indi-
cated by the almost singular central cluster. Word2Vec
showed only slight separations with a more dispersed
visual representation.
A Quantitative Assessment Framework for Modelling and Evaluation Using Representation Learning in Smart Agriculture Ontology
1049
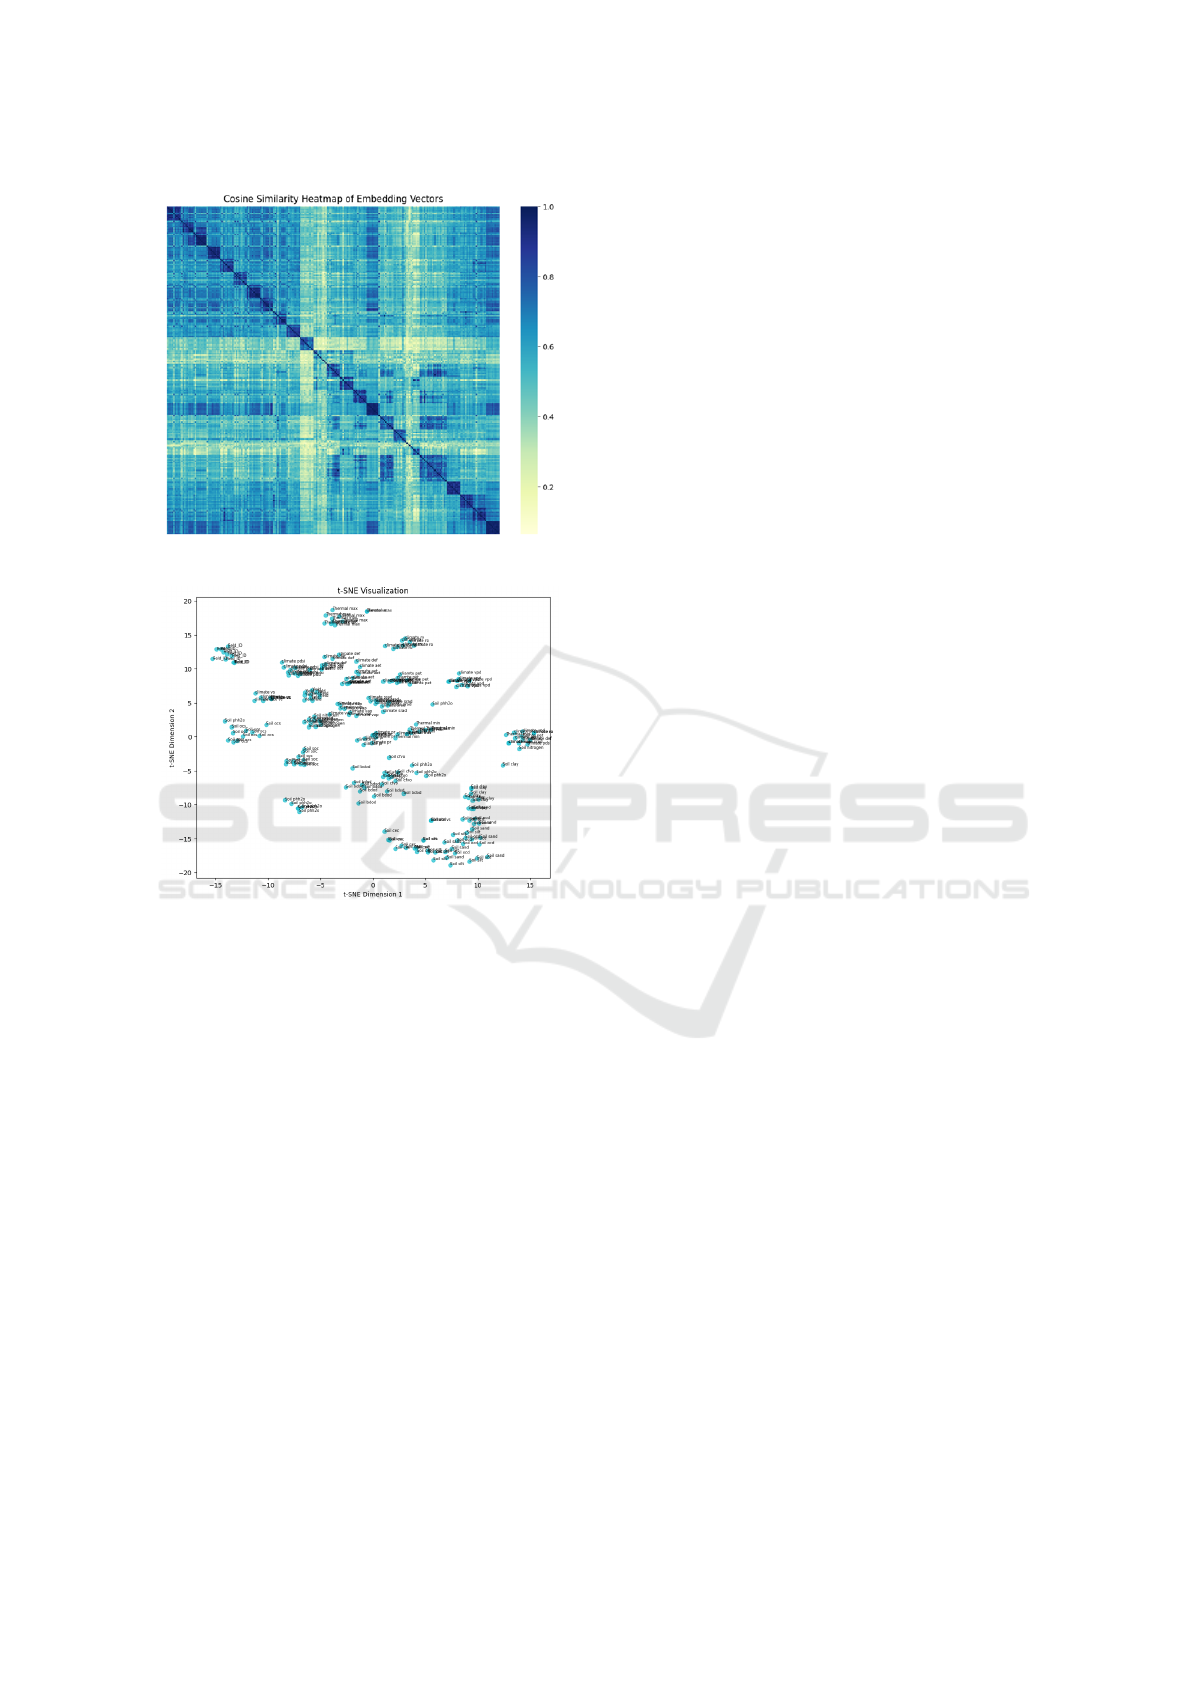
Figure 3: Cosine similarity heatmap using OWL2Vec*.
Figure 4: t-SNE visualization for OWL2Vec*.
5 CONCLUSIONS
This paper introduces a novel agricultural ontology
centered on crop production and its primary influenc-
ing environmental factors. Our representation learn-
ing framework leverages both the ABox and TBox
components of the knowledge base. We benchmarked
our approach against two well-established baselines:
Word2Vec and RDF2Vec. The results confirm that
our ontology learning method offers enhanced vector
representations. We also propose a framework to eval-
uate the developed agricultural ontology using the co-
sine similarity measure among various classes which
further employ the t-SNE visualization method for a
more detailed assessment of our ontology.
In future, we aim to utilize the learned embeddings
for advanced agricultural applications, especially in
predicting crop yields. We plan to extend our intrinsic
assessment process as a general framework for ontol-
ogy modelling (cf. (Alshargi et al., 2018)).
ACKNOWLEDGEMENTS
The authors would like to extend their appreciation
to the anonymous reviewers for their valuable feed-
back. This research was conducted during an intern-
ship at Japan Advanced Institute of Science and Tech-
nology (JAIST) in collaboration with the Department
of Photogrammetry and Cartography of IAV Hassan
II in Morocco. This work was also supported by JSPS
KAKENHI Grant Number JP22K18004.
REFERENCES
Abbasi, R., Martinez, P., and Ahmad, R. (2022). An on-
tology model to represent aquaponics 4.0 system’s
knowledge. Information Processing in Agriculture,
9(4):514–532.
Alshargi, F., Shekarpour, S., Soru, T., and Sheth, A. P.
(2018). Metrics for evaluating quality of embeddings
for ontological concepts.
Arnaud, E., Cooper, L., Shrestha, R., Menda, N., Nelson,
R. T., Matteis, L., Skofic, M., Bastow, R., Jaiswal, P.,
Mueller, L. A., et al. (2012). Towards a reference plant
trait ontology for modeling knowledge of plant traits
and phenotypes. In KEOD, pages 220–225.
Asim, M. N., Wasim, M., Khan, M. U. G., Mahmood,
W., and Abbasi, H. M. (2018). A survey of ontol-
ogy learning techniques and applications. Database,
2018:bay101.
Bhuyan, B. P., Tomar, R., Gupta, M., and Ramdane-Cherif,
A. (2021). An ontological knowledge representation
for smart agriculture. In 2021 IEEE International Con-
ference on Big Data (Big Data), pages 3400–3406.
IEEE.
Book, T. (2002). Solar water heating and the plant engineer.
In Plant Engineer’s Reference Book, pages 42–1. El-
sevier.
Bueno, A., Alfarhan, A., Arand, K., Burghardt, M.,
Deininger, A.-C., Hedrich, R., Leide, J., Seufert,
P., Staiger, S., and Riederer, M. (2019). Effects
of temperature on the cuticular transpiration barrier
of two desert plants with water-spender and water-
saver strategies. Journal of Experimental Botany,
70(5):1613–1625.
Bytnerowicz, T. A., Akana, P. R., Griffin, K. L., and Menge,
D. N. (2022). Temperature sensitivity of woody nitro-
gen fixation across species and growing temperatures.
Nature Plants, 8(3):209–216.
CGIAR (2021). https://zindi.africa/competitions/
cgiar-crop-yield-prediction-challenge/data. Ac-
cessed on August 30, 2023.
Chen, J., Hu, P., Jimenez-Ruiz, E., Holter, O. M., Antonyra-
jah, D., and Horrocks, I. (2021). Owl2vec*: Em-
bedding of owl ontologies. Machine Learning,
110(7):1813–1845.
de Sousa, L. M., Poggio, L., Batjes, N. H., Heuvelink, G. B.,
Kempen, B., Riberio, E., and Rossiter, D. (2020). Soil-
ICAART 2024 - 16th International Conference on Agents and Artificial Intelligence
1050

grids 2.0: producing quality-assessed soil information
for the globe. Soil Discuss, 2020:1–37.
Holzman, M. E., Carmona, F., Rivas, R., and Nicl
`
os, R.
(2018). Early assessment of crop yield from re-
motely sensed water stress and solar radiation data. IS-
PRS journal of photogrammetry and remote sensing,
145:297–308.
Ikram, R. M. A., Dai, H.-L., Ewees, A. A., Shiri, J., Kisi,
O., and Zounemat-Kermani, M. (2022). Application
of improved version of multi verse optimizer algo-
rithm for modeling solar radiation. Energy Reports,
8:12063–12080.
Jaiswal, P., Avraham, S., Ilic, K., Kellogg, E. A., McCouch,
S., Pujar, A., Reiser, L., Rhee, S. Y., Sachs, M. M.,
Schaeffer, M., et al. (2005). Plant ontology (po): a
controlled vocabulary of plant structures and growth
stages. Comparative and functional genomics, 6(7-
8):388–397.
Kaewboonma, N., Chansanam, W., and Buranarach, M.
(2020). Ontology-based big data analysis for orchid
smart farming. LIBRES: Library & In-formation Sci-
ence Research Electronic Journal, 29:292–296.
Karani, D. (2018). Introduction to word embedding and
word2vec. Towards Data Science, 1.
Li, D., Kang, L., Cheng, X., Li, D., Ji, L., Wang, K., and
Chen, Y. (2013). An ontology-based knowledge rep-
resentation and implement method for crop cultiva-
tion standard. Mathematical and computer modelling,
58(3-4):466–473.
Li, S., Kang, S., Zhang, L., Zhang, J., Du, T., Tong, L., and
Ding, R. (2016). Evaluation of six potential evapo-
transpiration models for estimating crop potential and
actual evapotranspiration in arid regions. Journal of
Hydrology, 543:450–461.
Malik, P., Sengupta, S., and Jadon, J. S. (2021). Com-
parative analysis of soil properties to predict fertility
and crop yield using machine learning algorithms. In
2021 11th International Conference on Cloud Com-
puting, Data Science & Engineering (Confluence),
pages 1004–1007. IEEE.
Micheli, E., Flint, L., Flint, A., Weiss, S., and Kennedy, M.
(2012). Downscaling future climate projections to the
watershed scale: A north san francisco bay case study.
San Francisco Estuary and Watershed Science, 10(4).
Ngo, Q. H., Kechadi, T., and Le-Khac, N.-A. (2020).
Oak: ontology-based knowledge map model for digi-
tal agriculture. In Future Data and Security Engineer-
ing: 7th International Conference, FDSE 2020, Quy
Nhon, Vietnam, November 25–27, 2020, Proceedings
7, pages 245–259. Springer.
Ngo, Q. H., Le-Khac, N.-A., and Kechadi, T. (2018). Ontol-
ogy based approach for precision agriculture. In Multi-
disciplinary Trends in Artificial Intelligence: 12th In-
ternational Conference, MIWAI 2018, Hanoi, Viet-
nam, November 18–20, 2018, Proceedings 12, pages
175–186. Springer.
Onishi, T. and Shiina, H. (2020). Distributed representation
computation using cbow model and skip–gram model.
In 2020 9th International Congress on Advanced Ap-
plied Informatics (IIAI-AAI), pages 845–846. IEEE.
Poudel, S. and Shaw, R. (2016). The relationships between
climate variability and crop yield in a mountainous en-
vironment: A case study in lamjung district, nepal.
Climate, 4(1):13.
Rajbhandari, S. and Keizer, J. (2012). The agrovoc concept
scheme–a walkthrough. Journal of Integrative Agri-
culture, 11(5):694–699.
Ristoski, P., Rosati, J., Di Noia, T., De Leone, R., and Paul-
heim, H. (2019). Rdf2vec: Rdf graph embeddings and
their applications. Semantic Web, 10(4):721–752.
Schr
¨
oder, M., Lockhoff, M., Shi, L., August, T., Bennartz,
R., Borbas, E., Brogniez, H., Calbet, X., Crewell, S.,
Eikenberg, S., et al. (2017). Gewex water vapor as-
sessment (g-vap), wcrp report 16/2017, world climate
research programme (wcrp): Geneva, switzerland, 216
pp.
Sharma, N., Thakur, M., Suryakumar, P., Mukherjee, P.,
Raza, A., Prakash, C. S., and Anand, A. (2022).
‘breathing out’under heat stress—respiratory control
of crop yield under high temperature. Agronomy,
12(4):806.
Terraclimate (2020). https://www.climatologylab.org. Ac-
cessed on September 23, 2023.
Wang, J., Vanga, S. K., Saxena, R., Orsat, V., and Raghavan,
V. (2018). Effect of climate change on the yield of
cereal crops: A review. Climate, 6(2):41.
Wang, Z., Yang, Y., Zhang, C., Guo, H., and Hou, Y. (2022).
Historical and future palmer drought severity index
with improved hydrological modeling. Journal of Hy-
drology, 610:127941.
Wei, Y.-y., Wang, R.-j., Hu, Y.-m., and Xue, W. (2012).
From web resources to agricultural ontology: a
method for semi-automatic construction. Journal of
Integrative Agriculture, 11(5):775–783.
Xie, N., Wang, W., and Yang, Y. (2008). Ontology-based
agricultural knowledge acquisition and application. In
Computer And Computing Technologies In Agricul-
ture, Volume I: First IFIP TC 12 International Con-
ference on Computer and Computing Technologies in
Agriculture (CCTA 2007), Wuyishan, China, August
18-20, 2007 1, pages 349–357. Springer.
Yuan, W., Zheng, Y., Piao, S., Ciais, P., Lombardozzi, D.,
Wang, Y., Ryu, Y., Chen, G., Dong, W., Hu, Z., et al.
(2019). Increased atmospheric vapor pressure deficit
reduces global vegetation growth. Science advances,
5(8):eaax1396.
Zhang, Y., Wu, C., Yeh, P. J.-F., Li, J., Hu, B. X., Feng,
P., and Jun, C. (2022). Evaluation and comparison of
precipitation estimates and hydrologic utility of chirps,
trmm 3b42 v7 and persiann-cdr products in various cli-
mate regimes. Atmospheric Research, 265:105881.
Zheng, Y.-L., He, Q.-Y., Ping, Q., and Ze, L. (2012). Con-
struction of the ontology-based agricultural knowl-
edge management system. Journal of Integrative Agri-
culture, 11(5):700–709.
A Quantitative Assessment Framework for Modelling and Evaluation Using Representation Learning in Smart Agriculture Ontology
1051
