
Evaluating the Performance of Protein Structure Prediction in Detecting
Structural Changes of Pathogenic Nonsynonymous Single Nucleotide
Variants
Hong-Sheng Lai
1,2
and Chien-Yu Chen
1,2 a
1
Department of Biomechtronics Engineering, National Taiwan University, No.1, Sec. 4, Roosevelt Road, Taipei, Taiwan
2
Taiwan AI Labs, No. 70, Sec. 1, Chengde Rd., Datong Dist., Taipei City, Taiwan
Keywords:
Protein Structure Prediction, Nonsynonymous Single Nucleotide Variants.
Abstract:
Protein structure prediction serves as an efficient tool, saving time and circumventing the need for laborious
experimental endeavors. Distinguished methodologies, including AlphaFold, RoseTTAFold, and ESMFold,
have proven their precision through rigorous evaluation in the last Critical Assessment of Protein Structure
Prediction (CASP14). The success of protein structure prediction raises the following question: Can the
prediction tools discern structural alterations resulting from single amino acid changes? In this regard, the
objective of this study is to assess the performance of existing structure prediction tools on mutated sequences.
In this study, we posited that a specific fraction of the pathogenic nonsynonymous single nucleotide variants
(nsSNVs) would experience structural alterations following amino acid mutations. We meticulously assem-
bled an extensive dataset by initially sourcing data from ClinVar and subsequently applying multiple filters,
resulting in 2,371 pathogenic nsSNVs. Utilizing UniProt, we acquired reference sequences and generated
the corresponding alternative sequences based on variant information. This study performed three tools of
structure prediction on both the reference and alternative sequences and expected some structural changes
upon mutations. Our findings affirm AlphaFold as the foremost prediction tool presently; nonetheless, our
experimental results underscore persistent challenges in accurately predicting structural alterations induced by
nonsynonymous SNVs. Discrepancies in predicted structures, when observed, often stem from a lack of confi-
dence in the predictions or the spatial separation between compact domains interrupted by disordered regions,
posing challenges to successful alignment. The findings from this study highlight the ongoing challenges in
accurately predicting the structure of mutated sequences. To enhance the refinement of prediction models,
there is a clear need for additional experimentally determined structures of proteins with nsSNVs in the future.
1 INTRODUCTION
Protein structure prediction is the endeavor to an-
ticipate the three-dimensional structure of a protein
based on its amino acid sequence. This pursuit
holds paramount importance in bioinformatics and
genomics, bearing substantial implications for med-
ical applications, including drug design and biotech-
nological applications (Kuhlman and Bradley, 2019).
In the current era dominated by deep learning, there
has been a noteworthy enhancement in prediction ac-
curacy. An increasing array of models has been de-
ployed in real-world studies, marking a significant ad-
vancement in the field.
Every two years, the performance of protein
a
https://orcid.org/0000-0002-6940-6389
structure prediction tools is evaluated through Crit-
ical Assessment of Protein Structure Prediction
(CASP) (Kryshtafovych et al., 2021). In 2020, a
ground-breaking protein structure prediction tool, Al-
phaFold2 (Jumper et al., 2021), developed by the
Google DeepMind team, achieved remarkable suc-
cess, obtaining a score of 92.4 out of 100 in CASP14,
a substantial leap from the previous accuracy levels of
around 40 out of 100. Similarly, within the same year,
the RoseTTAFold (Baek et al., 2021) tool developed
by David Baker’s team from the University of Wash-
ington achieved lower yet comparable predictive per-
formance using a smaller dataset and faster prediction
times. Both tools employ multiple sequence align-
ment (MSA), searching for homologous sequences in
databases for reference. Following identifying similar
sequences, an attention model is employed to predict
Lai, H. and Chen, C.
Evaluating the Performance of Protein Structure Prediction in Detecting Structural Changes of Pathogenic Nonsynonymous Single Nucleotide Variants.
DOI: 10.5220/0012431600003657
Paper published under CC license (CC BY-NC-ND 4.0)
In Proceedings of the 17th International Joint Conference on Biomedical Engineering Systems and Technologies (BIOSTEC 2024) - Volume 1, pages 495-503
ISBN: 978-989-758-688-0; ISSN: 2184-4305
Proceedings Copyright © 2024 by SCITEPRESS – Science and Technology Publications, Lda.
495

the three-dimensional protein structure, followed by
refinement based on the atomic chemical properties.
Moreover, in 2022, ESMFold (Lin et al., 2023), devel-
oped by Meta AI, demonstrated the ability to directly
infer the protein structure from the primary sequence
using an up to 15 billion parameters large language
model (LLM). ESMFold accelerated at least six times
more than AlphaFold2 in the AI inference phase, en-
abling the construction of a large-scale metagenomics
protein data bank. All the generated protein struc-
tures from the previously mentioned protein structure
prediction tools claim high similarity to actual pro-
tein structures, achieving accuracy at the atomic level,
thereby aiding in the further determination of the ac-
tual function of the protein structure.
When a DNA sequence changes a single nu-
cleotide—represented by the nucleotides A, T, C, or
G—a single nucleotide variant (SNV) emerges, con-
stituting the most prevalent type of sequence varia-
tion. Among SNVs, synonymous changes maintain
the amino acid sequence unaltered, whereas nonsyn-
onymous single nucleotide variants (nsSNVs) intro-
duce modifications to the amino acid sequence, con-
sequently impacting the protein’s functionality (Has-
san et al., 2019). However, elucidating the influence
of nsSNVs on protein function proves challenging
in clinical studies (Iqbal et al., 2020). Even being
annotated as pathogenic variants, the actual impact
of nsSNVs on protein folding, binding, expression,
and other protein features remains uncertain and ne-
cessitates further investigation (Gerasimavicius et al.,
2022).
In contemporary research, the predominant focus
has been predicting the pathogenicity or thermody-
namic free energy of nsSNVs rather than their struc-
tural changes (Pak et al., 2023). Prior to the emer-
gence of AlphaFold2, the confidence in protein struc-
ture prediction results was insufficient. So, when pre-
dictive data was available, it held limited value for
further discussions (Ittisoponpisan et al., 2019). With
the advent of various high-precision prediction mod-
els, some studies employed protein structure predic-
tion tools to investigate nsSNVs from only under 30
genes for analysis (Keskin Karakoyun et al., 2023).
On the other hand, some studies asserted the inabil-
ity to predict non-wildtype sequences through struc-
tural prediction tools, yet lacking substantial evidence
and experiments about the claim (Perrakis and Sixma,
2021).
In this study, we compiled a comprehensive
pathogenic nsSNVs dataset. With the hypothesis that
a specific fraction of the pathogenic nsSNVs would
experience structural alterations following amino acid
mutations, we expected to observe some structural
changes on mutated sequences against the reference
sequences. Three tools are employed in this study:
AlphaFold, RoseTTAFold, and ESMFold. Through
the profound impact of protein structure prediction
tools on the scientific community, this study aspires to
apply these tools to the context of pathogenic variants,
aiming to enhance our understanding of the functional
consequences of nsSNVs.
2 METHODS
2.1 Dataset
We selected nsSNVs from the ClinVar (Landrum
et al., 2017), an open and accessible repository con-
taining records detailing the connections between hu-
man genetic variations and observed health status.
Pathogenicity classification includes five categories:
Pathogenic, likely pathogenic, uncertain, likely be-
nign, and benign. We have chosen to focus on the
”Pathogenic” category for discussion and ensure the
nsSNVs are from multiple submitters. In this step,
we selected 4,281 variants (Figure 1).
Subsequently, we applied a filtered-based anno-
tation database in ANNOVAR (Wang et al., 2010)
to functionally annotate genetic variants. Two kinds
of filtering were undertaken to ensure the variants’
impact on structural changes and the conservation
of these variants. To select the variants with possi-
ble impact on structural changes, we selected SIFT
(Ng and Henikoff, 2003), Polyphen2 HDIV, and
Polyphen2 HVAR (Adzhubei et al., 2010). On the
other hand, to retain high conservation variants, we
selected GERP++ score (Davydov et al., 2010). For
Polyphen2, the HDIV score was selected to assess
rare alleles at potentially implicated loci in complex
phenotypes, dense mapping of regions identified by
genome-wide association studies, and the analysis of
natural selection using sequence data. Variants with
a score ≥ 0.957 were considered. Additionally, we
employed the HVAR score, which aims to distinguish
mutations with significant effects from the broader
spectrum of human variation, encompassing mildly
deleterious alleles. Variants with a score ≥ 0.909
were chosen. Regarding SIFT, we utilized a thresh-
old of score ≤ 0.05 to identify nsSNVs predicted to
be deleterious. All selection criteria were derived
from thresholds provided in the relevant literature,
and these scores were tied to evaluations of protein
structural impact on determining deleteriousness. We
understand that Polyphen2 and SIFT scores are not
among the top-performing indicators in pathogenicity
score prediction now. However, these scores have a
BIOINFORMATICS 2024 - 15th International Conference on Bioinformatics Models, Methods and Algorithms
496

Figure 1: Flow chart of obtaining pathogenic nsSNVs,
experimental structures in PDB format, and reference se-
quences.
more direct relationship with structural variations in
their training stage than other top-performing ensem-
ble models. Next, variants with GERP++ scores ≥
4 are kept. Generally, the higher the score, the more
conserved the site, while the overall scores range from
-12.3 to 6.17. Eventually, we obtained 2,371 variants
characterized by high conservation and a strong cor-
relation with structural variations (Figure 1).
After these filtering steps, we identified refer-
ence sequences in Universal Protein Knowledgebase
(UniProt) (Apweiler et al., 2004) for the selected vari-
ants and opted for source files with contributions from
multiple submitters. To enable further comparisons,
we retained reference sequences with correspond-
ing experimentally determined structure entries for
the Protein Data Bank (PDB) (Berman et al., 2000).
Considering computational efficiency, we chose se-
quences with shorter than 1,000 amino acids as the
final dataset. We eventually found 299 reference se-
quences and created 967 alternative sequences based
on the variant details (Figure 1). The same refer-
ence sequence may correspond to different variant se-
quences of nucleic acids. Three of the 967 variant
sequences are attributed to start-loss mutations. Due
to the uncertainty regarding the meaning of their se-
quences, these particular mutations were excluded.
Additionally, certain entries corresponding to PDB
were not considered due to their unavailability for
download.
2.2 Multiple Sequence Alignment for
Experiment Data
For each reference sequence, multiple corresponding
PDB entries might exist. To determine which en-
tries are the most similar to the reference protein se-
quences, we used ClustalW (Thompson et al., 1994)
to perform MSA. Firstly, we used DBREF records
from the PDB files to identify if the reference was
from the same UniProt reference. We then extracted
the SEQRES records from these files, representing
the sequences researchers intended to observe through
experimental methods. We also extracted the ATOM
records from the files, representing the actual ob-
served protein structures, and converted them into se-
quences for further comparison. We aimed to ensure
only one reference structure source in the PDB file
and a single protein structure. This assertion helped
us guarantee that our protein structure alignment in
the subsequent steps remained undisturbed by other
factors. By comparing these extracted sequences with
the wild-type sequences from UniProt, we identified
the experimentally determined structures most closely
aligned with the sequences we wanted to compare by
similarity score.
2.3 Protein Structure Prediction
Protein structure prediction has three stages: se-
quence representation generation, artificial intelli-
gence inference, and protein structure relaxation (Fig-
ure 2). Among the three tools we are comparing -
AlphaFold, RoseTTAFold, and ESMFold - the most
significant divergence lies in sequence representa-
tion generation. AlphaFold utilizes MSA to gener-
ate homologous sequences, whereas RoseTTAFold
employs cropped MSA, significantly reducing time
but compromising accuracy. ESMFold, on the other
hand, employs a 15-billion-parameter LLM as a pre-
trained model. It transforms the amino acid sequence
into a one-dimensional vector, followed by AI infer-
ence and relaxation stages identical to AlphaFold.
In this study, to assess the impact of MSA on
AlphaFold, we also ran AlphaFold without utilizing
MSA as input, considering only the reference se-
quence. We also investigated whether the MSA depth
in AlphaFold affects the confidence region scores -
the pLDDT score. Herein, pLDDT ≥ 90 corresponds
to high confidence, 90 > pLDDT ≥ 70 indicates con-
fidence, 70 > pLDDT ≥ 50 implies low confidence,
and pLDDT < 50 corresponds to very low confidence.
Very low-confidence predictions are often associated
with intrinsically disordered proteins.
We ran AlphaFold v2.3.1, RoseTTAFold v1.1.0,
Evaluating the Performance of Protein Structure Prediction in Detecting Structural Changes of Pathogenic Nonsynonymous Single
Nucleotide Variants
497

and ESMFold from ESM v2.0.0 using 1 Tesla V100
GPU (32GB VRAM), 6 CPU, 90 GB memory for
each sequence-to-structure prediction.
2.4 Protein Structure Alignment
TM-align (Zhang and Skolnick, 2005) is an algorithm
employed for the optimal structural alignment of pro-
teins. The outcomes of TM-align encompass three
intuitive pieces of information: Template modeling
score (TM-score) (Zhang and Skolnick, 2004), Root
Mean Square Difference (RMSD) (Carugo and Pon-
gor, 2001), and alignment length. The primary as-
sessment criterion in this study is TM-score, supple-
mented by RMSD.
The main drawback of RMSD is its susceptibility
to strong fragment errors. Additionally, RMSD is in-
fluenced by the length of alignment (L
aligned
), making
it an unsuitable metric for variable length or global
protein sequence alignments.
This issue might not be apparent when comparing
predicted reference structures with alternative struc-
tures, as we can ensure that the lengths of the two
structures are equal. However, when contrasting a
reference structure with an experimental structure, we
cannot guarantee the alignment of the lengths on both
sides.
The TM-score aims to address the limitations of
RMSD perform global assessment analysis, and en-
able comparison among protein models of varying
amino acid lengths. It can be told from the equation
that this is a normalized formula based on experimen-
tal results. Due to the adjustments, the dependency on
protein length represented by L
target
is reduced, and
the equation is:
TM-score = max
1
L
target
L
aligned
∑
i=1
1
1 +
D
i
D
0
(L
target
)
2
Moreover, because of the globally evaluative nature
of TM-score, it establishes a rational method for nu-
merical comparison. This aspect is a crucial indica-
tor in this research project. When the score is be-
low 0.2, it is equivalent to aligning two randomly
unrelated proteins, while a score exceeding 0.5 indi-
cates a certain degree of similarity between the two
structures with analogous three-dimensional folding
arrangements. We utilized these two thresholds as
the demarcation criteria for assessing alignment ef-
fectiveness in this study.
Normalization is conducted based on the exper-
imental structure when comparing the experiment-
generated structure. On the other hand, if the compar-
ison involves a reference structure and an alternative
structure, normalization is conducted with respect to
the reference structure.
3 RESULTS
3.1 Prediction Analysis
In Figure 3, we observed the execution time required
for reference sequences by the three tools. Due to
the fast processing time of ESMFold, it is not vis-
ible using second as the time scale. In this regard,
the plot is represented using logarithmic time. Across
all prediction tools, the time required follows the or-
der Alphafold > RoseTTAFold > ESMFold in all
cases. The absence of colored segments indicates
instances where the prediction tool failed to deter-
mine the protein structure. ESMFold, given its uti-
lization of sequence representation generated by lan-
guage models, can predict structures as long as there
is sufficient memory. Its practical limit is approx-
imately 850 amino acids (in 32G VRAM devices).
RoseTTAFold primarily encounters memory-related
issues, either due to the maximum matching number
constraints on the MSA or inadequate AI inference
memory. In the original version of AlphaFold, struc-
tural prediction failures were not observed; instead,
longer sequences resulted in exponential execution
time without forced termination due to memory con-
straints. However, in the latest version (v2.3.1), early
termination may occur during the sequence represen-
tation stage due to MSA tool-related issues. We also
compared AlphaFold without MSA to the original Al-
phaFold. Figure 3(b) shows that the MSA version sig-
nificantly reduces the time required, indicating that a
substantial portion of the processing time is spent on
MSA computation. Additionally, we observed from
ESMFold and AlphaFold that without MSA, AI infer-
ence time is highly correlated with sequence length,
the primary source of time uncertainty.
Regarding AlphaFold, we aimed to delve into the
details of MSA. We have observed a high similarity
between the MSA of reference sequences and their
corresponding variant sequences. To be more precise,
we found that in 403 instances, the MSA depth of
reference sequences is smaller than the MSA depth
of variant sequences. In contrast, in 543 cases, the
MSA depth of variant sequences is smaller than that
of their corresponding reference sequences. Addi-
tionally, there was one instance where the MSAs were
entirely identical. Furthermore, it was noteworthy
that all the MSAs with smaller depths were entirely
contained within the larger MSAs. This indicated that
single nucleotide variations had minimal impact on
BIOINFORMATICS 2024 - 15th International Conference on Bioinformatics Models, Methods and Algorithms
498
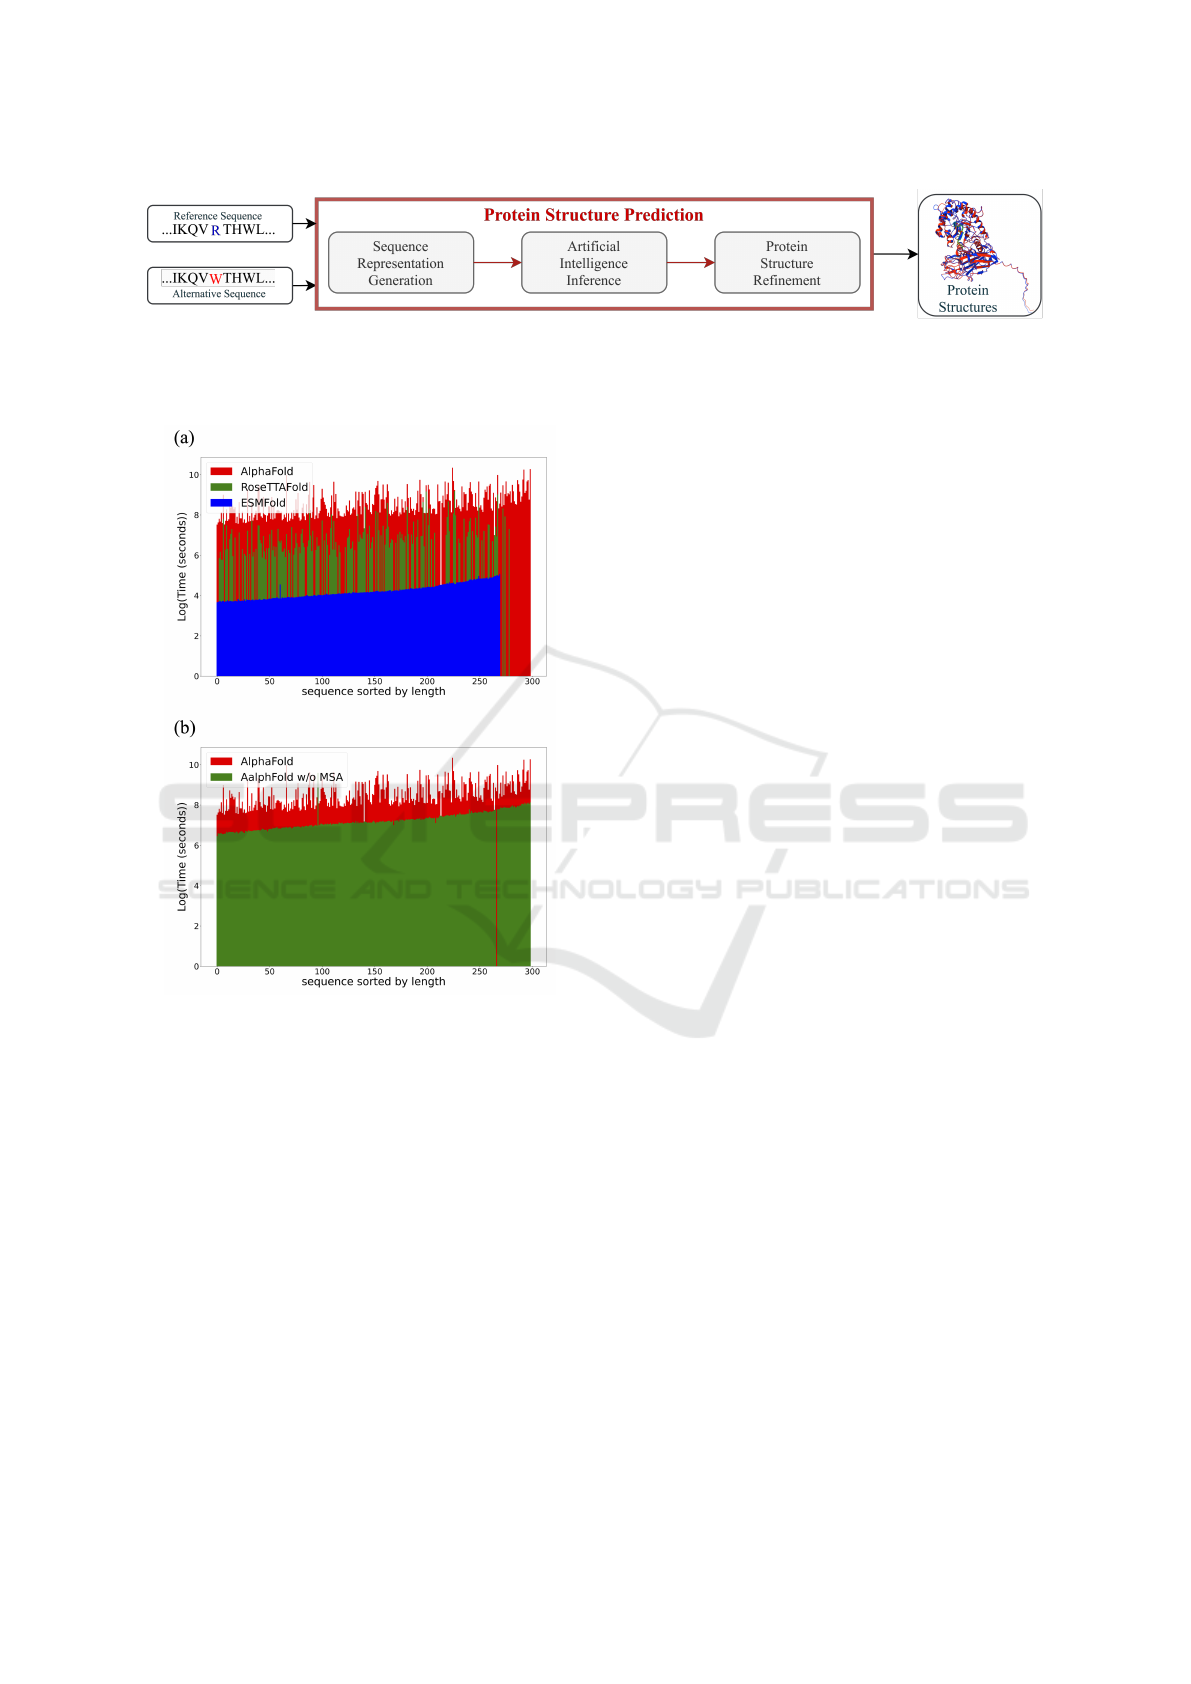
Figure 2: Protein Structure Prediction Pipeline. The blue amino acid represents the position in the reference sequence where
variation occurs, while the red amino acid indicates the mutated amino acid. The example predicted protein structures are
after protein structure alignment. The blue structure represents the result predicted based on the reference sequence, while the
red structure represents the results predicted based on the variant sequence.
Figure 3: Time analysis for three protein structure predic-
tion tools. (a) The disappeared bars in the graph represent
cases where the prediction tool failed to predict success-
fully. Among them, ESMFold could predict accurately un-
til approximately 850 amino acids. (b) Time comparison
between AlphaFold and AlphaFold without MSA. It can be
observed that the sequences of the prediction failures for
both methods are different, and the time required AlphaFold
> AlphaFold without MSA in all cases.
MSA, subsequently affecting downstream AI infer-
ence. We also observed that the sequence length did
not significantly influence the depth of MSA.
3.2 Prediction of Reference Sequences
vs. Experimental Structures
We provided the accuracy of the protein structure pre-
diction tools in Table 1. First, we compared all PDB
structures with the predicted structure of a reference
sequence. It can be seen that all three tools are able
to predict protein structures with high precision, as
claimed. When we selected the PDB structure with
the most similar sequence after performing ClustalW,
it was evident that the average results showed an im-
provement. While RoseTTAFold seems to have the
best overall performance, it infers much fewer pre-
dicted structures. On the other hand, ESMFold, de-
spite having the worst performance in successfully
predicted structures, yields a higher number of suc-
cessful predictions. Overall, AlphaFold remains one
of the most accurate tools currently available after we
compare the intersection of results, and thus, it is the
primary tool for focused discussion.
From the corresponding numbers for AlphaFold
without MSA, we can deduce that a portion of Al-
phaFold’s failure to infer structures successfully is in
the MSA stage. Even though the numerical values
are the same, the average TM-score still slightly im-
proved, indicating that our method of selecting the
best structures for comparison is beneficial in the
evaluation. It’s also evident that completely omit-
ting MSA impacts the model’s performance because
the AlphaFold can only rely on template structures.
Another evaluative aspect is the model’s confidence
level in its own structures, as represented by the
pLDDT score. In terms of average pLDDT scores,
the ranking is as follows: AlphaFold (83.25) > Al-
phaFold without MSA (80.17) > ESMFold (79.27)
> RoseTTAFold (72.73). It is still evident that Al-
phaFold has a higher confidence level in its predicted
structures.
When we compare protein structure prediction
tools against all experimental structures with TM-
score less than 0.5, it became apparent that most
poorly predicted structures exhibit significant overlap
(Figure 4(a)), showing some of the structures were
still not able to predict in current tools. From Figure
4(b), we can observe that the proportion of aligned
lengths is never greater than the TM-score owing to
the definition. Furthermore, the distribution trend in-
dicates that the higher the aligned length, the higher
the corresponding TM-score.
Evaluating the Performance of Protein Structure Prediction in Detecting Structural Changes of Pathogenic Nonsynonymous Single
Nucleotide Variants
499
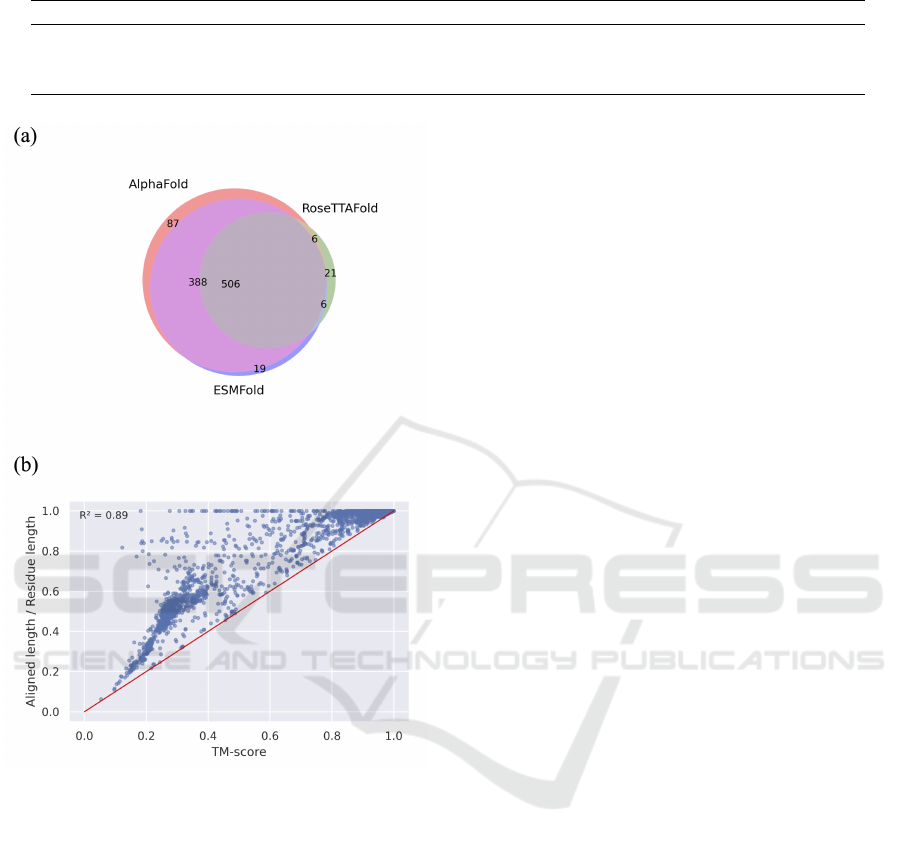
Table 1: TM-scores between predicted structures of reference sequences and experimental structures in PDB. (The number in
parentheses represents the number of structures to evaluate).
Average TM-score AlphaFold AlphaFold w/o MSA RoseTTAFold ESMFold
All PDBs (total 4965) 0.8069 (4933) 0.7983 (4960) 0.8184 (3286) 0.7923 (4580)
Best PDBs (total 159) 0.8352 (157) 0.7983 (158) 0.8359 (78) 0.8068 (141)
Intersection of Best PDBs 0.8791 (73) 0.8403 (73) 0.8426 (73) 0.8626 (73)
Figure 4: Poor predictions in three protein structure predic-
tion tools. (a) A Venn diagram illustrating significant over-
lap of poor predictions (TM-score < 0.5 when compared to
experimentally determined protein structures) among pro-
tein structure prediction tools. (b) Correlation between TM-
score and the proportion of aligned length (aligned length /
total residue length) in AlphaFold predicted reference struc-
tures and experimentally determined protein structures. The
red line’s slope is 1.
3.3 Prediction of Reference Sequences
vs. Alternative Sequences
Let’s further discuss the structural similarity between
the predicted structures of reference sequences and
the predicted structures of alternative sequences (Fig-
ure 5). It can be seen that most of the predicted
structures remain highly similar (TM-score > 0.9)
between reference and alternative. Among the three
tools, ESMFold exhibits the most significant similar-
ity. This is because it relies solely on natural lan-
guage processing techniques and lacks any variations
derived from MSA, resulting in less input variabil-
ity than the other tools, which provide little assis-
tance for subsequent AI inference. On the other hand,
RoseTTAFold, with a limited number of predicted
structures, primarily differs due to the low confidence
level (pLDDT score) in the predictions by the model
itself, making it unable to distinguish between the two
types of structures effectively. Within the AlphaFold,
we observed that the versions with and without MSA
distributions are highly similar, and the structural sim-
ilarity without MSA input is even higher than with
MSA input. In other words, although there is no
significant difference in MSA input, it still provides
some discrimination in the model’s input.
By comparing the pLDDT score of alternative
structures with their corresponding reference struc-
tures, we observed a high correlation between them
(Figure 6(a)). Therefore, we selected the pLDDT
score of the reference structure to compare with the
TM-score. When a model has a high confidence
level in its predictions, it becomes evident that the
reference and variant sequences are more similar.
However, we found 26 predicted structures where
the model exhibits a certain degree of confidence
(pLDDT > 70), but the reference structure and alter-
native structure significantly differ (TM-score < 0.5)
(Figure 6(b)). We first ensure that these reference
structures exhibit a high degree of similarity com-
pared to the experimental structures. Excluding the
two structures with TM-score < 0.7, the remaining
structures are considered to have changes most likely
related to nsSNV. Among them, MLH1 and its 19
variants are the most prominent examples.
After comparing the structures in visualization
tools, we found that the main differences in their
structures arise from the regions of disordered re-
gions. As shown in Figure 7, MLH1 contains two
major foldable domains, and one aligns well with the
experimental structure. After the disordered region
(position 355-378), although the folding remains sim-
ilar, the protein structures are spatially too distant to
align successfully, resulting in a lower TM-score. Ad-
ditionally, we observed that the variation from alanine
to glutamic acid at position 22 does not impact the
structure prediction.
BIOINFORMATICS 2024 - 15th International Conference on Bioinformatics Models, Methods and Algorithms
500
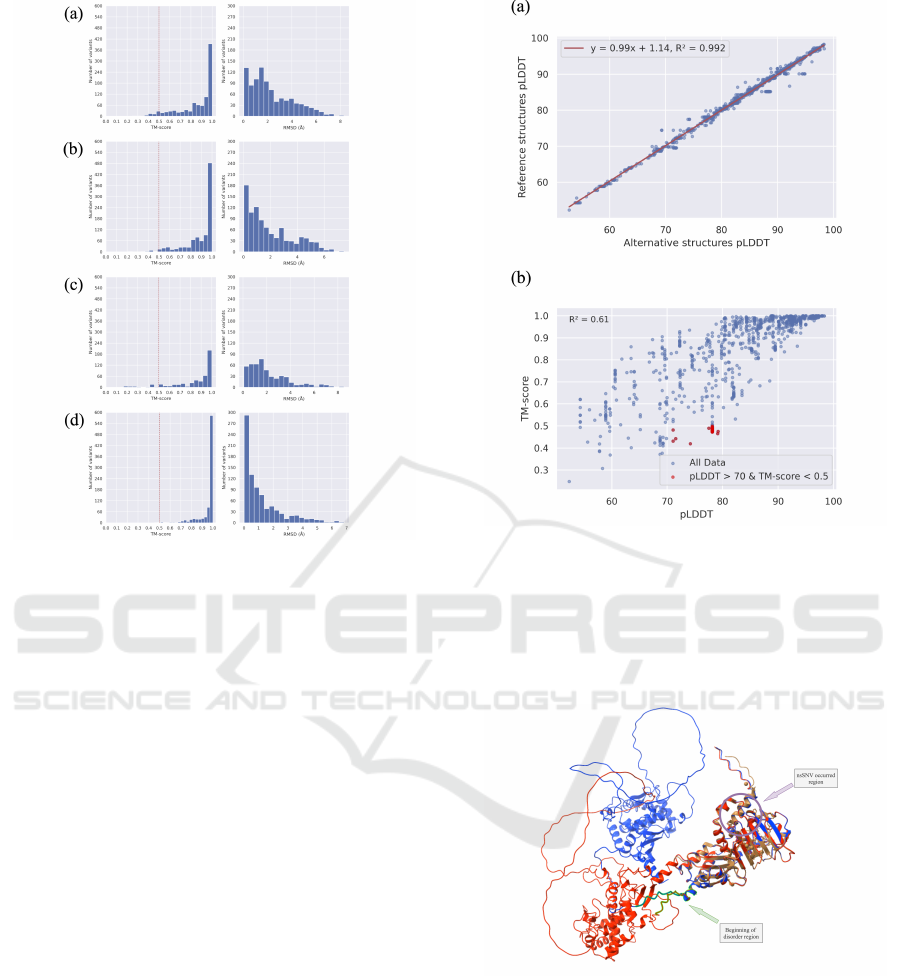
Figure 5: TM-align results between reference structures
and alternative structures. The left part is the distribu-
tion of TM-score, and the right part is the distribution
of RMSD. (a) AlphaFold (b) AlphaFold without MSA (c)
RoseTTAFold (d) ESMFold.
3.4 AlphaMissense
After the release of AlphaMissense, we included it in
evaluating the selected data. In the predictions from
AlphaMissense, 842 were classified as pathogenic, 69
as ambiguous, and 48 as benign among the selected
variants. Although the model architecture is simi-
lar to AlphaFold, its pathogenicity assessment does
not directly indicate structural changes. After all, we
can see that the nsSNVs we chose are highly corre-
lated with the AlphaMissense assessment, with 88%
of them being identified as pathogenic variants by Al-
phaMissense. However, none of the three tools pre-
dicted structural changes in any selected variants.
4 CONCLUSIONS
In this study, we compiled a dataset with a large num-
ber of pathogenic nsSNVs and executed structure pre-
diction using three tools. We verified AlphaFold’s
capability by choosing experimental structures that
are most similar to the reference sequence utilizing
ClustalW. Subsequently, we narrowed our discussion
to a subset where the tools exhibited confidence and
Figure 6: Relation between pLDDT score and TM-score.
(a) High correlation for pLDDT score between reference
structures and alternative structures. (b) Scatter plot for ref-
erence pLDDT score and its corresponding TM-score be-
tween predicted structures of reference sequences and al-
ternative sequences. The red dots represent the cases we
believe will most likely be distinctive for the structure pre-
diction tool.
Figure 7: Visualization of MLH1. The brown structure is
the best experimental structure after performing ClustalW.
The blue structure is the predicted structure of the refer-
ence sequence, and the red one is the predicted structure of
the alternative (A21E) sequence. The visualization is using
UCSF ChimeraX.
structural changes. However, we found that in some
cases, the inability to align structures between pre-
dicted structures of reference sequences and alter-
native sequences was not solely due to changes in
amino acids but resulted from differentiation in the
spatial orientation caused by disordered regions, lead-
Evaluating the Performance of Protein Structure Prediction in Detecting Structural Changes of Pathogenic Nonsynonymous Single
Nucleotide Variants
501

ing to a decrease in TM-score. Allowing separate pro-
tein structure predictions for each domain might help
avoid the effects of these disordered regions. In sum-
mary, the analyses conducted in this study revealed
limitations in the current structure prediction tools re-
garding their ability to predict structural changes in
mutated sequences. To enhance the accuracy of pre-
dicting structural alterations associated with nsSNVs,
we propose further refinement of prediction models.
This refinement should involve the collection of addi-
tional experimentally determined structure data to ad-
dress the challenges inherent in predicting the struc-
tural impact of nsSNVs.
REFERENCES
Adzhubei, I. A., Schmidt, S., Peshkin, L., Ramensky, V. E.,
Gerasimova, A., Bork, P., Kondrashov, A. S., and Sun-
yaev, S. R. (2010). A method and server for pre-
dicting damaging missense mutations. Nat Methods,
7(4):248–9.
Apweiler, R., Bairoch, A., Wu, C. H., Barker, W. C.,
Boeckmann, B., Ferro, S., Gasteiger, E., Huang, H.,
Lopez, R., Magrane, M., Martin, M. J., Natale, D. A.,
O’Donovan, C., Redaschi, N., and Yeh, L.-S. L.
(2004). Uniprot: the universal protein knowledgebase.
Nucleic acids research, 32(Database issue):D115–
D119.
Baek, M., DiMaio, F., Anishchenko, I., Dauparas, J.,
Ovchinnikov, S., Lee, G. R., Wang, J., Cong, Q.,
Kinch, L. N., Schaeffer, R. D., Mill
´
an, C., Park, H.,
Adams, C., Glassman, C. R., DeGiovanni, A., Pereira,
J. H., Rodrigues, A. V., Dijk, A. A. v., Ebrecht,
A. C., Opperman, D. J., Sagmeister, T., Buhlheller,
C., Pavkov-Keller, T., Rathinaswamy, M. K., Dalwadi,
U., Yip, C. K., Burke, J. E., Garcia, K. C., Grishin,
N. V., Adams, P. D., Read, R. J., and Baker, D. (2021).
Accurate prediction of protein structures and inter-
actions using a three-track neural network. Science,
373(6557):871–876.
Berman, H. M., Westbrook, J., Feng, Z., Gilliland, G., Bhat,
T. N., Weissig, H., Shindyalov, I. N., and Bourne, P. E.
(2000). The protein data bank. Nucleic Acids Res,
28(1):235–42.
Carugo, O. and Pongor, S. (2001). A normalized root-
mean-square distance for comparing protein three-
dimensional structures. Protein Sci, 10(7):1470–3.
Davydov, E. V., Goode, D. L., Sirota, M., Cooper, G. M.,
Sidow, A., and Batzoglou, S. (2010). Identifying a
high fraction of the human genome to be under se-
lective constraint using gerp++. PLOS Computational
Biology, 6(12):e1001025.
Gerasimavicius, L., Livesey, B. J., and Marsh, J. A.
(2022). Loss-of-function, gain-of-function and
dominant-negative mutations have profoundly differ-
ent effects on protein structure. Nature Communica-
tions, 13(1):3895.
Hassan, M. S., Shaalan, A. A., Dessouky, M. I., Abdel-
naiem, A. E., and ElHefnawi, M. (2019). Evalua-
tion of computational techniques for predicting non-
synonymous single nucleotide variants pathogenicity.
Genomics, 111(4):869–882.
Iqbal, S., P
´
erez-Palma, E., Jespersen, J. B., May, P., Hok-
sza, D., Heyne, H. O., Ahmed, S. S., Rifat, Z. T.,
Rahman, M. S., Lage, K., Palotie, A., Cottrell, J. R.,
Wagner, F. F., Daly, M. J., Campbell, A. J., and Lal,
D. (2020). Comprehensive characterization of amino
acid positions in protein structures reveals molecular
effect of missense variants. Proc Natl Acad Sci U S A,
117(45):28201–28211.
Ittisoponpisan, S., Islam, S. A., Khanna, T., Alhuzimi, E.,
David, A., and Sternberg, M. J. E. (2019). Can pre-
dicted protein 3d structures provide reliable insights
into whether missense variants are disease associated?
J Mol Biol, 431(11):2197–2212.
Jumper, J., Evans, R., Pritzel, A., Green, T., Figurnov,
M., Ronneberger, O., Tunyasuvunakool, K., Bates, R.,
ˇ
Z
´
ıdek, A., Potapenko, A., Bridgland, A., Meyer, C.,
Kohl, S. A. A., Ballard, A. J., Cowie, A., Romera-
Paredes, B., Nikolov, S., Jain, R., Adler, J., Back, T.,
Petersen, S., Reiman, D., Clancy, E., Zielinski, M.,
Steinegger, M., Pacholska, M., Berghammer, T., Bo-
denstein, S., Silver, D., Vinyals, O., Senior, A. W.,
Kavukcuoglu, K., Kohli, P., and Hassabis, D. (2021).
Highly accurate protein structure prediction with al-
phafold. Nature, 596(7873):583–589.
Keskin Karakoyun, H., Y
¨
uksel S¸, K., Amanoglu, I.,
Naserikhojasteh, L., Yes¸ilyurt, A., Yakıcıer, C.,
Timuc¸in, E., and Akyerli, C. B. (2023). Evaluation
of alphafold structure-based protein stability predic-
tion on missense variations in cancer. Front Genet,
14:1052383.
Kryshtafovych, A., Schwede, T., Topf, M., Fidelis, K.,
and Moult, J. (2021). Critical assessment of meth-
ods of protein structure prediction (casp)—round xiv.
Proteins: Structure, Function, and Bioinformatics,
89(12):1607–1617.
Kuhlman, B. and Bradley, P. (2019). Advances in pro-
tein structure prediction and design. Nature Reviews
Molecular Cell Biology, 20(11):681–697.
Landrum, M. J., Lee, J. M., Benson, M., Brown, G. R.,
Chao, C., Chitipiralla, S., Gu, B., Hart, J., Hoffman,
D., Jang, W., Karapetyan, K., Katz, K., Liu, C., Mad-
dipatla, Z., Malheiro, A., McDaniel, K., Ovetsky, M.,
Riley, G., Zhou, G., Holmes, J., Kattman, B. L., and
Maglott, D. R. (2017). Clinvar: improving access to
variant interpretations and supporting evidence. Nu-
cleic Acids Research, 46(D1):D1062–D1067.
Lin, Z., Akin, H., Rao, R., Hie, B., Zhu, Z., Lu, W.,
Smetanin, N., Verkuil, R., Kabeli, O., Shmueli, Y.,
dos Santos Costa, A., Fazel-Zarandi, M., Sercu, T.,
Candido, S., and Rives, A. (2023). Evolutionary-scale
prediction of atomic-level protein structure with a lan-
guage model. Science, 379(6637):1123–1130.
Ng, P. C. and Henikoff, S. (2003). Sift: Predicting amino
acid changes that affect protein function. Nucleic
Acids Res, 31(13):3812–4.
BIOINFORMATICS 2024 - 15th International Conference on Bioinformatics Models, Methods and Algorithms
502

Pak, M. A., Markhieva, K. A., Novikova, M. S., Petrov,
D. S., Vorobyev, I. S., Maksimova, E. S., Kondrashov,
F. A., and Ivankov, D. N. (2023). Using alphafold
to predict the impact of single mutations on protein
stability and function. PLoS One, 18(3):e0282689.
Perrakis, A. and Sixma, T. K. (2021). Ai revolutions in
biology. EMBO reports, 22(11):e54046.
Thompson, J. D., Higgins, D. G., and Gibson, T. J. (1994).
Clustal w: improving the sensitivity of progres-
sive multiple sequence alignment through sequence
weighting, position-specific gap penalties and weight
matrix choice. Nucleic Acids Res, 22(22):4673–80.
Wang, K., Li, M., and Hakonarson, H. (2010). Annovar:
functional annotation of genetic variants from high-
throughput sequencing data. Nucleic Acids Research,
38(16):e164–e164.
Zhang, Y. and Skolnick, J. (2004). Scoring function for au-
tomated assessment of protein structure template qual-
ity. Proteins, 57(4):702–10.
Zhang, Y. and Skolnick, J. (2005). Tm-align: a protein
structure alignment algorithm based on the tm-score.
Nucleic Acids Research, 33(7):2302–2309.
Evaluating the Performance of Protein Structure Prediction in Detecting Structural Changes of Pathogenic Nonsynonymous Single
Nucleotide Variants
503
