
Visualizing Group Structure in Compound Graphs: The Current State,
Lessons Learned, and Outstanding Opportunities
Henry Ehlers
1 a
, Diana Marin
2 b
, Hsiang-Yun Wu
3 c
and Renata G. Raidou
1 d
1
Visualization Group, Institute of Visual Computing and Human-Centered Technology, TU Wien,
Favoritenstr. 9-11 / E193-02, A-1040 Vienna, Austria
2
Rendering and Modeling Group, Institute of Visual Computing and Human-Centered Technology, TU Wien,
Favoritenstr. 9-11 / E193-02, A-1040 Vienna, Austria
3
St. P
¨
olten University of Applied Sciences, Department of Media and Digital Technologies,
Campus-Platz 1, St. P
¨
olten, A-3100, Austria
Keywords:
Compound Graph Visualization, Literature Survey, Group Structure Visualization.
Abstract:
Compound graphs are common across domains, from social science to biochemical pathway studies, and their
visualization is important to both their exploration and analysis. However, effectively visualizing a com-
pound graph’s topology and group structure requires careful consideration, as evident by the many different
approaches to this particular problem. To better understand the current advancements in compound graph
visualization, we have consolidated and streamlined existing surveys’ taxonomies. More specifically, we aim
to disentangle the visual relationship between graph topology and group structure from the visual encoding
used to visualize its group structure in order to identify interesting gaps in the literature. In so doing, we are
able to enumerate a number of lessons learned and gain a better understanding of the outstanding research
opportunities and practical implications across domains.
1 INTRODUCTION
Compound graph data, their visualization, and anal-
ysis are common across many different fields: from
social networks (Federico et al., 2011), to biochemi-
cal pathways (Partl et al., 2013), to business analytics
(Adomavicius and Bockstedt, 2008) and transporta-
tion logistics (Mesa-Arango and Ukkusuri, 2015). In
social network analysis, for example, researchers are
interested in understanding a person’s role across so-
cial groups. Here, compound graphs can be used
to model individuals as nodes and their relationships
as edges, as well as their place in various types of
groups, such as circles of friends, roles within a
workplace, or associations with organizations. For
another example, in the context of biological path-
ways, domain experts are interested in understanding
the mechanistic relationships between individual and
groups of genes and metabolites, in order to under-
stand the biochemical underpinnings of disease or cell
a
https://orcid.org/0000-0002-5994-1492
b
https://orcid.org/0000-0002-8812-9719
c
https://orcid.org/0000-0003-1028-0010
d
https://orcid.org/0000-0003-2468-0664
function. No matter their application area, compound
graphs are a useful framework for probing and un-
derstanding networks whose nodes also share group-
level relationships.
However, compound graphs are challenging to vi-
sualize, as researchers are interested in understanding
such graphs on both a topological and a group level
for increasingly large datasets. Thus, any visualiza-
tion of compound graphs must tackle the challenge
born of trying to balance the visual communication
of both entity topology and group structure. Various
visualization approaches and systems have been put
forth in literature, each tackling this challenge dif-
ferently: Some forgo interactivity in the interest of
scalability (De Domenico et al., 2015), others aim
to combine the two using summarization or linked
views (Dunne and Shneiderman, 2013), while others
yet build upon domain-specific visual conventions to
better serve a particular user group (Lex et al., 2010).
While existing reviews have taxonomically sum-
marized these various visualization approaches for
compound (Vehlow et al., 2015), multivariate (Nobre
et al., 2019), multilayered (McGee et al., 2019), and
dynamic (Beck et al., 2014) graphs, we note that none
Ehlers, H., Marin, D., Wu, H. and Raidou, R.
Visualizing Group Structure in Compound Graphs: The Current State, Lessons Learned, and Outstanding Opportunities.
DOI: 10.5220/0012431200003660
Paper published under CC license (CC BY-NC-ND 4.0)
In Proceedings of the 19th International Joint Conference on Computer Vision, Imaging and Computer Graphics Theory and Applications (VISIGRAPP 2024) - Volume 1: GRAPP, HUCAPP
and IVAPP, pages 697-708
ISBN: 978-989-758-679-8; ISSN: 2184-4321
Proceedings Copyright © 2024 by SCITEPRESS – Science and Technology Publications, Lda.
697

had classified compound graph visualization strate-
gies along the more abstract axes of general (compar-
ative) visualization (Kim et al., 2017). We argue that
doing so allows for a more general understanding of
literature gaps and the identification of new, interest-
ing research opportunities.
In this position paper, we identify and discuss
lessons learned and novel research opportunities
within the context of group structure visualization in
compound graphs. To better understand the current
state-of-the-art, we draw upon existing taxonomies
developed in recent surveys, namely i) (Vehlow et al.,
2015), (Beck et al., 2014), (Nobre et al., 2019), and
(McGee et al., 2019)’s reports on (particular types of)
compound graphs, ii) (Alsallakh et al., 2016)’s survey
on set-typed data, and finally iii) in order to position
compound graph visualization within a comparison-
oriented framework, (Kim et al., 2017)’s report on
comparative strategies. These reviews were selected
as, based on their impact on the field, we believe them
to be authoritative and representative. These state-
of-the-art reports and their taxonomies share notable
overlap and all shed light on various facets of the
group structure visualization challenge in compound
graphs. We argue, however, that none, by themselves,
provide a complete view of the current opportunities.
Instead of providing a meta-review, here, we consol-
idate and extend these taxonomies to provide a com-
prehensive overview of the topic. This is to aid us in
identifying both major lessons learned from past re-
search in the field as well as open challenges across
compound graph visualization domains not yet dis-
cussed by these aforementioned reports.
Specifically, we identify three core axes along
which to categorize literature, namely
1. the visual relationship between group and topo-
logical information, inspired by (Kim et al.,
2017),
2. the visual encoding chosen for the graph’s group
structure, inspired by (Alsallakh et al., 2016),
3. the kind of group-level relationships admitted
by the approach in question, as investigated by
(Vehlow et al., 2015).
We collect 167 references, partially based on the bib-
liographies of existing reviews, and place them within
our taxonomy. Based on our findings, we identify
gaps in the literature, outstanding challenges, and
lessons that can be useful for domain researchers. We
also identify several novel research opportunities.
2 RELATED WORK
2.1 Compound Graph Visualization
Dynamic Graphs. Dynamic graphs describe the
evolution of entities and their relationships over time.
(Beck et al., 2014) survey and taxonomically clas-
sify current approaches to the visualization of such
graphs. They identify three families of approaches,
namely i) animation, i.e. the mapping of time to time,
as seen in the work of (Ma et al., 2015), ii) timelines,
i.e. the mapping of time to space, exemplified by Ma-
trixFlow (Perer and Sun, 2012), and iii) hybrid ap-
proaches that combine the two, such as Small Multi-
ples (Bach et al., 2015). While these families of ap-
proaches can indeed be utilized for general compound
graph visualization, their work naturally does not dis-
cuss this in much detail. Nonetheless, they identify a
large set of relevant techniques, approaches, and ap-
plications of dynamic graph visualization, and a num-
ber of their findings are mirrored in more general sur-
veys (Vehlow et al., 2015; McGee et al., 2019).
Multilayer Graphs. Multilayer networks are a gen-
eral framework describing various group-level rela-
tionships of both edges and nodes (Kivel
¨
a et al.,
2014). (McGee et al., 2019) survey the state-of-the-
art of visualizing such networks. They classify papers
collected based on the visualization method: i) 1D
representations, e.g. circular (Bothorel et al., 2013) or
axis-based (Krzywinski et al., 2012) approaches, ii) 2,
2.5, and 3D node-link diagrams which often use color
(Archambault et al., 2007b) or linked views (Renoust
et al., 2015) to communicate group structure, iii)
matrix-based visualizations, such as Termite (Chuang
et al., 2012) or MuxVis (De Domenico et al., 2015), iv)
hybrid approaches, such as the matrix/node-link dia-
gram NodeTrix (Henry et al., 2007), and v) summary
approaches, such as Graph Thumbnails (Yoghourd-
jian et al., 2018).
Multivariate Graphs. Multivariate graphs are col-
lections of nodes and edges with additional data at-
tached to them, such as group-level associations.
Here, (Nobre et al., 2019) classify existing multivari-
ate graph techniques along their view-, layout-, data-
operations, and layouts. While they do not specifi-
cally address the visualization of group-level informa-
tion, a number of their taxonomy categories are mir-
rored by other surveys discussed here. Most notably
they discuss three types of view operations; juxta-
posed, integrated, and overloaded. Nonetheless, their
recent publication contains a number of papers fea-
IVAPP 2024 - 15th International Conference on Information Visualization Theory and Applications
698

tured in other state-of-the-art reports that are worth
classifying in our own taxonomy.
Compound Graphs. Finally, (Vehlow et al., 2015)
survey approaches to the visual communication of
group structure of compound graphs. They ultimately
identify four meta-categories to describe different ap-
proaches with which to visualize such group struc-
tures, namely i) visual node attributes, i.e. the en-
coding of group structure in the form of glyphs or
color in the compound graph’s embedding, exempli-
fied by TopicPanorama (Wang et al., 2016) and Net-
workAnalyst (Xia et al., 2015), respectively, ii) jux-
taposition, i.e. the separate visualizing group struc-
ture in either a linked view or attached to the graph’s
embedding, as seen in the works of (Burch et al.,
2013) and (Zhou et al., 2015), respectively, iii) su-
perimposition, i.e. the overlaying of group struc-
ture atop the graph’s embedding using regions or
lines, such as Kelp Diagrams (Dinkla et al., 2012)
and LineSets (Paduano and Forbes, 2015), respec-
tively, iv) embedding, i.e. the drawing of a separate
graph with which to communicate group structure re-
lations, using, for example, hypernode summarization
(Chaturvedi et al., 2014) or hybrid graph embeddings
(Henry et al., 2007; Angori et al., 2019).
Summary. All four of these categorizations, while
useful, are complementary to each other, and all, to
some extent or another, conflate i) the visual rela-
tionship between topological and group-level infor-
mation, i.e. how a graph’s group structure is visu-
alized relative to the topology’s visualization, and ii)
the group structure’s chosen visual encoding, i.e. how
a graph’s group structure, not its topology, is visu-
ally represented. Subsequently, we aim to build upon,
unify, and extend them to produce a novel perspective
on the current state of compound graph visualization.
2.2 Visualizing Group Structure
(Alsallakh et al., 2016) study different strategies for
visualizing group-level information for sets and their
elements. While this taxonomy was not developed
with compound graphs in mind, there is notable over-
lap with, and opportunities for extending, the afore-
mentioned compound graph visualization taxonomies
(Section 2.1). They identify six types of visualiza-
tion strategies with which to encode group structure,
namely i) Euler/Venn diagrams that represent each
set as a closed curve and intersections as the over-
lap between them, ii) Overlays, which, given some
embedding of each element as a point in 2D (or
3D) space, overlay set-membership using (colored)
glyphs, lines, or region overlays, iii) node-link dia-
grams that represent each set and element as a node
and draw bipartite edges between to communicate set-
element-membership, iv) matrices which place either
elements and sets along rows and columns to com-
municate identity, or will place sets/elements along
both rows and columns to communicate similarity, v)
aggregation-based representations that do not visual-
ize all elements, but instead only show the number
of elements per set in order to provide an effective
overview of larger datasets, vi) scatter plots, a spe-
cial type of aggregation, which embeds each set as a
single point in 2D or 3D space as a function of some
similarity metric or data attribute.
2.3 Comparative Visualization
Lastly, (Kim et al., 2017) describe four differ-
ent approaches to comparative visualization of 3D
and 4D spatial data. While not complete on their
own, we argue that these abstract classes of com-
parative visualization can be meaningfully mapped
to group-structure visualization approaches in com-
pound graphs. More specifically, we argue that the
compound graph visualization problem can be under-
stood as a comparison of graph topology on the one
hand and group structure on the other. Four classes
of approaches to comparative visualization are iden-
tified. Juxtaposition describes the side-by-side visu-
alization of objects to be compared. Superimposition
describes overlaying the objects to be compared. In-
terchangeability describes the interactive or animated
scrubbing through objects. Finally, explicit visualiza-
tion is the visualization of some derived (summary)
quantity instead of the objects directly.
3 PAPER COLLECTION
In order to obtain a representative set of papers and
applications, key references selected from the bib-
liographies of four relevant state-of-the-art reports,
(Nobre et al., 2019), (McGee et al., 2019), (Vehlow
et al., 2015), and (Beck et al., 2014) were consoli-
dated. Interestingly, despite the relatedness of the top-
ics, we note little overlap in general between these
four reviews, with the possible exception of (Beck
et al., 2014) and (Vehlow et al., 2015) (Figure 1. It
should, however, be noted that the inclusion of ref-
erences from existing works may introduce a certain
bias to our literature review. Thus, in order to in-
clude more recent papers not present in these afore-
mentioned works, we additionally manually curated
an additional set of references from relevant venues,
Visualizing Group Structure in Compound Graphs: The Current State, Lessons Learned, and Outstanding Opportunities
699
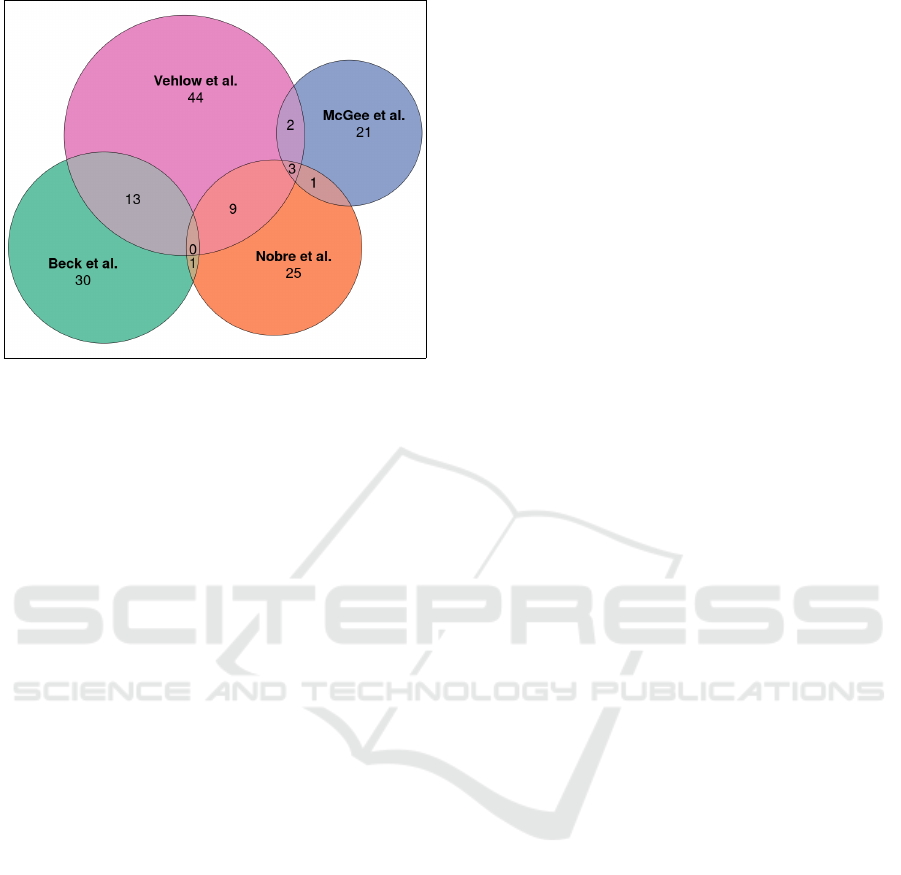
Figure 1: Sources and overlap of the selected papers col-
lected from (Beck et al., 2014), (Nobre et al., 2019),
(Vehlow et al., 2015), and (McGee et al., 2019) illustrated
as an area-proportional Euler diagram. Among other goals,
we aim to unify their collected references in addition to ex-
tending this collection of literature.
such as IEEE TVCG, Computer Graphics Forum,
PacificVis, Graph Drawing and Network Visualiza-
tion, and Information Visualization. In total, 167 pa-
pers were collected and subsequently manually cat-
egorized based on their visual relationship (Section
4.1), visual encoding (Section 4.2), group structure
(Section 4.3), as well as their application area. The
final set of papers and their categorization have been
made publicly available on GitHub.
4 THE CURRENT STATE
Drawing upon these taxonomies, we propose to cate-
gorize papers along three main “axes”, namely i) the
chosen visual relationship between groups and their
elements, ii) the selected visual encoding with which
to communicate the graph’s group structure itself, and
iii) the group structure of the data.
4.1 Visual Relationships
A compound graph’s visual relationship describes
how a graph’s group structure is visualized relative
to its topology - Figure 2. Here, combining (Kim
et al., 2017) and (Vehlow et al., 2015)’s taxonomies,
we identify five possible visual relationships.
Separate. Defined by (Vehlow et al., 2015) as “Par-
titioned”, a separate visual relationship, describes the
visualization of group structure in a separate (possi-
bly linked) view, such that the graph’s global topol-
ogy and group structure can be investigated indepen-
dently. Such representations are especially useful if
the graph’s group structure is too complex to visualize
atop or within its topological embedding. Consider,
for example, the tree attached to a node-link diagram
seen in ASK-GraphView (Abello et al., 2006).
Juxtaposed. Equivalently found in (Vehlow et al.,
2015)’s taxonomy under “Superimposed / Parti-
tioned”, a juxtaposed visual relationship (Kim et al.,
2017) describes the side-by-side visualization of each
group’s subgraph’s embedding in separate, possibly
linked, views. Such representations are beneficial
when a set of topologically similar graphs are to be
compared side-by-side. For example, Entourage (Lex
et al., 2013) opts to visualize different pathways side-
by-side in a juxtaposed manner.
Embedded. Defined as “Superimposed” by (Kim
et al., 2017) and “Visual Node Attribute” as well as
“Superimposed / Overlay” by (Vehlow et al., 2015),
an embedded visual relationship defines the simul-
taneous visualization of graph topology and group
structure in a single view, be it through color or re-
gion overlays or an explicit axis. Such representa-
tions can be useful, especially in explorative analysis
endeavors, where one must first locate areas of simul-
taneous topological or group-structural interest. Top-
icPanorama (Wang et al., 2016), for example, visual-
izes group assignments as embedded glyphs.
Interchangeable. Not explicitly found in (Vehlow
et al., 2015), an interchangeable visual relationship
(Kim et al., 2017) describes the visualization of each
group’s subgraph as a separate “slice” in a pile of lin-
early arranged slices that are traversed interactively,
or automatically, using animation. Similar to juxta-
posed representations, such visual relationships lend
themselves well to immediate comparisons of pairs
of subgraphs, especially when a compound graph’s
group structure can be linearly arranged, e.g. time
slices in dynamic graphs. Consider, for example, the
small multiples of adjacency matrices presented in the
work of (Bach et al., 2015).
Explicit. Defined by (Vehlow et al., 2015) as “Em-
bedded”, an explicit visual relationship (Kim et al.,
2017) describes the visualization of some computed
characteristic, such as differences or averages or sim-
ilarity, in order to provide a simpler summary visu-
alization. These representations are especially useful
for highly complex or large compound graphs, where
IVAPP 2024 - 15th International Conference on Information Visualization Theory and Applications
700

(a) Separate (b) Juxtaposed (c) Embedded (d) Interchangeable (e) Explicit
Figure 2: Examples showcasing the five identified visual relationships between group-level and topological encodings. (a)
Separate relationships describe the visualization of group structure independently of any (topological) embedding of the
compound graph. (b) Juxtaposed relationships place each group’s subgraph side-by-side, allowing for straightforward com-
parisons between them. (c) Embedded relationships embed group-level information within/atop a compound graph’s draw-
ing. If a particular node forms an intersection between two groups, its glyph is accordingly colored. (d) Interchangeable
relationships only visualize one group’s subgraph’s topology at a time but allow for a user to scrub through them linearly. (e)
Explicit relationships, rather than displaying all topological and group-level relationships, visualize only a composite of the
two.
the simultaneous visualization of group structure and
topology (in a single view) is not feasible or useful.
For example, (Sallaberry et al., 2010) opt to visualize
each group and their intersections as hypernodes and
regular nodes, respectively.
4.2 Visual Encoding
The visual encoding describes here how a graph’s
group structure—not its topology—is visually repre-
sented, i.e. how set membership, intersections, and
exclusions are visually communicated to the user, as
seen in Figure 3. Drawing primarily from (Vehlow
et al., 2015) and (Alsallakh et al., 2016) we identify
and define eight approaches with which to visually
communicate nodes’ group associations.
Node Attribute. Described as “Overlays” by Alsal-
lakh et al. (Alsallakh et al., 2016), node attributes
(Vehlow et al., 2015) are characteristics, here group
membership(s), of a compound graph’s elements,
which can be utilized to alter the visual attributes of
each node during the embedding of the graph. Color
is arguably the most common such node attribute with
which to communicate group/set/cluster membership
as it is simple to implement and understand. Sim-
ilarly, shapes can also be used. Lastly, glyphs are
useful for more complex element-set-memberships
and relationships, as they can, for example, express
such relationships as pie charts instead of simple
shapes or colors, as seen in TopicPanorama (Wang
et al., 2016). In general, node attributes are a non-
invasive, if limited, approach to visually communicat-
ing group memberships and relations without affect-
ing the graph’s topological embedding.
Overlay. Given some embedding of elements in
2D, overlays, described by (Vehlow et al., 2015) as
“Line/Region-based overlays”, add visual informa-
tion atop elements/nodes to communicate set mem-
bership. This commonly takes the form of a
hulls/regions overlaid atop grouped vertices (Alsal-
lakh et al., 2016), as seen in (Partl et al., 2013)’s
enRoute. A key disadvantage of region-based over-
lays is the ambiguity that can arise from overlapping,
but non-intersecting, contiguous regions (Alper et al.,
2011). Line overlays avoid such ambiguity by encod-
ing group membership to line-node-intersections, as
seen in (Alper et al., 2011)’s LineSets. Lines, how-
ever, can require a lot of “ink” when connecting ver-
tices close to each other, resulting in more visual clut-
ter than a simple region. In an effort to leverage the
advantages of both, hybrid overlays combine both re-
gions and lines, as exemplified by (Meulemans et al.,
2013)’s KelpFusion. In general, overlays can be an
effective means of communicating (disjoint) vertex-
group membership, though they struggle to effec-
tively communicate denser or more complex group-
level relationships.
Bipartite Node-Link Diagram. Thus far, group-
level relationships have not affected the topological
embedding, thereby communicating topological rela-
tionships clearly at the potential cost of group-level
clarity. Here, (bipartite) node-link diagrams (Alsal-
lakh et al., 2016; Vehlow et al., 2015) represent both
groups and their elements as different vertices in the
same embedding, and visualize their associations as
bipartite edges connecting them. The produced node-
link diagram thus has two types of edges: topologi-
cal edges connecting element vertices to each other,
and bipartite edges connecting group and element
edges. This can allow group-level clustering to be
more apparent as the group structure now directly af-
fects the embeddings seen in (Bigelow et al., 2019)’s
Origraph.
Visualizing Group Structure in Compound Graphs: The Current State, Lessons Learned, and Outstanding Opportunities
701
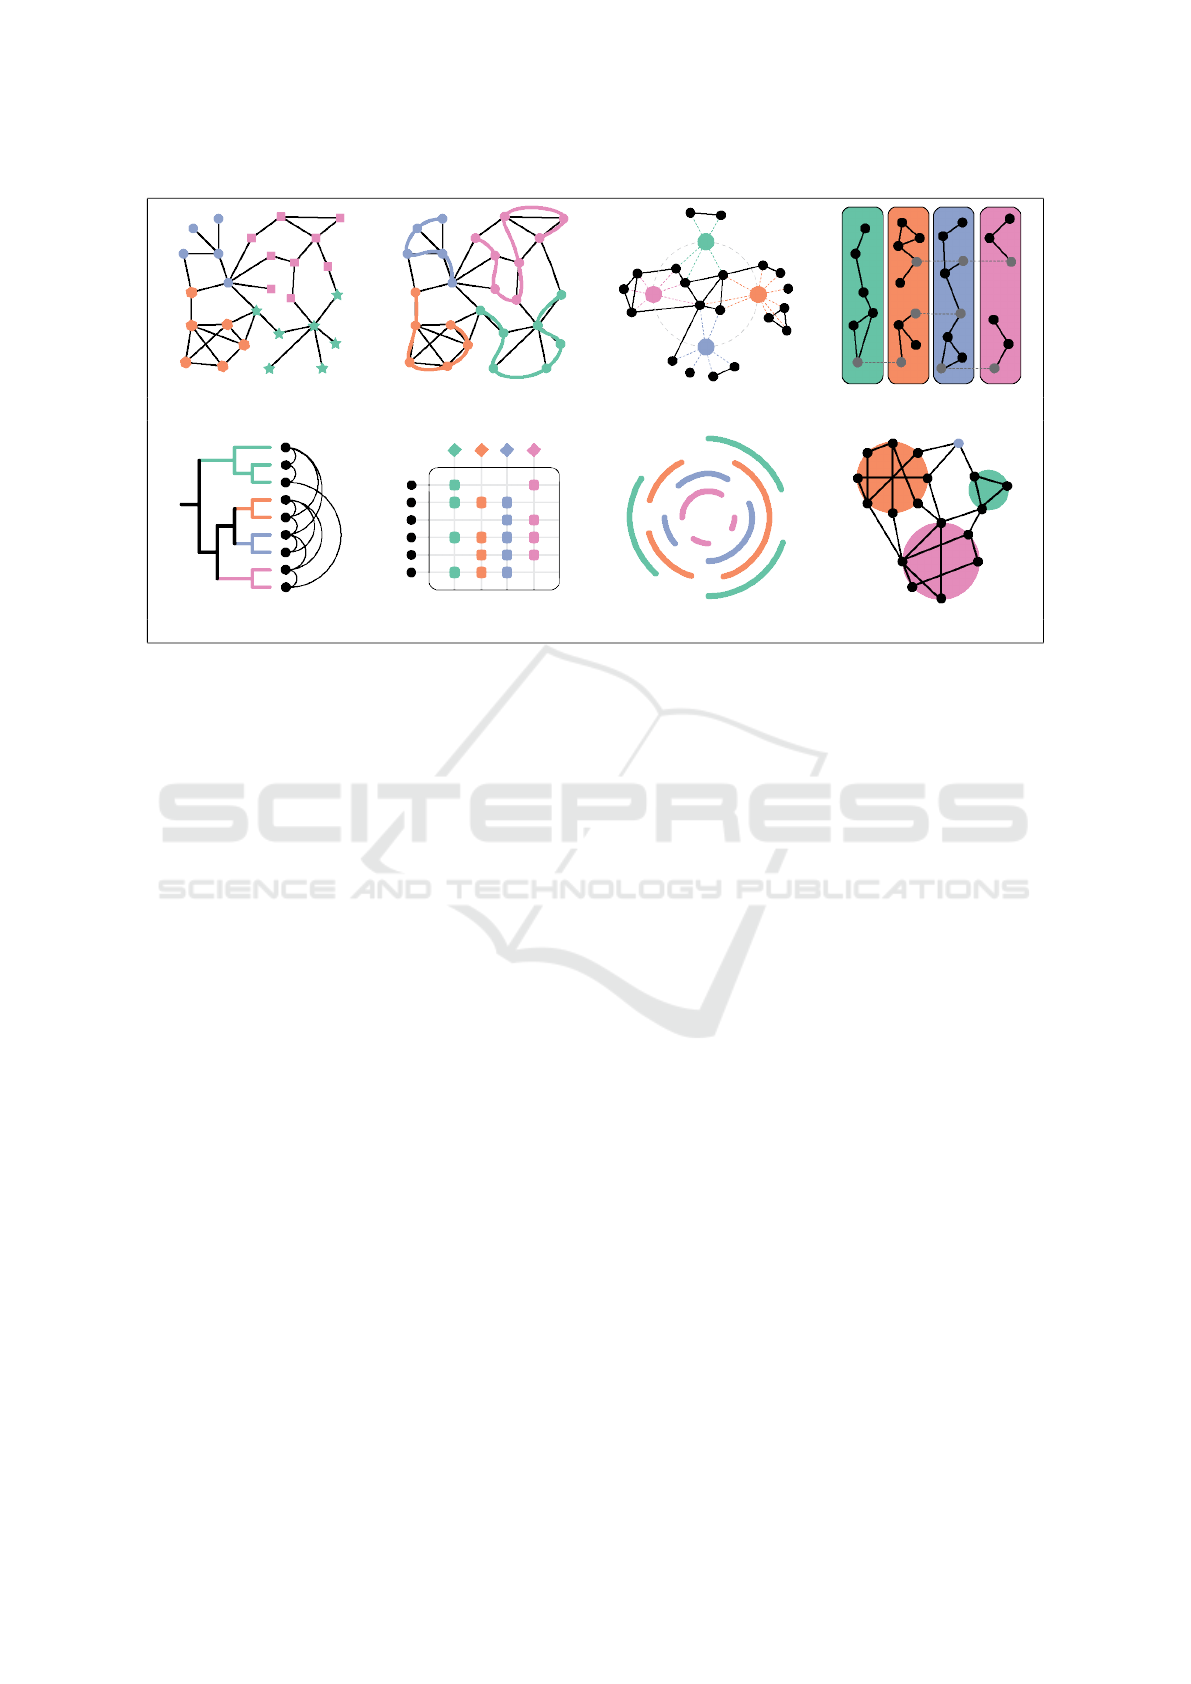
(a) Node Attribute (b) Overlay (c) Bipartite N.L.D. (d) Multiples
(e) Trees (f) Matrix (g) Abstraction (h) Hybrid
Figure 3: Examples of the eight identified visual encodings of group structure. (a) Node-Attribute encodings simply visualize
nodes’ group memberships using those nodes’ color and/or shape. (b) Overlay encodings visualize group membership as
regions or lines atop the nodes in the graph embedding. (c) Bipartite node-link diagram encodings visualize groups as
additional nodes within the graph’s embedding. Group membership is communicated using bipartite edges connecting group
nodes to topological nodes. (d) Multiples encodings visualize each group’s subgraph separately in its own “tile”. (e) Tree
encodings communicate (hierarchical) group structure between entities, visualized as leaf nodes, as hierarchical nodes whose
edges indicate super/sub-set relationship between them. (f) Identity matrix encodings communicate set membership tabularly
where if a node (row) pertains to a group (column), the respective cell is filled. (g) Abstraction encodings provide an
overview of groups’ cardinalities and their relationships by abstracting away the individual elements that make up said group.
Intersections are communicated through angular overlap between lines. Finally, (h) hybrid encodings combine any of the
above encoding types, e.g. a combination of multiples with node-link diagrams.
Multiple. Instead of visualizing group information
within, atop, or next to a graph’s embedding, multi-
ples, described as “Partitioning” by (Vehlow et al.,
2015), visualize each group’s topology separately.
Here, each such subgraph is displayed in its own
“tile”, arranged most commonly either in a juxta-
posed or interchangeable manner. Juxtaposed mul-
tiples, such as (Bach et al., 2015)’s Small MultiP-
iles. allow for a straightforward side-by-side com-
parison of subgraphs. Interchangeable multiples re-
quire (animated) transitions from one tile to the next,
as seen in (Bach et al., 2014a)’s Graph Diaries. On
the one hand, multiples allow for a clear visualization
of each group’s subgraph’s topology and its element-
group memberships. On the other, however, the visual
communication of group-level intersections in non-
disjoint graphs is complicated, as vertices that map
to multiple groups must be duplicated; once per tile.
Tree. Trees are prevalent in the visualization of dis-
joint, hierarchical group structures. Elements are rep-
resented as the tree’s leaves and the various levels
of the tree represent the various (hierarchically re-
lated) sets. Edges encode set-element membership
as well as set-set hierarchies. Most commonly, trees
are visualized in separate views, e.g. (Abello et al.,
2006)’s ASK-Graph. as visualizing topological edges
between the tree’s leaf nodes can be visually diffi-
cult. For example, (Telea and Auber, 2008)’s Code-
Flows addresses this challenge by visualizing topo-
logical relationships as a bipartite graph and duplicat-
ing the group’s hierarchical tree structure along each
bi-partition.
Matrix. Matrices (Alsallakh et al., 2016) can com-
municate set membership and relationships tabularly
in one of two ways. On the one hand, an iden-
tity matrix arranges elements and sets along its rows
and columns, respectively, and “fills” a correspond-
ing matrix cell if an element maps to that particu-
lar set. Intersections are communicated by a specific
row (element) mapping to multiple columns (sets) —
e.g. (Chuang et al., 2012)’s Termite. On the other
hand, a similarity matrix places either sets or elements
along both rows and columns and fills each cell with
some measure of similarity, thereby communicating
IVAPP 2024 - 15th International Conference on Information Visualization Theory and Applications
702
set or element relationships, but being unable to com-
municate element-set-membership on its own.
Abstraction. Abstraction-based techniques, de-
scribed by (Alsallakh et al., 2016) as “Aggregation”,
opt to visualize not all sets, elements, and their
relationships, but instead provide an overview of one,
at the expense of the others. Here, given the scope of
the paper, we define abstraction-based techniques as
techniques that abstract away element information in
favor of more clearly communicating group-level in-
formation. Quite naturally, this fairly broad category
can encompass many different approaches; from the
relatively simple Linear Diagram (Rodgers et al.,
2015) to the much more complex Graph Thumbnail
(Yoghourdjian et al., 2018).
Hybrid. Finally, hybrid approaches (Vehlow et al.,
2015) combine the aforenoted representations in
unique ways, exemplified by (Henry et al., 2007)’s fu-
sion of node-link diagrams and matrices - NodeTrix,
or (Angori et al., 2019)’s combination of chord and
node-link diagrams - ChordLink.
4.3 Group Structure
Lastly, continuing the work of (Vehlow et al., 2015),
we categorize collected techniques based on the type
of group structure they are designed to visualize.
While they focused on distinguishing not only hierar-
chical from flat and disjoint from overlapping group
structures, these authors additionally noted crisp from
fuzzy groupings. Given the scope of our work, we
omit the latter from our own categorization of litera-
ture. Thus, for each combination of visual encoding
and visual relationship, we count the total number of
approaches that apply to each considered type of data
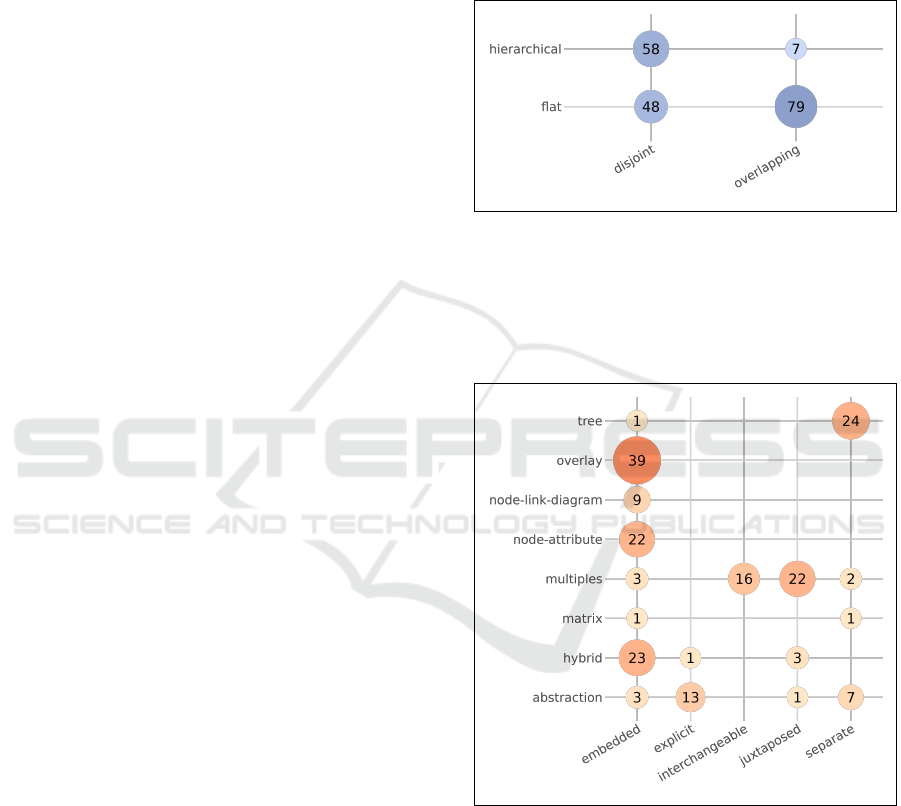
in order to identify potential gaps (Figure 4).
5 LESSONS LEARNED
Following our taxonomy of visual encoding and vi-
sual relationships described in Sections 4.2 and 4.1,
we classify the collected corpus accordingly, the re-
sults of which are presented in Figure 5.
Foregone Conclusions. Somewhat unsurprisingly,
many combinations of visual encodings pair (almost)
exclusively with certain visual relationships (Fig-
ure 5). Most notably, overlays and node attributes, by
definition, are embedded encodings, visualized within
the graph topological embedding. Thus, the 39 over-
lay and 22 node-attribute techniques map exclusively
to the embedded relationship category. Similarly,
multiples, if presented in 2D, would most commonly
only be visualized either interchangeably or juxta-
posed to each other, or separately from some other
topological representation.
Figure 4: Group structures compatible with the visualiza-
tion approaches collected from the selected papersp. Circle
area and color intensity encode the number of papers and
techniques that map to a particular combination of group
structure and “overlappedness”. The exact number of pa-
pers is displayed at the center of each circle in black. Papers
could map to more than one such combination of categories.
Figure 5: Co-occurence of visual encodings and visual rela-
tionships of the selected papers. Circle area and color inten-
sity encode the number of papers and techniques that map to
a particular combination of encoding and relationship. The
exact number of papers is displayed at the center of each
circle in black. Some papers featured multiple visual en-
codings and/or relationships and were thus mapped to more
than one combination of such categories.
Everyday Embedded. Of the 167 papers collected,
the majority (98 references) featured an embedded re-
lationship between graph topology and group struc-
Visualizing Group Structure in Compound Graphs: The Current State, Lessons Learned, and Outstanding Opportunities
703

ture (Figure 5). Most commonly, these papers rep-
resented their graph’s group structure using overlay,
node-attribute, or hybrid techniques. Overlays and
node-attributes appear to be especially popular when
the graph’s topology is of greater importance than
its group structure, as they do not alter the topol-
ogy representation. For completeness, however, it
should be noted that several region-based overlays
specifically, such as Polyptychon (Daniel et al., 2014)
and H-BLOB (Sprenger et al., 2000), are algorithmi-
cally incorporated during the (spring-)embedding of
the graph and thus do affect the graph’s visualization.
Their popularity seems to also be connected to their
conceptual simplicity and ease of implementation.
Embedded relationships were used for all group
structures, though primarily for flat ones. 37 papers
were applied to disjoint/flat group structures, such as
the region-based overlay MapSets (Efrat et al., 2014)
or the hybrid technique ChordLink (Angori et al.,
2019), and 36 papers mapped to overlapping/flat
group structures, as seen in (Dinkla et al., 2014)’s
hybrid tool eXamine or (Vehlow et al., 2013)’s node-
attribute approach.
This combination of embedded encoding and flat
groupings is perhaps unsurprising, as the use of node
attributes or overlays —the two most common em-
bedded encoding techniques— do not straightfor-
wardly allow for the encoding of hierarchical rela-
tionships on their own. Additionally, as discussed in
Section 4.2, embedded approaches’ ability to visually
communicate overlap between more complex groups
is also somewhat limited. Thus, most combinations of
embedded encoding and overlapping groupings limit
themselves to fairly simple cases, i.e. either few
groups or few intersections.
However, embedded approaches were also uti-
lized for hierarchical relationships, though pri-
marily disjoint ones, with 24 instances of dis-
joint/hierarchical and 4 overlapping/hierarchical.
Disjoint/Hierarchical relationships mostly focus on
visualizing a single layer of the hierarchy within the
compound graph’s embedding while visualizing the
full hierarchy in a separate (linked) view, as seen in
OntoTrix (Bach et al., 2013), HybridVis (Bach et al.,
2013), or TreeMatrix (Rufiange et al., 2012).
Lastly, for the few overlapping-hierchical em-
bedded visualizations, (Wang et al., 2016) and
(Nakazawa et al., 2012) opted to visualize one layer at
a time and communicate overlap using colored glyphs
while the complete hierarchy was visualized sepa-
rately, while (Jusufi et al., 2013) opted to visualize
group-entity associations as a node-link diagram.
Seeing the Forest for the Trees. Tree-style
encodings were applied predominantly to dis-
joint/hierarchical group structures with 21 instances
thereof, while all other group structures featured
2 instances each. Here, tree representations of
group structure are most commonly visualized sep-
arately from the graph’s topology: of these 21 dis-
joint/hierarchical group structures, 20 were visual-
ized separately (Figure 5). This can be attributed
to the visual complexity that such trees introduce on
their own, i.e. a whole set of nodes and edges repre-
senting set relationships between groups in addition
to topological ones between entities. By visualizing
topology and group structure separately, equal weight
can be given to both without one affecting the other
which allows for such complex, hierarchical relation-
ships to be visualized more easily.
Indeed, looking at techniques intended for larger
networks, such as (Abello et al., 2006)’s ASK-
GraphView or (Abello et al., 2005)’s combination of
fisheye views and treemaps, the graph’s hierarchical
group structure becomes complex enough to require
a separate view. For simpler hierarchies and smaller
graphs, a separate tree representation has been com-
bined with abstracted graph embeddings, such as (Ar-
chambault et al., 2007a)’s Grouse framework. Com-
bining topological and group node-link diagrams in
a single integrated view is possible as well (Pretorius
and Van Wijk, 2006). However, even in the examples
given, understanding the graph’s topology and group
structure is challenging.
This Is Getting Out of Hand: Now There Are Mul-
tiples of Them! Multiples are a reasonably pop-
ular approach for representing group structures, as
they allow for each group’s subgraph to be embedded
(partially) independently of other groups’ topologies.
With 37 counts, they are primarily used for the visu-
alization of overlapping/flat group structure, though
they are also applied to 6 disjoint/flat groupings.
Of these 37 overlapping/flat applications, 14 visual-
ized these multiples interchangeably, such as (Erten
et al., 2004)’s GraphAEL, and 19 juxtaposed (Fed-
erico et al., 2011) (Figure 5). Especially for dynamic
graphs, the use of interchangeable multiples, akin to
the mapping of time to time (Beck et al., 2014), is a
popular choice, with 12 of the 14 interchangeable pa-
pers using the visualization of dynamic graphs (Ma
et al., 2015; Rufiange and Melanc¸on, 2014).
If the comparison of two or more graphs is of in-
terest, the juxtaposition of subgraphs as multiples al-
lows for a clear and uncluttered view of their differ-
ences, as seen in the works of (Yoghourdjian et al.,
2018), (Bach et al., 2015), and (Behrisch et al., 2014).
IVAPP 2024 - 15th International Conference on Information Visualization Theory and Applications
704
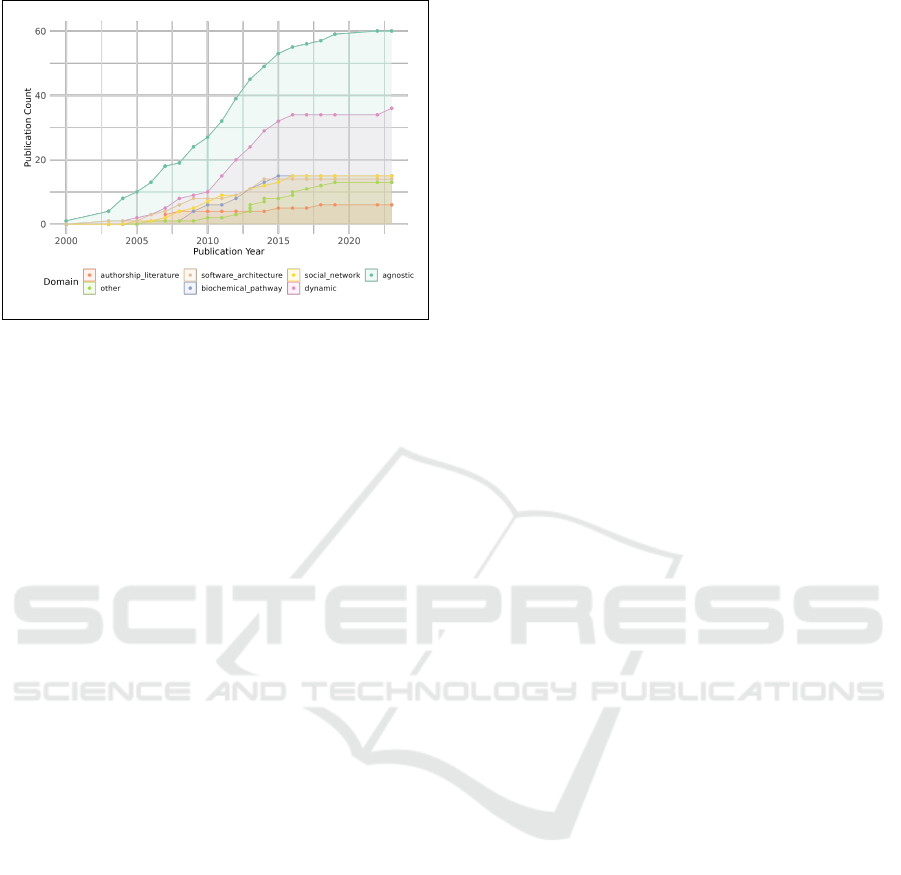
Figure 6: Cumulative number of the selected papers
mapped to application area across time. Papers could map
to multiple such application areas.
However, multiples can also be valuable in provid-
ing users with a small “thumbnail” representation of a
subgraph to aid in exploration (Al-Awami et al., 2014;
Barsky et al., 2008).
Lastly, beyond such 2D arrangements, 3 papers
opted to present multiples in embedded relationships.
Here, multiples are presented in 3D “cubes”, formed
by arranging them independently as seen in Matrix-
Cubes (Bach et al., 2014b), or arranging them in a jux-
taposed manner as seen in Caleydo (Lex et al., 2010).
6 OUTSTANDING
OPPORTUNITIES
Enter the Matrix. Adjacency matrices are used to
visually communicate graph topology, which is ex-
pected given their advantages over common node-link
diagrams (Ghoniem et al., 2004). Surprisingly ma-
trices, despite being a straightforward and scalable
method for the visualization of group structure, are
hardly used (Figure 5). Though, it should also be
mentioned that some hybrid techniques, most notably
NodeTrix (Henry et al., 2007) and Anchord+Matrix
Diagrams (Misue and Zhou, 2011), combine topo-
logical adjacency matrices and node-link diagrams to
communicate topology and structure simultaneously.
This has also been noted by (Nobre et al., 2019)
within the context of multivariate graphs, (Beck et al.,
2014) within the context of dynamic graphs, as well
as (Alsallakh et al., 2016) within the context of set-
typed data visualization. We also see ample opportu-
nity to reap the benefits of (interactive) matrix visu-
alization for the communication of compound graph
group structures, as they are simple to implement and
understand.
Putting Some Node-Link Diagrams in Your Node-
Link Diagrams. Somewhat surprisingly, bipartite
node-link diagrams are infrequently used to commu-
nicate group structure, be it embedded or separately
(Figure 5). Similar to trees (Section 5), it is pos-
sible that the additional complexity introduced by a
second set of nodes for groups and edges, represent-
ing group memberships, simply makes them unsuit-
able for graphs with more complex topologies. In-
deed, as seen in the works of (Bigelow et al., 2019),
(Ahmed et al., 2007) and (Pienta et al., 2018), the
graphs studied are relatively small and simple. More-
over, color and/or shape are necessary to distinguish
between topological and group nodes, further adding
visual complexity. Nonetheless, this particular gap
strikes us as worth investigating with scalable, and
presumably interactive, bipartite node-link diagrams
that combine topology and group structure in a sin-
gle embedding. Specifically, for more clustered group
structures, this could potentially allow for very clear
visual distinctions between nodes that map to exclu-
sively one group, and those that map to multiple.
Looking for Group. Mirroring the finding of
(Vehlow et al., 2015) Disjoint/Flat and Dis-
joint/Hierarchical are well represented with 48 and
58 papers, respectively, and the Overlapping/Flat cat-
egory is the most represented with 79 entries. Inter-
estingly, only 7 of the collected papers were applied to
Overlapping/Hierarchical group structure (Figure 4).
Most such papers opted to visualize only two or
three group hierarchies at a time, usually separately,
and link these to the graph’s topology using either
color (Wang et al., 2016) or edges (Daniel et al.,
2014). Since overlapping, hierarchical groupings are
common in ontologies and clusterings (Vehlow et al.,
2015), we see a great opportunity to tackle the chal-
lenges that such group structures present in the con-
text of compound graphs, such as how to concurrently
visualize different levels of the overlapping hierar-
chies, or how to best visualize each node’s mapping
to multiple categories of different hierarchies.
Yeah, It’s a Hybrid. 16 hybrid visualization tech-
niques (defined as any combination of visual encod-
ings) were found in our paper set (Figure 5). Interest-
ingly, however, all collected hybrid techniques com-
bine specifically node-link diagrams with other visu-
alization encodings, such as i) matrices (Henry et al.,
2007; Misue and Zhou, 2011; Bach et al., 2013), ii)
treemaps (Balzer and Deussen, 2005), iii) bounded
node-link diagram embeddings (Vehlow et al., 2013;
Chaturvedi et al., 2014), and iv) chord diagrams (An-
gori et al., 2022). However, node-link diagrams are
Visualizing Group Structure in Compound Graphs: The Current State, Lessons Learned, and Outstanding Opportunities
705

known to suffer from certain visual aesthetic limita-
tions that can make them difficult to read when ap-
plied naively to larger and complex graphs, such as
node/node occlusions, heterogeneous node density,
edge crossings, or incident edge angles. Here, we
see an opportunity for interesting and novel hybrid vi-
sualization strategies with which to communicate the
group structure of compound graphs that go beyond
node-link diagrams, thereby potentially opening the
door for more visually scalable approaches.
Brave New Worlds. Certain application domains
are notably more represented than others in the paper
set collected (Figure 6). More specifically, domain-
agnostic techniques and dynamic graphs appear to far
outnumber all others. Application areas, such as au-
thorship and citation networks, appear not to have
been studied as extensively or recently. Often, as seen
in biochemical application areas, a particular applica-
tion area is constrained by the visual conventions of
the domain and/or the (perceived) visual literacy of
its users (Lex et al., 2010; Partl et al., 2013). This
points, at least in our estimation, to an opportunity
to revisit such domains, to identify potentially unan-
swered challenges.
7 CONCLUSION & FUTURE
WORK
We have surveyed literature based on both an in-
dependent collection of references, and the existing
works of (Nobre et al., 2019), (McGee et al., 2019),
(Beck et al., 2014), and (Vehlow et al., 2015). The
collected corpus of application and technique papers
were then categorized within a comprehensive tax-
onomy that, inspired by the works of (Kim et al.,
2017) and (Alsallakh et al., 2016), disentangles the
visual relationship between the graph’s topology and
group structure, as well as the chosen visual encod-
ing of the graph’s group structure, respectively. Based
on this classification of literature, several lessons and
outstanding research opportunities were identified: i)
the under-utilization of identity and similarity ma-
trices, ii) the under-representation of bipartite node-
link diagrams, iii) the under-studied visualization of
Overlapping/Hierarchical data sources, iv) the over-
representation of node-link diagram-based hybrid vi-
sualization approaches, and v) the under-studied of
certain application domains. A future elaboration of
this paper in the shape of a formal state-of-the-art re-
port should aim for a completely independent, large-
scale collection of literature, and/or the collection of
additional authoritative reviews to avoid any possible
bias in the collected corpus of literature to, in turn,
draw potentially broader and more general conclu-
sions.
REFERENCES
Abello, J., Kobourov, S. G., and Yusufov, R. (2005). Visu-
alizing Large Graphs with Compound-Fisheye Views
and Treemaps. In Pach, J., editor, Graph Drawing,
Lecture Notes in Computer Science, pages 431–441,
Berlin, Heidelberg. Springer.
Abello, J., van Ham, F., and Krishnan, N. (2006). ASK-
GraphView: A Large Scale Graph Visualization Sys-
tem. IEEE Transactions on Visualization and Com-
puter Graphics, 12(5):669–676. Conference Name:
IEEE Transactions on Visualization and Computer
Graphics.
Adomavicius, G. and Bockstedt, J. (2008). C-TREND:
Temporal Cluster Graphs for Identifying and Visualiz-
ing Trends in Multiattribute Transactional Data. IEEE
Transactions on Knowledge and Data Engineering,
20(6):721–735. Conference Name: IEEE Transac-
tions on Knowledge and Data Engineering.
Ahmed, A., Batagelj, V., Fu, X., Hong, S.-h., Merrick, D.,
and Mrvar, A. (2007). Visualisation and analysis of
the internet movie database. In 2007 6th International
Asia-Pacific Symposium on Visualization, pages 17–
24.
Al-Awami, A. K., Beyer, J., Strobelt, H., Kasthuri, N.,
Lichtman, J. W., Pfister, H., and Hadwiger, M. (2014).
NeuroLines: A Subway Map Metaphor for Visualiz-
ing Nanoscale Neuronal Connectivity. IEEE Trans-
actions on Visualization and Computer Graphics,
20(12):2369–2378.
Alper, B., Riche, N., Ramos, G., and Czerwinski, M.
(2011). Design Study of LineSets, a Novel Set Vi-
sualization Technique. IEEE Transactions on Visual-
ization and Computer Graphics, 17(12):2259–2267.
Alsallakh, B., Micallef, L., Aigner, W., Hauser, H., Miksch,
S., and Rodgers, P. (2016). The State-of-the-Art of Set
Visualization. Computer Graphics Forum, 35(1):234–
260.
Angori, L., Didimo, W., Montecchiani, F., Pagliuca, D.,
and Tappini, A. (2019). ChordLink: A New Hybrid
Visualization Model. In Graph Drawing and Net-
work Visualization: 27th International Symposium,
GD 2019, Prague, Czech Republic, September 17–20,
2019, Proceedings, pages 276–290, Berlin, Heidel-
berg. Springer-Verlag.
Angori, L., Didimo, W., Montecchiani, F., Pagliuca, D., and
Tappini, A. (2022). Hybrid Graph Visualizations With
ChordLink: Algorithms, Experiments, and Applica-
tions. IEEE Transactions on Visualization and Com-
puter Graphics, 28(2):1288–1300.
Archambault, D., Munzner, T., and Auber, D. (2007a).
Grouse: Feature-Based, Steerable Graph Hierarchy
Exploration. In EuroVis, volume 2007, pages 67–74.
Archambault, D., Munzner, T., and Auber, D. (2007b).
TopoLayout: Multilevel Graph Layout by Topologi-
IVAPP 2024 - 15th International Conference on Information Visualization Theory and Applications
706

cal Features. IEEE Transactions on Visualization and
Computer Graphics, 13(2):305–317.
Bach, B., Henry-Riche, N., Dwyer, T., Madhyastha, T.,
Fekete, J.-D., and Grabowski, T. (2015). Small Mul-
tiPiles: Piling Time to Explore Temporal Patterns
in Dynamic Networks. Computer Graphics Forum,
34(3):31–40.
Bach, B., Pietriga, E., and Fekete, J.-D. (2014a). GraphDi-
aries: Animated Transitions andTemporal Navigation
for Dynamic Networks. IEEE Transactions on Visu-
alization and Computer Graphics, 20(5):740–754.
Bach, B., Pietriga, E., and Fekete, J.-D. (2014b). Visualiz-
ing dynamic networks with matrix cubes. In Proceed-
ings of the SIGCHI Conference on Human Factors in
Computing Systems, CHI ’14, pages 877–886, New
York, NY, USA. Association for Computing Machin-
ery.
Bach, B., Pietriga, E., and Liccardi, I. (2013). Visualizing
Populated Ontologies with OntoTrix:. International
Journal on Semantic Web and Information Systems,
9(4):17–40.
Balzer, M. and Deussen, O. (2005). Exploring Relations
within Software Systems Using Treemap Enhanced
Hierarchical Graphs. In 3rd IEEE International Work-
shop on Visualizing Software for Understanding and
Analysis, pages 1–6.
Barsky, A., Munzner, T., Gardy, J., and Kincaid, R. (2008).
Cerebral: Visualizing Multiple Experimental Condi-
tions on a Graph with Biological Context. IEEE
Transactions on Visualization and Computer Graph-
ics, 14(6):1253–1260.
Beck, F., Burch, M., Diehl, S., and Weiskopf, D. (2014).
The State of the Art in Visualizing Dynamic Graphs.
In EuroVis - STARs. The Eurographics Association.
Behrisch, M., Davey, J., Fischer, F., Thonnard, O., Schreck,
T., Keim, D., and Kohlhammer, J. (2014). Visual
Analysis of Sets of Heterogeneous Matrices Using
Projection-Based Distance Functions and Semantic
Zoom. Computer Graphics Forum, 33(3):411–420.
Bigelow, A., Nobre, C., Meyer, M., and Lex, A. (2019). Ori-
graph: Interactive Network Wrangling. In 2019 IEEE
Conference on Visual Analytics Science and Technol-
ogy (VAST), pages 81–92.
Bothorel, G., Serrurier, M., and Hurter, C. (2013). Visu-
alization of Frequent Itemsets with Nested Circular
Layout and Bundling Algorithm. In Bebis, G., Boyle,
R., Parvin, B., Koracin, D., Li, B., Porikli, F., Zordan,
V., Klosowski, J., Coquillart, S., Luo, X., Chen, M.,
and Gotz, D., editors, Advances in Visual Computing,
Lecture Notes in Computer Science, pages 396–405,
Berlin, Heidelberg. Springer.
Burch, M., Schmidt, B., and Weiskopf, D. (2013). A
Matrix-Based Visualization for Exploring Dynamic
Compound Digraphs. In 2013 17th International Con-
ference on Information Visualisation, pages 66–73.
ISSN: 2375-0138.
Chaturvedi, S., Dunne, C., Ashktorab, Z., Zachariah, R.,
and Shneiderman, B. (2014). Group-in-a-Box Meta-
Layouts for Topological Clusters and Attribute-Based
Groups: Space-Efficient Visualizations of Network
Communities and Their Ties. Computer Graphics Fo-
rum, 33(8):52–68.
Chuang, J., Manning, C. D., and Heer, J. (2012). Ter-
mite: visualization techniques for assessing textual
topic models. In Proceedings of the International
Working Conference on Advanced Visual Interfaces,
AVI ’12, pages 74–77, New York, NY, USA. Associ-
ation for Computing Machinery.
Daniel, D. T., Wuchner, E., Sokolov, K., Stal, M.,
and Liggesmeyer, P. (2014). Polyptychon: A
Hierarchically-Constrained Classified Dependencies
Visualization. In 2014 Second IEEE Working Con-
ference on Software Visualization, pages 83–86.
De Domenico, M., Porter, M. A., and Arenas, A. (2015).
MuxViz: a tool for multilayer analysis and visual-
ization of networks. Journal of Complex Networks,
3(2):159–176.
Dinkla, K., El-Kebir, M., Bucur, C.-I., Siderius, M., Smit,
M. J., Westenberg, M. A., and Klau, G. W. (2014).
eXamine: Exploring annotated modules in networks.
BMC Bioinformatics, 15(1):201.
Dinkla, K., van Kreveld, M. J., Speckmann, B., and West-
enberg, M. A. (2012). Kelp Diagrams: Point Set
Membership Visualization. Computer Graphics Fo-
rum, 31(3pt1):875–884.
Dunne, C. and Shneiderman, B. (2013). Motif simplifi-
cation: improving network visualization readability
with fan, connector, and clique glyphs. In Proceed-
ings of the SIGCHI Conference on Human Factors in
Computing Systems, CHI ’13, pages 3247–3256, New
York, NY, USA. Association for Computing Machin-
ery.
Efrat, A., Hu, Y., Kobourov, S. G., and Pupyrev, S.
(2014). MapSets: Visualizing Embedded and Clus-
tered Graphs. In Duncan, C. and Symvonis, A., edi-
tors, Graph Drawing, Lecture Notes in Computer Sci-
ence, pages 452–463, Berlin, Heidelberg. Springer.
Erten, C., Harding, P. J., Kobourov, S. G., Wampler, K.,
and Yee, G. (2004). GraphAEL: Graph Animations
with Evolving Layouts. In Liotta, G., editor, Graph
Drawing, Lecture Notes in Computer Science, pages
98–110, Berlin, Heidelberg. Springer.
Federico, P., Aigner, W., Miksch, S., Windhager, F., and
Zenk, L. (2011). A visual analytics approach to dy-
namic social networks. In Proceedings of the 11th
International Conference on Knowledge Management
and Knowledge Technologies, i-KNOW ’11, pages 1–
8, New York, NY, USA. Association for Computing
Machinery.
Ghoniem, M., Fekete, J.-D., and Castagliola, P. (2004).
A Comparison of the Readability of Graphs Using
Node-Link and Matrix-Based Representations. In
IEEE Symposium on Information Visualization, pages
17–24. ISSN: 1522-404X.
Henry, N., Fekete, J.-D., and McGuffin, M. J. (2007).
NodeTrix: a Hybrid Visualization of Social Networks.
IEEE Transactions on Visualization and Computer
Graphics, 13(6):1302–1309.
Jusufi, I., Kerren, A., and Zimmer, B. (2013). Multivari-
ate Network Exploration with JauntyNets. In 2013
17th International Conference on Information Visual-
isation, pages 19–27. ISSN: 2375-0138.
Kim, K., Carlis, J. V., and Keefe, D. F. (2017). Comparison
techniques utilized in spatial 3D and 4D data visual-
Visualizing Group Structure in Compound Graphs: The Current State, Lessons Learned, and Outstanding Opportunities
707

izations: A survey and future directions. Computers
& Graphics, 67:138–147.
Kivel
¨
a, M., Arenas, A., Barthelemy, M., Gleeson, J. P.,
Moreno, Y., and Porter, M. A. (2014). Multilayer net-
works. Journal of Complex Networks, 2(3):203–271.
Krzywinski, M., Birol, I., Jones, S. J., and Marra, M. A.
(2012). Hive plots—rational approach to visualiz-
ing networks. Briefings in Bioinformatics, 13(5):627–
644.
Lex, A., Partl, C., Kalkofen, D., Streit, M., Gratzl, S.,
Wassermann, A. M., Schmalstieg, D., and Pfister, H.
(2013). Entourage: Visualizing Relationships be-
tween Biological Pathways using Contextual Subsets.
IEEE Transactions on Visualization and Computer
Graphics, 19(12):2536–2545.
Lex, A., Streit, M., Kruijff, E., and Schmalstieg, D. (2010).
Caleydo: Design and evaluation of a visual analysis
framework for gene expression data in its biological
context. In 2010 IEEE Pacific Visualization Sympo-
sium (PacificVis), pages 57–64. ISSN: 2165-8773.
Ma, C., Kenyon, R. V., Forbes, A. G., Berger-Wolf, T.,
Slater, B. J., and Llano, D. A. (2015). Visualizing
Dynamic Brain Networks Using an Animated Dual-
Representation. In EuroVis Short Papers, pages 73–
77.
McGee, F., Ghoniem, M., Melanc¸on, G., Otjacques, B., and
Pinaud, B. (2019). The State of the Art in Multilayer
Network Visualization. Computer Graphics Forum,
38(6):125–149.
Mesa-Arango, R. and Ukkusuri, S. V. (2015). Demand
clustering in freight logistics networks. Transporta-
tion Research Part E: Logistics and Transportation
Review, 81:36–51.
Meulemans, W., Riche, N. H., Speckmann, B., Alper, B.,
and Dwyer, T. (2013). KelpFusion: A Hybrid Set Vi-
sualization Technique. IEEE Transactions on Visual-
ization and Computer Graphics, 19(11):1846–1858.
Misue, K. and Zhou, Q. (2011). Drawing Semi-bipartite
Graphs in Anchor+Matrix Style. In 2011 15th In-
ternational Conference on Information Visualisation,
pages 26–31. ISSN: 2375-0138.
Nakazawa, R., Itoh, T., Sese, J., and Terada, A. (2012).
Integrated Visualization of Gene Network and On-
tology Applying a Hierarchical Graph Visualization
Technique. In 2012 16th International Conference on
Information Visualisation, pages 81–86. ISSN: 2375-
0138.
Nobre, C., Meyer, M., Streit, M., and Lex, A. (2019). The
State of the Art in Visualizing Multivariate Networks.
Computer Graphics Forum, 38(3):807–832.
Paduano, F. and Forbes, A. G. (2015). Extended LineSets:
a visualization technique for the interactive inspection
of biological pathways. BMC Proceedings, 9(6):S4.
Partl, C., Lex, A., Streit, M., Kalkofen, D., Kashofer, K.,
and Schmalstieg, D. (2013). enRoute: dynamic path
extraction from biological pathway maps for explor-
ing heterogeneous experimental datasets. BMC Bioin-
formatics, 14(19):S3.
Perer, A. and Sun, J. (2012). MatrixFlow: Temporal Net-
work Visual Analytics to Track Symptom Evolution
during Disease Progression. AMIA Annual Sympo-
sium Proceedings, 2012:716–725.
Pienta, R., Hohman, F., Endert, A., Tamersoy, A., Roundy,
K., Gates, C., Navathe, S., and Chau, D. H. (2018).
VIGOR: Interactive Visual Exploration of Graph
Query Results. IEEE Transactions on Visualization
and Computer Graphics, 24(1):215–225.
Pretorius, A. J. and Van Wijk, J. J. (2006). Visual Anal-
ysis of Multivariate State Transition Graphs. IEEE
Transactions on Visualization and Computer Graph-
ics, 12(5):685–692.
Renoust, B., Melanc¸on, G., and Munzner, T. (2015). Detan-
gler: Visual Analytics for Multiplex Networks. Com-
puter Graphics Forum, 34(3):321–330.
Rodgers, P., Stapleton, G., and Chapman, P. (2015). Visual-
izing Sets with Linear Diagrams. ACM Transactions
on Computer-Human Interaction, 22(6):27:1–27:39.
Rufiange, S., McGuffin, M. J., and Fuhrman, C. P. (2012).
TreeMatrix: A Hybrid Visualization of Compound
Graphs. Computer Graphics Forum, 31(1):89–101.
Rufiange, S. and Melanc¸on, G. (2014). AniMatrix: A
Matrix-Based Visualization of Software Evolution. In
2014 Second IEEE Working Conference on Software
Visualization, pages 137–146.
Sallaberry, A., Zaidi, F., Pich, C., and Melanc¸on, G.
(2010). Interactive Visualization and Navigation of
Web Search Results Revealing Community Structures
and Bridges. In Proceedings of Graphics Interface,
pages 105–112.
Sprenger, T., Brunella, R., and Gross, M. (2000). H-BLOB:
a hierarchical visual clustering method using implicit
surfaces. In Proceedings Visualization 2000. VIS 2000
(Cat. No.00CH37145), pages 61–68.
Telea, A. and Auber, D. (2008). Code Flows: Visualiz-
ing Structural Evolution of Source Code. Computer
Graphics Forum, 27(3):831–838.
Vehlow, C., Beck, F., and Weiskopf, D. (2015). The State
of the Art in Visualizing Group Structures in Graphs.
Eurographics Conference on Visualization (EuroVis) -
STARs, page 20 pages.
Vehlow, C., Reinhardt, T., and Weiskopf, D. (2013). Visu-
alizing Fuzzy Overlapping Communities in Networks.
IEEE Transactions on Visualization and Computer
Graphics, 19(12):2486–2495.
Wang, X., Liu, S., Liu, J., Chen, J., Zhu, J., and Guo, B.
(2016). TopicPanorama: A Full Picture of Relevant
Topics. IEEE Transactions on Visualization and Com-
puter Graphics, 22(12):2508–2521.
Xia, J., Gill, E. E., and Hancock, R. E. W. (2015). Net-
workAnalyst for statistical, visual and network-based
meta-analysis of gene expression data. Nature Proto-
cols, 10(6):823–844.
Yoghourdjian, V., Dwyer, T., Klein, K., Marriott, K., and
Wybrow, M. (2018). Graph Thumbnails: Identifying
and Comparing Multiple Graphs at a Glance. IEEE
Transactions on Visualization and Computer Graph-
ics, 24(12):3081–3095.
Zhou, H., Xu, P., and Qu, H. (2015). Visualization of bi-
partite relations between graphs and sets. Journal of
Visualization, 18(2):159–172.
IVAPP 2024 - 15th International Conference on Information Visualization Theory and Applications
708
