Image Augmentation Preserving Object Parts Using Superpixels of
Variable Granularity
D. Sun
1 a
and F. Dornaika
1,2 b
1
University of the Basque Country UPV/EHU, San Sebastian, Spain
2
IKERBASQUE, Basque Foundation for Science, Bilbao, Spain
Keywords:
Data Augmentation, Image Classification, Superpixel, CutMix, Attention, Object-Part.
Abstract:
Methods employing regional dropout data augmentation, especially those employing a cut-and-paste approach,
have proven highly effective in addressing overfitting challenges arising from limited data. However, exist-
ing cutmix-based augmentation strategies face issues related to the loss of contour details and discrepancies
between augmented images and their associated labels. In this study, we introduce a novel end-to-end cutmix-
based data augmentation method, incorporating the blending of images with discriminative superpixels of
diverse granularity. Our experiments for classification tasks reveal outstanding performance across various
benchmarks and deep neural network models.
1 INTRODUCTION
Data augmentation is significant in alleviating the is-
sue of insufficient data. One of the heated research
fields is regional dropout regularization data augmen-
tation (Yu et al., 2021). Unlike incipient dropout regu-
larizations that operate on the model by randomly de-
activating the nodes of CNNs (Srivastava et al., 2014),
regional dropout regularization algorithms improve
the generalization performance from the perspective
of data. By regional hiding and occlusion in the train-
ing samples, DNNs are forced to see not only the
most discriminative regions but learn the whole im-
age with boosted generalization ability. Some classi-
cal regional dropout regularization data augmentation
are: CutOut (DeVries and Taylor, 2017) hides random
square region using value zero within one training im-
age. Mixup (Zhang et al., 2018) randomly mixes two
training images pixel by pixel. CutMix (Yun et al.,
2019) occupies a random square region using the lo-
cal part from another training image. CutOut leads to
loss of information reasoned from augmenting within
one image. Mixup has poor interpretability because
of pixel-by-pixel mixing. CutMix cuts regions of the
source image and then pastes them onto the target im-
age, which compensates for the shortcomings of the
former two.
a
https://orcid.org/0000-0001-6038-8068
b
https://orcid.org/0000-0001-6581-9680
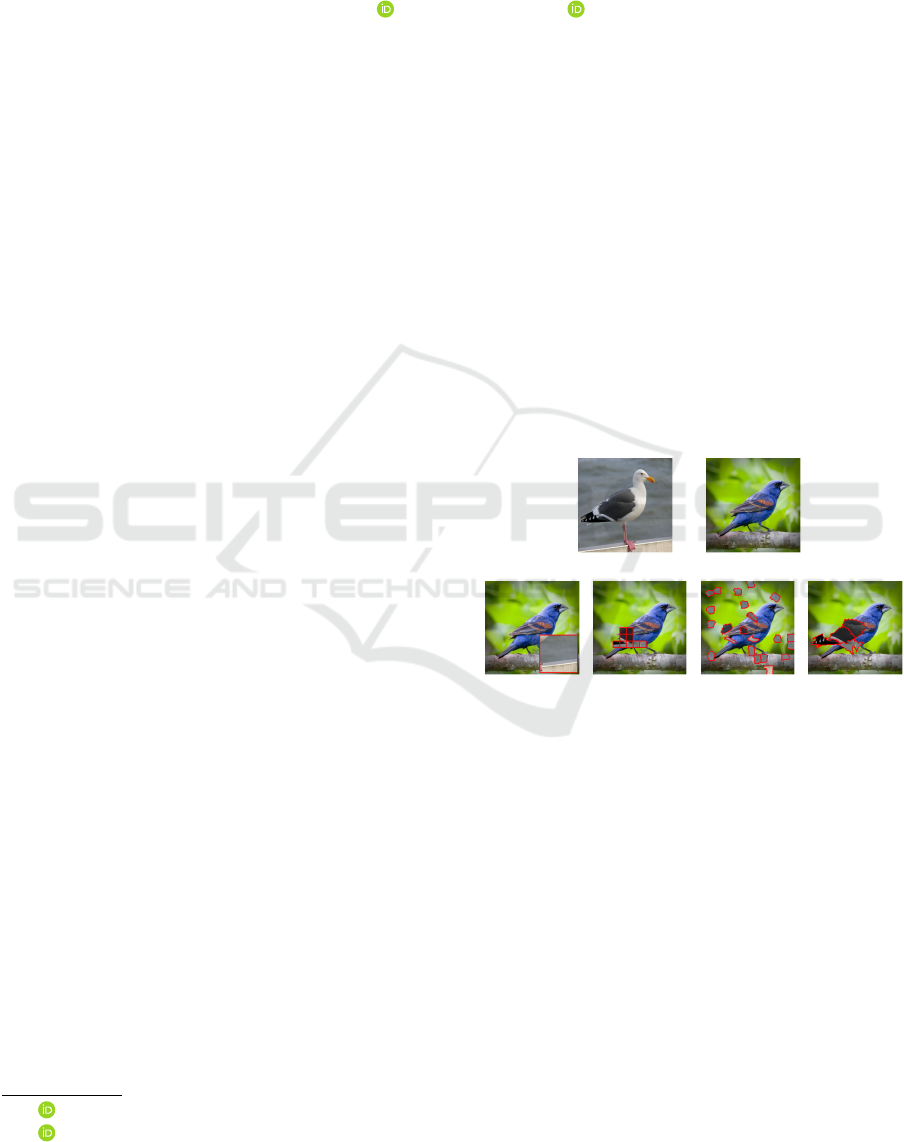
(a) (b)
(c) (d) (e) (f)
Figure 1: Visual comparison of possible augmented im-
ages from some representative cutmix-based augmentation
methods. (a) Source image. (b) Target image. (c) Aug-
mented image from CutMix (Yun et al., 2019), which loses
contour information by capturing only square regions and
introduces background noise; (d) Augmented image from
Attentive CutMix (Walawalkar et al., 2020), which also
loses contour information by mixing discriminative square
regions with a pre-trained model. (e) Random Super-
pixel GridMix (Hammoudi et al., 2023) mixes with ran-
dom superpixels but introduces background noise. (f) Our
proposed method generates local-part-preserved augmented
images in an end-to-end manner.
Nevertheless, there are three drawbacks to exist-
ing cutmix-based data augmentation methods. (I) Ex-
isting methods operate on square or rectangular re-
gions (Yun et al., 2019; Walawalkar et al., 2020; Baek
et al., 2021; Park et al., 2022), resulting in the loss
of contour information, and further lead to the loss of
710
Sun, D. and Dornaika, F.
Image Augmentation Preserving Object Parts Using Superpixels of Variable Granularity.
DOI: 10.5220/0012430800003660
Paper published under CC license (CC BY-NC-ND 4.0)
In Proceedings of the 19th International Joint Conference on Computer Vision, Imaging and Computer Graphics Theory and Applications (VISIGRAPP 2024) - Volume 2: VISAPP, pages
710-717
ISBN: 978-989-758-679-8; ISSN: 2184-4321
Proceedings Copyright © 2024 by SCITEPRESS – Science and Technology Publications, Lda.

complete local-part information in the data augmenta-
tion. (II) Existing approaches often suffer from mis-
match problems between the augmented images and
their corresponding labels. Many works overlook that
labels are influenced differently by the background
and object regions when choosing the mixed regions
randomly(Yun et al., 2019; Baek et al., 2021; Ham-
moudi et al., 2023). (III) When resorting to attention
or saliency information to identify discriminative re-
gions, the incorporation of supplementary modules or
pre-trained models is typically required (Uddin et al.,
2020; Walawalkar et al., 2020).
To address the aforementioned drawbacks, we
propose a novel data augmentation method, Oc-
CaMix, a cutmix-based object-part-preserved data
augmentation method. As indicated in Fig. 1, com-
pared to Fig. 1c and Fig. 1d, our proposed method
in Fig. 1f preserves the contour information. Com-
pared to Fig. 1c and Fig. 1e, our method captures
object-centric regions, avoiding the issue of mismatch
between the augmented image and its corresponding
label. Compared to Fig. 1d, our method requires no
pre-trained model and preserves the contours.
The following is a summary of our principal con-
tributions:
• We discuss the potential drawbacks of current
cutmixed-based data augmentation methods.
• We propose an end-to-end attention-guided
cutmix-based data augmentation method with-
out additional training modules. To the best of
our knowledge, it’s the first time that an object-
part-preserved regional dropout data augmenta-
tion strategy has been proposed, which can pre-
serve the contour information of the object-centric
local parts.
• We propose a solution that randomly selects
superpixels of varying granularity and contour
bounds in attention-guided discriminative local
regions. Our approach balances both augmenta-
tion diversity and object concentration.
• Extensive experiments have been conducted to
evaluate the superiority of our proposed method
with multiple dataset benchmarks and CNN struc-
tures.
2 RELATED WORK
2.1 Data Augmentation
Data augmentation enables creating more diverse im-
ages, boosting the model’s performance in vision
tasks. Base augmentation approaches often involve
utilizing techniques such as random flipping, crop-
ping, and scaling (He et al., 2016). Many regional
dropout data augmentation methods have demon-
strated excellent generalization performance. Cutout
(DeVries and Taylor, 2017) removes randomly se-
lected square regions, resulting in loss of informa-
tion. Mixup (Zhang et al., 2018) combines two im-
ages pixel-by-pixel, but lacks interpretability. CutMix
(Yun et al., 2019)randomly selects and cuts square
regions from one image and pastes them onto an-
other image, causing mismatches when chosen re-
gions come from the background and contour infor-
mation loss. To solve the mismatch issue between
the augmented image and its label, Attentive CutMix
(Walawalkar et al., 2020) proposes to choose square
patches depending on attention from a pre-trained
model. SaliencyMix (Uddin et al., 2020) suggests us-
ing saliency information to choose square areas. Re-
sizeMix (Qin et al., 2020) shows cutting and pasting
the whole source image at random sizes. In Grid-
Mix (Baek et al., 2021), images are first divided into
square grids of N × N square patches. Then, patches
of the two images are randomly mixed, to train with
local patch classification loss and global classification
loss. Contour information is preserved in Random Su-
perpixel GridMix (Hammoudi et al., 2023), which si-
multaneously brings the background noise. The ran-
dom selection of local regions leads to diversity but
also introduces background noise. Concentrating on
the image object reduces the background noise but
also sacrifices diversity. Our proposed method mixes
two images with discriminative superpixels of varying
granularity, which balances the augmentation diver-
sity and object concentration and preserves the object-
part information in an end-to-end training manner.
3 OBJECT-PART-PRESERVED
CutMix
3.1 Algorithm
Our framework is depicted in Fig. 2. Assume any
training image x ∈ R
W ×H×C
, and its associated one-
hot label y. The image’s height and width are in-
dicated by W and H, respectively. The number of
channels is C. We aim to create the augmented sam-
ple (
e
x,
e
y) from two random training samples (x
1
,y
1
),
(x
2
,y
2
). Like CutMix (Yun et al., 2019), the definition
of the cutmix operation is as follows:
e
x = (1 − M) ⊙ x
1
+ M ⊙ x
2
e
y = (1 − λ) y
1
+ λy
2
(1)
Image Augmentation Preserving Object Parts Using Superpixels of Variable Granularity
711
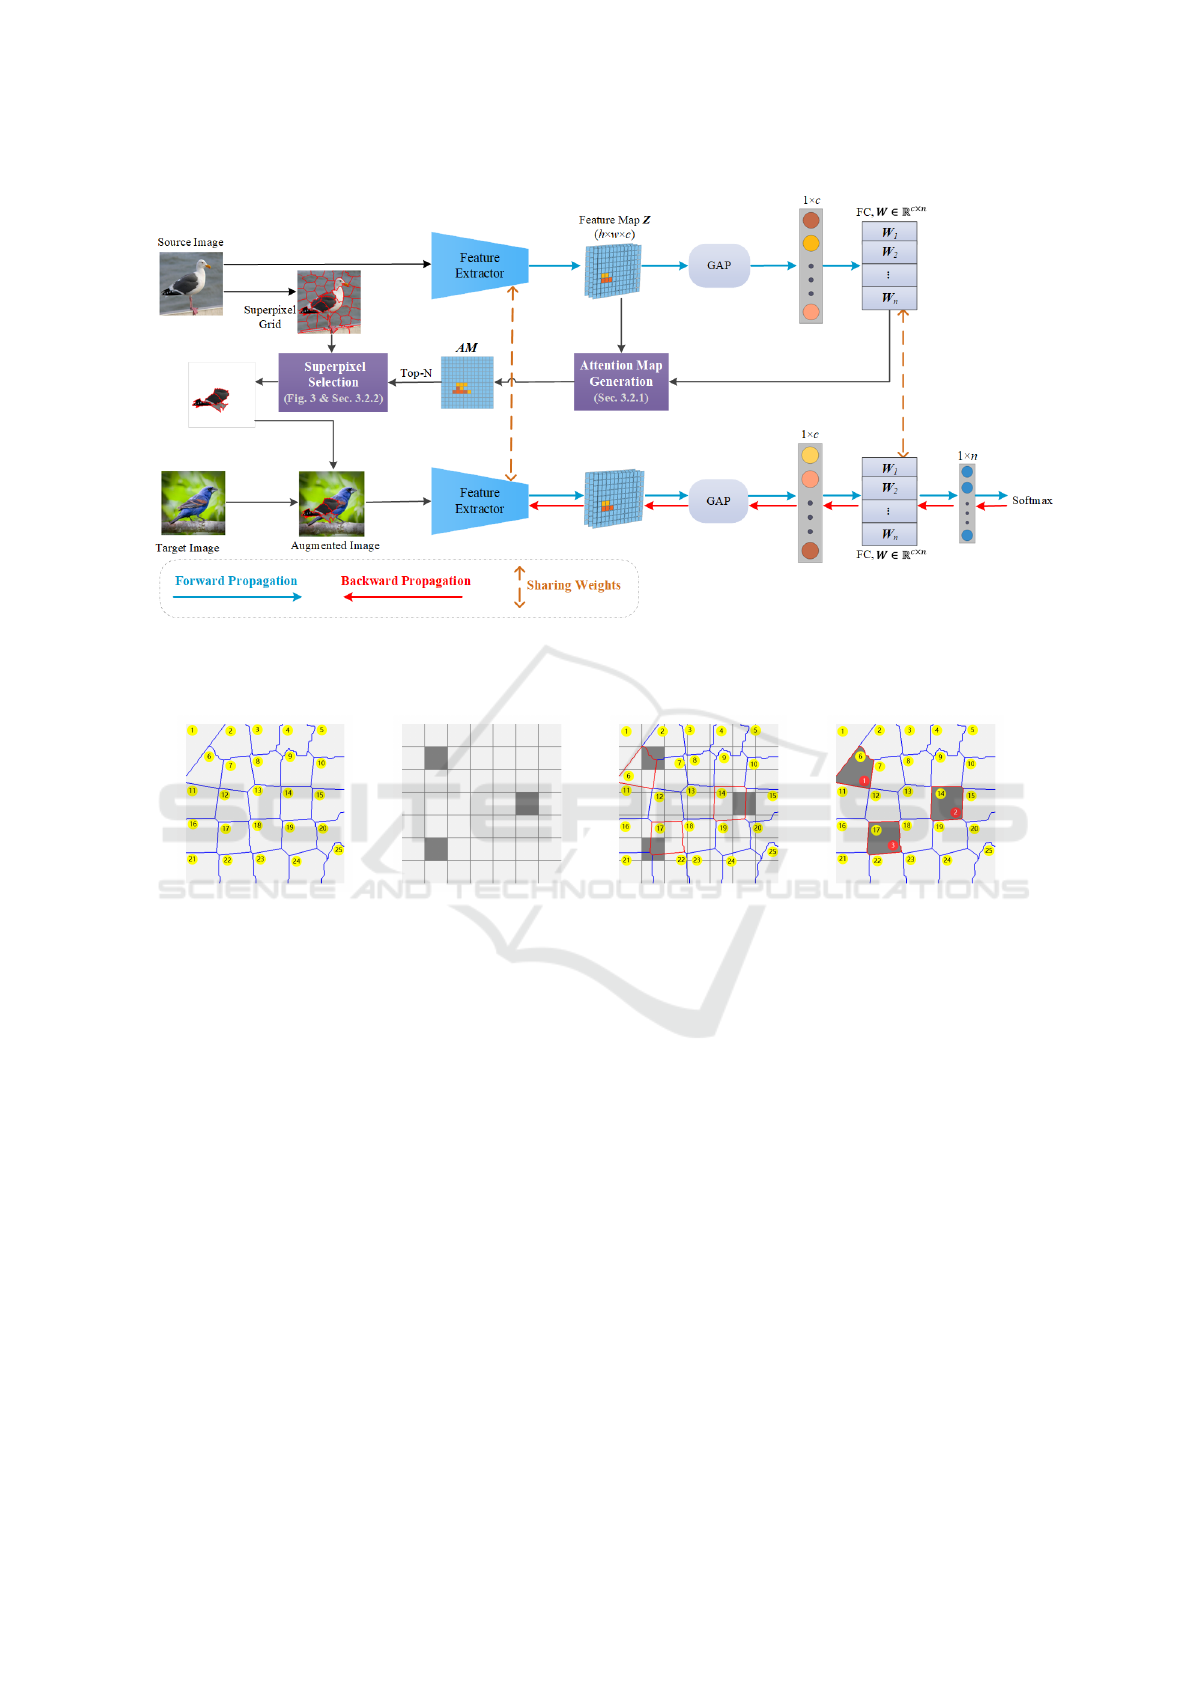
Figure 2: Illustration of the framework. Source image inputs a frozen model to generate AM (attention map) with no back-
propagation. Guided by the generated AM (attention map, Sec. 3.1.1) we cut the most discriminative superpixels of the source
image (Fig. 3 and Sec. 3.1.2) and paste them onto the target image to mix for an augmented image. Then augmented images
input and train the same model with backpropagation.
(a) (b) (c) (d)
Figure 3: Selection of discriminative superpixels. (a) Superpixel grid of 25 superpixel regions; (b) Square grid of 7 ×7 square
patches with N = 3 selected discriminative square patches. (c) Matching of (a) and (b) for discriminative superpixel selection.
(d) 3 selected discriminative superpixels. Note that the final number of chosen superpixels may be same as or fewer than the
number of discriminative square patches due to possible duplication among superpixels.
where 1 is a mask filled with ones, ⊙ indicates
element-wise multiplication, and M ∈ {0,1}
W ×H
in-
dicates a binary mask showing the belonging of each
pixel (the pixels comes from x
1
or x
2
). The ratio of
pixels copied from x
2
into x
1
to the total number of
pixels in x
1
is shown by λ.
3.1.1 Method to Generate Attention Map
The augmented attention map AM ∈ R
w×h
may be
defined in Eq. 2.
AM = max
(
M
k
=
c
∑
i=1
W
ki
Z
i
∈ R
w×h
)|k = 1,2,...,n
)
(2)
Denote the fully connected layer’s classification
weights W ∈ R
c×n
, and the feature map of the source
image Z ∈ R
w×h×c
. The feature map’s width, height
and channel are denoted by w, h and c respectively.
The number of classes is n. The term ’max’ indicates
the max-pooling of element-wise attention maps over
the n classes. The attention map corresponding to
class k, M
k
∈ R
w×h
, is used to identify the discrim-
inative local areas.
Motivated by (Feng et al., 2019), we max-pool the
attention maps across all classes, unlike only employ-
ing attention map corresponding to class of ground
truth in (Zhou et al., 2016). Our objectives are to ex-
tract more local characteristics and make the attention
map more resilient to noise. It would be deceptive to
utilize only single ground truth class attention map
as the classification network may predict wrong class
labels. It could be more dependable to employ the
attention map in Eq. (2) by max-pooling for every
class.
VISAPP 2024 - 19th International Conference on Computer Vision Theory and Applications
712

3.1.2 Superpixel Selection
Input : Source Image X of size W × H; Attention
map AM of size w ×h; The number of
selected discriminative patches N;
(q
min
,q
max
): minimum and maximum
number of superpixels
Output: Binary mask M for selected superpixels;
Ratio λ
patch
1
, patch
2
,..., patch
N
← top-N(AM)
loc
1
,loc
2
,...,loc
N
← patch
1
, patch
2
,..., patch
N
/* Select top-N square patches by
attention map in source image */
q ∼ U(q
min
,q
max
)
SuperP-map ← Superpixel segmentation(X,q)
/* Generate the superpixel grid map for
the source image */
super pixel
1
,super pixel
2
,...,superpixel
N
←
loc
1
,loc
2
,...,loc
N
superpixels = filter-
duplication(super pixel
1
,super pixel
2
,...,superpixel
N
)
/* Collect the relevant superpixels for
every patch */
initial M =zeros ([W × H])
for pixel ← 1 to W × H do
if pixel in superpixels then
M[pixel] = 1
end
end
λ = length(superpixels) /(W × H)
Algorithm 1: Superpixel Selection.
After generating the attention map in Sec. 3.1.1, we
select the top-N discriminative square patches of the
image by using the mapping relations between the
source image and the feature map. However, the
patches in square shape result in a loss of contour in-
formation and a lack of augmentation diversity. As
shown in Fig. 3, we select the superpixels which
overlap most with the selected discriminative patches.
In this way, we preserve the contour information,
thus the object-part information for augmentation is
preserved. Furthermore, we generate the superpixel
grids in varying granularities by randomly choosing
the number of superpixels q from the uniform dis-
tribution U (q
min
,q
max
), and discriminative superpix-
els of changing sizes and shapes can be selected. In
this way, we enhance the augmentation diversity. The
above phase is detailed in Algorithm 1.
4 EXPERIMENTS AND ANALYSIS
4.1 Datasets and Models
The benchmark datasets we used are CIFAR100,
CUB-200-2011 and Stanford Dogs with their stan-
dard splits. Additionally, we utilize the PASCAL
VOC 2005 dataset containing 768 color images.
Our evaluations of OcCaMix are conducted on the
ResNet18, ResNet50, ResNeXt50, EfficientNet-b0
and MobileNet-V2 models.
4.2 Implementation Details
To create the superpixel grid, we employ the SLIC al-
gorithm (Achanta et al., 2012)
1
. We used the Cross-
Entropy loss for classification. For the CIAFR100
dataset with a resolution of 32 × 32, random horizon-
tal flipping and random cropping for 32 with padding
4 are the base augmentations. The batch size is 32,
and the learning rate is degraded by 0.1 per 60 epochs
from an initial value of 0.01. While when the im-
age size is 224 × 224 for CIFAR100, random rotation
and center cropping are the base augmentations. The
batch size is 32, and the learning rate is decayed by
0.1 per 40 epochs from an initial value of 0.002. The
training images in dataset CUB-200-2011 are firstly
resized to 256 × 256 and then cropped randomly to
size 224 × 224, finally randomly horizontally flipped.
We use a batch size of 8 to train the networks for
ResNet structural training with the initial learning rate
0.001. For the EfficientNet model, an initial learn-
ing rate of 0.005 with the batch size 16 is performed.
The initial learning rate is 0.002 with batch size of
16 for MobileNet-V2 model. Stanford Dogs train-
ing samples are firstly randomly cropped with the ra-
tio (1,1.3), then resized to 224 × 224 and randomly
flipped horizontally. The batch size for Stanford Dogs
is 16 with an initial learning rate 0.01. For PASCAL
VOC dataset, random rotating and center cropping are
performed as the base augmentation. The batch size
is 8 with the initial learning rate 0.0001.
4.3 Results and Analysis
As shown in Tables 1 and 2, our proposed method out-
performs all other compared methods, regardless of
the input image size 32 × 32 or 224 × 224. Notably,
our approach yields increasingly superior results for
smaller input sizes. Specifically, when the input size
for CIFAR100 is 32 ×32 on the ResNet18 model, our
1
https://scikit-image.org/docs/stable/api/skimage.
segmentation.html#skimage.segmentation.slic
Image Augmentation Preserving Object Parts Using Superpixels of Variable Granularity
713
Table 1: Top-1 classification accuracy on CIFAR100 (Input size 32 × 32) with ResNet18, ResNet50 and ResNeXt50.
Methods Parameters
Accuracy
ResNet18 ResNet50 ResNeXt50
Baseline - 78.58% 80.19% 80.67%
CutMix (Yun et al., 2019) - 79.69% 82.31% 83.23%
Attentive CutMix (Walawalkar et al., 2020) N = 3 79.29% 81.78% 82.51%
SaliencyMix (Uddin et al., 2020) - 79.57% 81.82% 82.56%
ResizeMix (Qin et al., 2020) β = 0.8,α = 0.1 79.71% 81.46% 82.34%
GridMix (Baek et al., 2021) grid = 4 × 4,γ = 0.15, p = 0.8 79.45% 81.26% 82.47%
Random Superpixel GridMix (Hammoudi et al., 2023) N = 50,q = 200 79.06% 82.64% 82.22%
Random Superpixel GridMix (Hammoudi et al., 2023) N = 3,q = 16 80.30% 82.07% 83.25%
OcCaMix (Ours) N = 3,q ∼ U(15,50) 81.42% 83.69% 84.01%
Table 2: Top-1 classification accuracy on CIFAR100 (Input size 224 × 224) with ResNet18, ResNet50 and ResNeXt50.
Methods Parameters
Accuracy
ResNet18 ResNet50 ResNeXt50
Baseline - 82.77% 85.00% 86.90%
CutMix (Yun et al., 2019) - 83.52% 86.03% 87.73%
Attentive CutMix (Walawalkar et al., 2020) N = 6 83.46% 86.52% 87.70%
SaliencyMix (Uddin et al., 2020) - 83.24% 85.26% 86.98%
ResizeMix (Qin et al., 2020) β = 0.8,α = 0.1 82.82% 85.17% 87.15%
GridMix (Baek et al., 2021) grid = 7 × 7,γ = 0.15, p = 0.8 83.62% 86.01% 87.13%
Random Superpixel GridMix (Hammoudi et al., 2023) N = 50,q = 200 83.09% 86.48% 87.37%
Random Superpixel GridMix (Hammoudi et al., 2023) N = 6,q = 49 83.40% 86.78% 87.53%
OcCaMix (Ours) N = 6,q ∼ U(25,75) 84.08% 87.11% 87.91%
Table 3: Top-1 classification accuracy on CUB-200-2011 with ResNet18, ResNet50 and ResNeXt50.
Methods Parameters
Accuracy
ResNet18 ResNet50 ResNeXt50
Baseline - 75.56% 79.47% 81.41%
CutMix (Yun et al., 2019) - 76.90% 80.89% 82.63%
Attentive CutMix (Walawalkar et al., 2020) N = 9 76.73% 81.13% 82.34%
SaliencyMix (Uddin et al., 2020) - 76.88% 81.20% 82.81%
ResizeMix (Qin et al., 2020) β = 0.8,α = 0.1 76.23% 81.06% 81.94%
GridMix (Baek et al., 2021) grid = 14 × 14,γ = 0.15, p = 0.8 77.13% 81.25% 82.17%
Random Superpixel GridMix (Hammoudi et al., 2023) N = 50,q = 200 77.58% 82.01% 83.03%
Random Superpixel GridMix (Hammoudi et al., 2023) N = 9,q = 196 76.98% 81.29% 82.19%
OcCaMix (Ours) N = 9,q ∼ U(30,100) 78.40% 82.94% 83.69%
method surpasses the second best by enhancing over-
all performance by 1.12%. The outcomes shown in
Tables 3, 4, and 5 indicate that our method is superior
in fine-grained datasets. Our approach supersedes the
baseline with a 3.47% performance improvement for
CUB-200-2011 utilizing the ResNet50 model. Fur-
thermore, our method significantly enhances perfor-
mance for the PASCAL VOC dataset with ResNet50,
elevating the performance from 88.54% to 89.58% in
Table 6. The bold and the underlined text identifies
the best and the second-best performances in all data
tables, respectively.
5 ABLATION STUDY
5.1 Superpixel Granularity and
Attention
The number of superpixels of an image can be termed
as the superpixel granularity, denoted as q. This con-
cept illustrates the level of detail we are able to cap-
ture in the object’s contour boundaries. In the case of
an image with a fixed size, when the superpixel granu-
larity is large, we are able to generate smaller average
superpixel areas, capturing finer or more detailed in-
formation about the object. Alternatively, when the
superpixel granularity is small, we may lose some
VISAPP 2024 - 19th International Conference on Computer Vision Theory and Applications
714

Table 4: Top-1 classification accuracy on CUB-200-2011 with EfficieNet-b0 and MobileNet-V2.
Methods Parameters
Accuracy
EfficieNet-b0 MobileNet-V2
Baseline - 77.37% 75.73%
CutMix (Yun et al., 2019) - 77.63% 76.16%
Attentive CutMix (Walawalkar et al., 2020) N = 6 77.97% 76.01%
SaliencyMix (Uddin et al., 2020) - 77.68% 76.75%
ResizeMix (Qin et al., 2020) β = 0.8,α = 0.1 77.93% 76.21%
GridMix (Baek et al., 2021) grid = 7 × 7,γ = 0.15, p = 0.8 77.77% 77.47%
Random Superpixel GridMix (Hammoudi et al., 2023) N = 50, q = 200 78.23% 77.27%
Random Superpixel GridMix (Hammoudi et al., 2023) N = 6, q = 49 78.46% 77.13%
OcCaMix (Ours) N = 6, q ∼ U(25,75) 78.99% 77.77%
Table 5: Top-1 classification accuracy on Stanford Dogs with ResNet50.
Methods Parameters Accuracy on R50
Baseline - 61.46%
CutMix (Yun et al., 2019) - 63.92%
Attentive CutMix (Walawalkar et al., 2020) N = 12 62.87%
SaliencyMix (Uddin et al., 2020) - 64.28%
ResizeMix (Qin et al., 2020) β = 0.8,α = 0.1 64.58%
GridMix (Baek et al., 2021) grid = 14 × 14,γ = 0.15, p = 0.8 62.55%
Random SuperpixelGridMix (Hammoudi et al., 2023) N = 50,q = 200 68.79%
Random Superpixel GridMix (Hammoudi et al., 2023) N = 12,q = 196 67.76%
OcCaMix (Ours) N = 12,q ∼ U (50, 95) 69.34%
Table 6: Top-1 classification accuracy on PASCAL VOC with ResNet18, ResNet50 and ResNeXt50.
Methods Parameters
Accuracy
ResNet18 ResNet50 ResNeXt50
Baseline - 89.06% 85.67% 87.76%
CutMix (Yun et al., 2019) - 89.84% 87.50% 88.02%
Attentive CutMix (Walawalkar et al., 2020) N = 6 90.36% 87.23% 88.65%
SaliencyMix (Uddin et al., 2020) - 90.10% 87.50% 88.54%
ResizeMix (Qin et al., 2020) β = 0.8,α = 0.1 89.96% 86.02% 88.28%
GridMix (Baek et al., 2021) grid = 7 × 7,γ = 0.15, p = 0.8 89.58% 87.76% 88.80%
Random Superpixel GridMean (Hammoudi et al., 2023) N = 400, q = 1000 90.36% 88.02% 88.54%
Random Superpixel GridMix (Hammoudi et al., 2023) N = 50, q = 200 89.76% 86.19% 88.54%
Random Superpixel GridMix (Hammoudi et al., 2023) N = 20, q = 100 90.10% 86.71% 89.58%
Random Superpixel GridMix (Hammoudi et al., 2023) N = 6, q = 49 90.62% 88.54% 89.84%
OcCaMix (Ours) N = 6, q ∼ U(30,60) 90.88% 89.58% 90.10%
contour information but are able to capture more se-
mantic information. The impact of the superpixel
granularity q is visualized in Fig. 4 and quantitatively
shown in Table 7.
We randomly choose the superpixel granularity q
from U(q
min
,q
max
) in uniform distribution to enhance
the augmentation diversity. Random selection of the
superpixel granularity q boosts the performance com-
pared with the fixed superpixel granularity, which can
be seen in Table 8. In Table 8, it can also be observed
that both changing granularity and attention improve
the performance.
5.2 Number of Discriminative Regions
The quantity of discriminating regions, denoted as
N, indicates the number of regions selected from
the source image to be pasted onto the target image.
When the number is large, the noise of the back-
ground can also be captured. When the number is
small, semantic information of the class may be cap-
tured incompletely. The impact of the number of
discriminating regions N is visualized in Fig. 5 and
quantitatively shown in Table 7.
Image Augmentation Preserving Object Parts Using Superpixels of Variable Granularity
715
(a) Source Image (b) q=15 (c) q=50 (d) q=85 (e) q=120
(f) Target Image (g) q=15,N=9 (h) q=50,N=9 (i) q=85,N=9 (j) q=120,N=9
Figure 4: Visualization of the augmented images with varying granularity of superpixels q and fixed number of the selected
regions N. Our varying superpixel granularity scheme brings greater augmentation diversity.
Table 7: Impact of number of discriminative regions N and
granularity of superpixels q on classification accuracy on
CUB-200-2011 with ResNet50.
q ∼ U(q
min
,q
max
) N Accuracy
q ∼ U(80, 100) 9 81.11%
q ∼ U(80, 150) 9 81.22%
q ∼ U(30, 200) 9 82.50%
q ∼ U(30, 100) 9 82.94%
q ∼ U(10, 80) 9 79.97%
q ∼ U(30, 50) 9 80.93%
q ∼ U(30, 100) 10 82.79%
q ∼ U(30, 100) 9 82.94%
q ∼ U(30, 100) 8 82.39%
q ∼ U(30, 100) 7 82.10%
q ∼ U(30, 100) 6 81.62%
q ∼ U(30, 100) 5 80.13%
Table 8: Ablation study of proposed discriminative super-
pixel and varying superpixel granularity on CUB-200-2021
with ResNet50.
Discriminative Superpixel Varying granularity q N Accuracy
! % 65 9 82.39%
! ! U(30,100) 9 82.94%(Ours)
% % 196 9 81.29%
% ! U(30,100) 9 81.72%
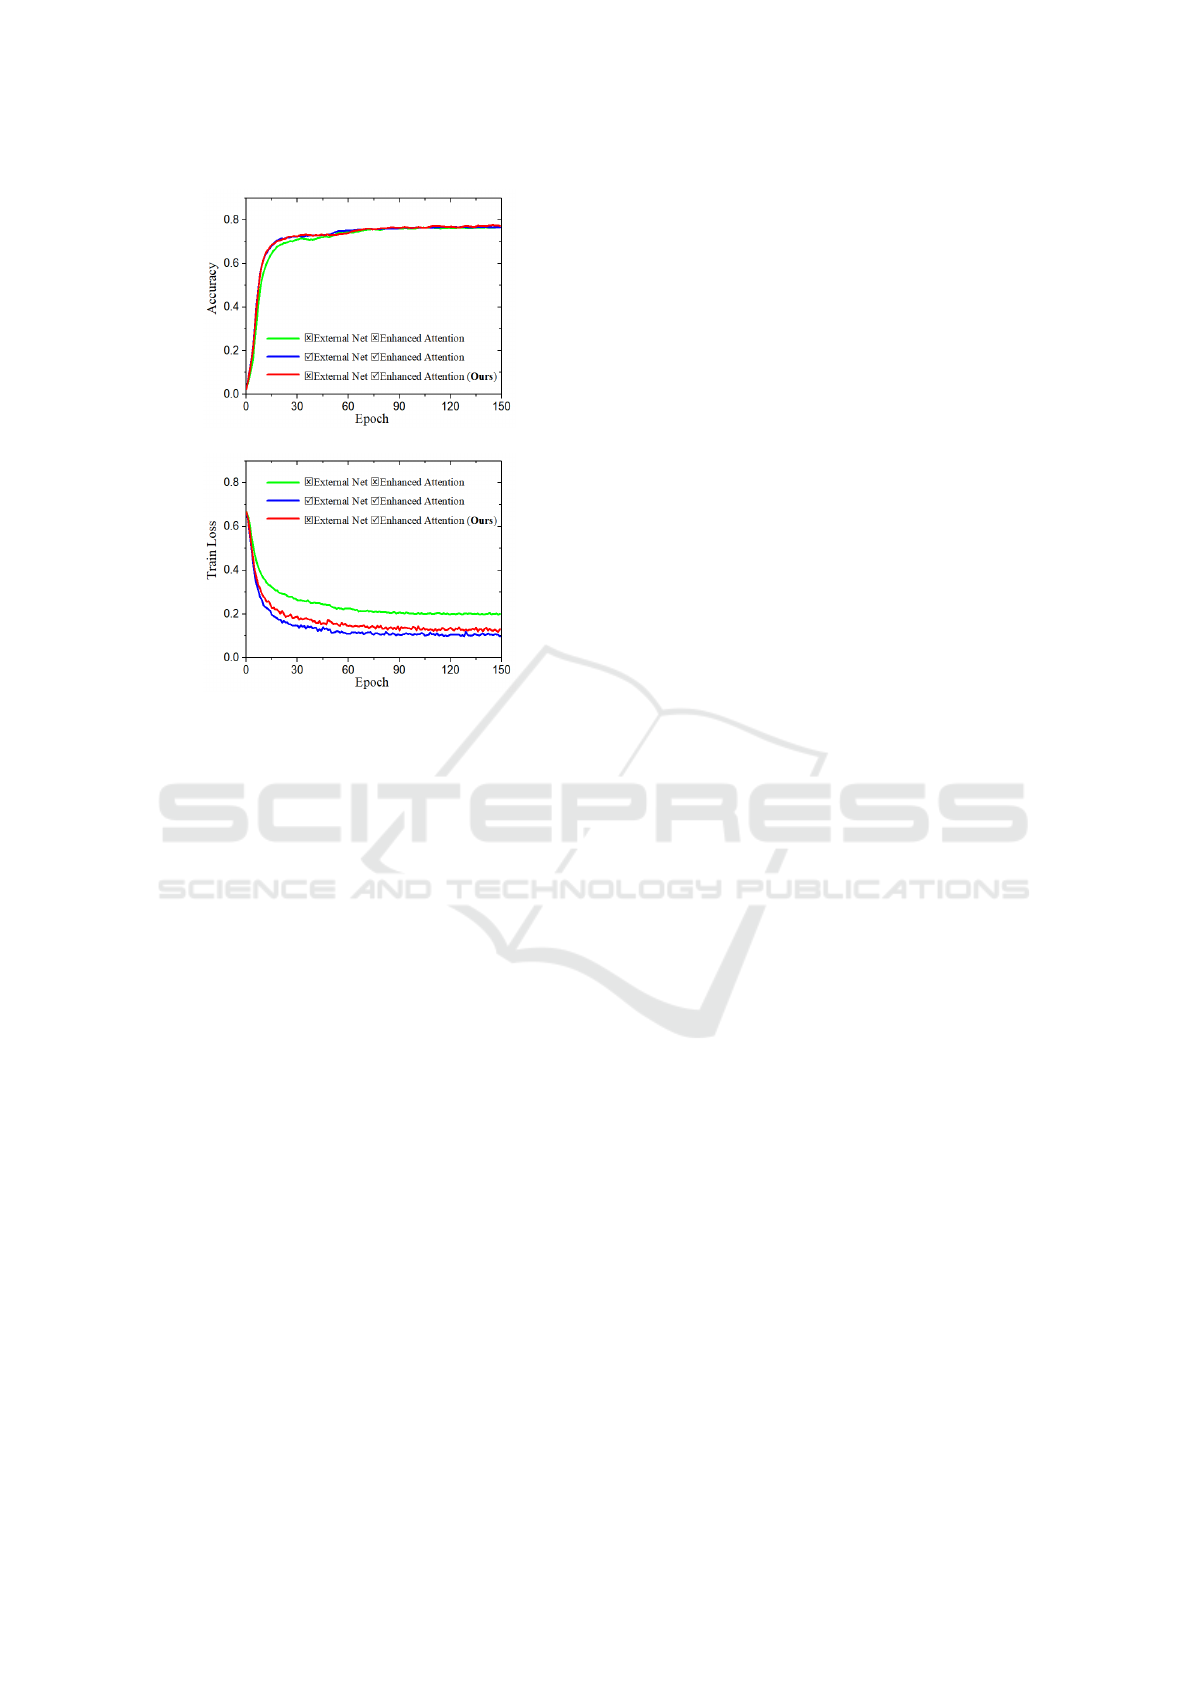
5.3 Attention Map Generation
In our method, we generate the AM (Attention Map)
with Eq. 2, which can be devoted to the ”Enhanced
Attention” method. We compare different attention
map generation methods in Fig. 6. As can be seen in
Fig. 6a, the three attention map generation methods
behave almost the same in validation accuracy. How-
ever, in Fig. 6b, the blue curves, present the ”With
External Net and With Enhanced Attention” method,
even though converges the fastest but requires an ad-
ditional pre-trained model. Our proposed method in
(a) (b) (c)
(d) q = 50,N = 8 (e) q = 50,N = 9 (f) q = 50, N = 10
Figure 5: Visualizations of the augmented image corre-
sponding to varying numbers of selected discriminative re-
gions N with the fixed granularity of superpixel q = 50. A
proper N is optimal for complete discriminative regions and
no unnecessary noise.
the red curves, presented as ”Without External Net
and With Enhanced Attention”, has a larger conver-
gence speed than the green curve of ”Without Exter-
nal Net and Without Enhanced Attention” method.
6 CONCLUSION
We introduce OcCaMix: an end-to-end object-part-
preserved cutmix-based data augmentation method by
mixing with superpixels of varying granularity. We
discuss the potential weaknesses of existing cutmix-
based approaches and propose an effective scheme
to overcome these shortcomings. We analyze the es-
sential discrepancy between object concentration and
augmentation diversity, our work also explores the
balance between object concentration and augmenta-
tion diversity. Our method is effective and simple,
VISAPP 2024 - 19th International Conference on Computer Vision Theory and Applications
716
(a)
(b)
Figure 6: Validation accuracy and the training loss corre-
spond to three distinct approaches to generating attention
maps on CUB-200-2011 using ResNet18. Our OcCaMix
method of generating attention maps in red curves performs
the best, exhibiting a larger convergence speed without re-
quiring an additional network.
requiring no pre-trained models or additional training
modules. We propose a method utilizing regional op-
erations of arbitrary shapes in deep learning and ex-
pect that more work will be proposed to get rid of
the limitations of square-shaped region operations in
deep learning networks. Comprehensive experimen-
tal results have demonstrated top performance on var-
ious benchmarks and models. Moving forward, our
study will expand to include weakly supervised object
localization, unsupervised learning, self-supervised
learning and masked models.
REFERENCES
Achanta, R., Shaji, A., Smith, K., Lucchi, A., Fua, P., and
S
¨
usstrunk, S. (2012). Slic superpixels compared to
state-of-the-art superpixel methods. IEEE transac-
tions on pattern analysis and machine intelligence,
34(11):2274–2282.
Baek, K., Bang, D., and Shim, H. (2021). Gridmix: Strong
regularization through local context mapping. Pattern
Recognition, 109:107594.
DeVries, T. and Taylor, G. W. (2017). Improved regular-
ization of convolutional neural networks with cutout.
arXiv preprint arXiv:1708.04552.
Feng, Z., Fu, K., and Zhao, Q. (2019). Learning to fo-
cus and discriminate for fine-grained classification. In
2019 IEEE International Conference on Image Pro-
cessing (ICIP), pages 415–419. IEEE.
Hammoudi, K., Cabani, A., Slika, B., Benhabiles, H., Dor-
naika, F., and Melkemi, M. (2023). Superpixelgrid-
masks data augmentation: Application to precision
health and other real-world data. Journal of Health-
care Informatics Research.
He, K., Zhang, X., Ren, S., and Sun, J. (2016). Deep resid-
ual learning for image recognition. In Proceedings of
the IEEE conference on computer vision and pattern
recognition, pages 770–778.
Park, J., Yang, J. Y., Shin, J., Hwang, S. J., and Yang,
E. (2022). Saliency grafting: Innocuous attribution-
guided mixup with calibrated label mixing. In Pro-
ceedings of the AAAI Conference on Artificial Intelli-
gence, volume 36, pages 7957–7965.
Qin, J., Fang, J., Zhang, Q., Liu, W., Wang, X., and Wang,
X. (2020). Resizemix: Mixing data with preserved
object information and true labels. arXiv preprint
arXiv:2012.11101.
Srivastava, N., Hinton, G., Krizhevsky, A., Sutskever, I.,
and Salakhutdinov, R. (2014). Dropout: a simple way
to prevent neural networks from overfitting. The jour-
nal of machine learning research, 15(1):1929–1958.
Uddin, A. S., Monira, M. S., Shin, W., Chung, T., and Bae,
S.-H. (2020). Saliencymix: A saliency guided data
augmentation strategy for better regularization. In In-
ternational Conference on Learning Representations.
Walawalkar, D., Shen, Z., Liu, Z., and Savvides, M. (2020).
Attentive cutmix: An enhanced data augmentation
approach for deep learning based image classifica-
tion. In ICASSP 2020-2020 IEEE International Con-
ference on Acoustics, Speech and Signal Processing
(ICASSP), pages 3642–3646. IEEE.
Yu, X., Zhao, Y., Gao, Y., and Xiong, S. (2021). Maskcov:
A random mask covariance network for ultra-fine-
grained visual categorization. Pattern Recognition,
119:108067.
Yun, S., Han, D., Oh, S. J., Chun, S., Choe, J., and Yoo,
Y. (2019). Cutmix: Regularization strategy to train
strong classifiers with localizable features. In Pro-
ceedings of the IEEE/CVF international conference
on computer vision, pages 6023–6032.
Zhang, H., Cisse, M., Dauphin, Y. N., and Lopez-Paz, D.
(2018). mixup: Beyond empirical risk minimization.
In International Conference on Learning Representa-
tions.
Zhou, B., Khosla, A., Lapedriza, A., Oliva, A., and Tor-
ralba, A. (2016). Learning deep features for discrim-
inative localization. In Proceedings of the IEEE con-
ference on computer vision and pattern recognition,
pages 2921–2929.
Image Augmentation Preserving Object Parts Using Superpixels of Variable Granularity
717
