
Assessing Emotion-Induced Variations of Event-Related Potentials
and Heart Rate During Affective Picture Processing
Stefania Coelli
a
, Pierluigi Reali
b
and Anna Maria Bianchi
c
Department of Electronics Information and Bioengineering, Politecnico di Milano, Milano, Italy
Keywords: Event-Related Potential, Heart Rate, Emotions.
Abstract: Emotions are psychological responses to stimuli that can induce measurable variations in physiological
parameters. While actual emotions span a continuum spectrum, they can be grouped into a finite number of
classes or modeled in terms of independent dimensions, the most common of which are arousal (low to high)
and valence (positive, neutral, and negative). In this work, we investigated the modulation of physiological
parameters related to both the central (CNS) and the autonomic (ANS) nervous systems induced by passive
and sustained affective stimulation. Specifically, an Event-Related Potential (ERP) analysis was conducted to
explore the effect of the arousal and valence dimensions on cortical activation. Meanwhile, their influence on
the ANS activity was evaluated through time-domain heart rate (HR) parameters. When high arousal stimuli
are delivered, the experiment revealed that specific ERP components (i.e., P300 and the late positive potential,
LPP) are modulated by the valence dimension, with positive and negative images inducing a stronger response
than neutral stimuli. Instead, the early posterior negativity (EPN) was found to be influenced by the stimulus
arousal but not by the valence of the processed pictures. Finally, HR parameters were principally modulated
by the valence of the stimulation, in line with the observed ERP changes and expectations from the literature.
1 INTRODUCTION
Emotions can be described as the responses to
external or internal stimuli influenced by individual
experiences that are able to induce physiological
changes (Reali et al., 2018b). Both the central nervous
system (CNS) and the autonomic nervous system
(ANS) have a fundamental role in the ability to
regulate emotions during the processing of affective
stimuli (Mizuno-Matsumoto et al., 2020). Despite the
great interest in human emotions, few conclusions
about the emotional response of these two systems
had been drawn until a standardization of the
stimulation was proposed. Based on the first affective
and psychological research theories and findings, a
dimensional model of emotional states has been
derived and widely employed. According to this
model, all the affective states can be seen as the linear
combination of valence (pleasant/positive vs
unpleasant/negative sensation) and arousal
(calm/low vs excited/high) components (Russell,
2003). Following this perspective, the International
a
https://orcid.org/0000-0002-9607-8755
b
https://orcid.org/0000-0003-3041-4004
c
https://orcid.org/0000-0002-8290-7460
Affective Picture System (IAPS) dataset has been
developed, validated, and continuously updated to
provide a standardized set of emotional stimuli for
affective research (Lang Bradley, M.M., & Cuthbert,
B.N., 2008).
The study of brain activity modulations in
response to emotional stimuli has a long history in the
literature, particularly in the form of event-related
potential (ERP) analysis (Olofsson et al., 2008), and
has often been paired, or substituted, with the
evaluation of changes in parameters related to the
ANS (Polo et al., 2023; Reali et al., 2018a; Telles et
al., 2019).
In terms of ERP analysis, findings consistently
identified the early posterior negativity (EPN) as
modulated by the arousal level of the stimulus, the
late positive potential (LPP) component as associated
with the processing of the emotional information
(thus related to the valence dimension), while the
P300 peak amplitude appeared modulated by the
combination of valence and arousal dimensions
(Olofsson et al., 2008; Schindler et al., 2022).
Coelli, S., Reali, P. and Bianchi, A.
Assessing Emotion-Induced Variations of Event-Related Potentials and Heart Rate During Affective Picture Processing.
DOI: 10.5220/0012430400003657
Paper published under CC license (CC BY-NC-ND 4.0)
In Proceedings of the 17th International Joint Conference on Biomedical Engineering Systems and Technologies (BIOSTEC 2024) - Volume 1, pages 667-674
ISBN: 978-989-758-688-0; ISSN: 2184-4305
Proceedings Copyright © 2024 by SCITEPRESS – Science and Technology Publications, Lda.
667

Regarding a more general assessment of cortical
response, a prominent frontal activation, also in terms
of an asymmetry in the alpha frequency band, has
often been reported in response to positive and
negative stimulation (Coan and Allen, 2004; Kop et
al., 2011).
However, due to differences in the study
protocols (i.e., passive/active viewing, exposure
times, pictures or video stimuli, etc.), the objectives,
the devices used to deliver the stimuli (e.g., PC
monitors, virtual reality visors, immersive settings) or
to collect the physiological responses, and, above all,
the variability between subjects, results are difficult
to replicate across studies.
Heart rate variability (HRV) has often been used
as an indicator of the ANS response to emotions, both
in the time and frequency domains. Together with
other ANS-related parameters, such as respiration
rate and electrodermal activity, the heart rate (HR)
variations have been used to define emotion
classification models (Egger et al., 2019; Polo et al.,
2023; Reali et al., 2018a). Moreover, HR parameters
in the time domain (i.e., mean and standard deviation)
at rest have been explored to determine the emotional
regulation ability of the subjects and predict their
cortical response to successive emotional
stimulations or attentional tasks (Ruiz-Padial and
Mercado, 2021; Telles et al., 2019), but rarely they
have been analyzed in conjunction with ERPs
variations. Indeed, to the best of our knowledge, no
studies explored the influence of both valence and
arousal factors on ERP components and HR
simultaneously.
In this work, we present an ERP analysis and an
evaluation of the simultaneous ANS response during
affective picture stimulation. Specifically, we
designed an IAPS-based passive stimulation protocol
featuring sequences of images delivered for an
extended exposure time (12 seconds). The goal of
such a long exposure, unusual for an ERP analysis,
was to allow the volunteer to process each affective
stimulus completely and test the effect of this
processing rather than the first impression of each
picture. Moreover, this was required to properly
evaluate ANS variations, as analysis windows of
adequate length are needed to accurately estimate HR
parameters (Castaldo et al., 2019). As for the ERP
analysis, we focused on the late components (EPN,
P300, and LPP), which have been associated with the
encoding processing phase for emotional stimuli
(Olofsson et al., 2008).
2 MATERIALS AND METHODS
2.1 Participants and Procedure
Thirty-one healthy participants (22 males and 9
females) aged between 19 and 27 (mean=20.9;
SD=1.5) were recruited for the study. Volunteers
were instructed about the protocol and told they could
withdraw from the trial at any moment. Before the
beginning of each experimental session, participants
were asked to sign a written consent to participate in
the study.
The experiment was conducted in front of a PC
monitor, which was used to provide the visual stimuli.
Ninety images were selected from the IAPS database
and grouped into three levels of arousal and three of
valence. Specifically, the selected arousal ranges
were 2.41-3.59 for the “low arousal” (LA) set of
pictures, 3.60-5.49 for the “medium arousal” (MA)
one, and 5.50-7.35 for the “high arousal” (HA) set.
Within each arousal block, three subsets of valence
pictures, namely “negative,” “neutral,” and “positive”
valence, were selected, containing ten pictures each
and showing the following valence ranges: 2.04-5.39
(negative), 5.40-6.19 (neutral), and 6.20-8.28
(positive). Combining these arousal and valence
ranges led to nine arousal-valence partitions, each
containing ten pictures expected to elicit similar
emotions. The above ranges were chosen as a trade-
off to maximize the separation among the nine sets of
images in terms of arousal and valence while
preserving the desired number of pictures (ten) for
each of the nine arousal-valence level combinations.
Regarding the stimulation protocol (Figure 1), the
nine arousal-valence blocks were presented in order
of increasing levels of arousal to keep participants
engaged during the experiment. To avoid any other
sequence-related bias, the three valence sub-blocks
(i.e., negative, neutral, and positive) and the ten
pictures of each sequence were presented in a random
order. A “neutral image”, a picture intended not to
elicit any particular emotion showing a country
landscape without any particular subject represented,
was shown for 30 seconds between each sequence of
ten pictures to reduce the propagation of the
physiological response from one arousal-valence
block to the following.
Each IAPS image was displayed for 12 seconds;
therefore, each condition had a total duration of 2
minutes. A first 90-second neutral image was
displayed at the beginning of the protocol to make
participants relax and prepare them for the
presentation of the first arousal-valence block.
BIOSIGNALS 2024 - 17th International Conference on Bio-inspired Systems and Signal Processing
668
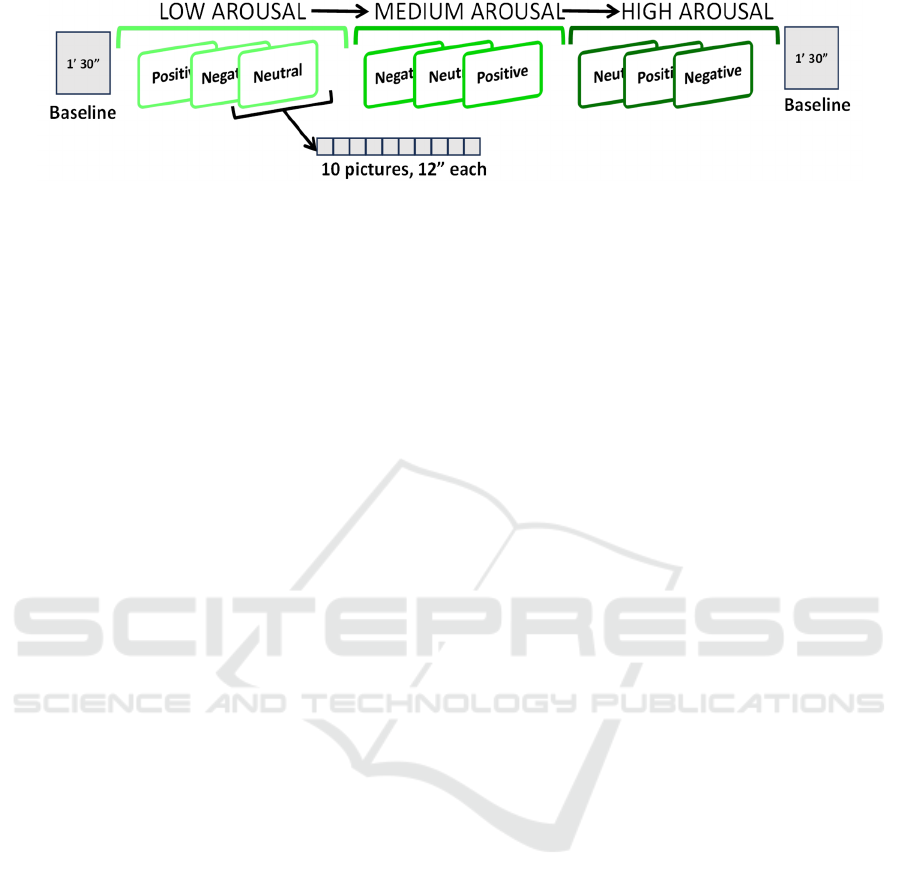
Figure 1: Stimulation sequence. Arousal blocks of pictures were always presented in increasing order. Within each arousal
block, the valence sub-blocks were presented in randomized order (i.e., different for each participant). The ten pictures
presented within each valence block were also randomized.
Electroencephalographic (EEG) and electrocar-
diographic (ECG) signals were collected during the
entire procedure.
The protocol was approved by the Institutional
Ethics Committee of Politecnico di Milano.
2.2 Signal Acquisition
EEG signal was acquired by means of a portable
system (SD LTM Express and System Plus Evolution
software, Micromed, Italy). Brain signals were
recorded from 25 electrodes placed according to the
10/10 system with the following recording channels:
Fpz, Fp1, Fp2, AF3, AF4, AF7, AF8, Fz, F1, F2, F3,
F4, F5, F6, F7, F8, Cz, C3, C4, T7, T8, P7, P8, O1
and O2. Data were acquired at a sampling rate of 256
Hz, with the reference electrode placed on the pre-
cabled cap, between CPz and Pz.
The ProComp Infiniti system (Thought
Technology Ltd., Canada), a battery-powered device,
was used to record a single lead ECG at the default
sampling rate of 2048 Hz, with three pre-gelled
disposable electrodes placed in lead II configuration.
2.3 ECG and EEG Signal Analysis
The collected ECG and EEG signals were imported
and processed in MATLAB (R2019B).
The Pan-Tompkins algorithm(Pan and Tompkins,
1985) was applied to the ECG traces to detect the R
peaks and obtain the RR time series. Such a well-
known algorithm comprises an initial band-pass finite
impulse response (FIR) filter to reduce baseline
wander and high-frequency noise, followed by
additional steps to enhance the QRS complexes and
enable R peak identification. After finding the
approximate location of the R peaks on the filtered
signals, their exact positions were determined by
finding the closest local maxima on the original ECG
signals. Finally, the identified R peaks were visually
inspected to avoid false detections or missed beats.
For each stimulation block (i.e., ten-picture
sequence), the mean RR interval and the related
standard deviation were extracted. The entire duration
of each stimulation block (2 minutes) was considered
for the calculation of these features, given the
temporal requirements for accurate estimation of
time-domain HR indices (Castaldo et al., 2019).
EEG signals were pre-processed using the
EEGLAB toolbox [https://eeglab.org/] and custom
scripts optimized for the study aim (Cassani et al.,
2022; Coelli et al., 2024). First, data were band-pass
filtered between 1 Hz and 45 Hz with a FIR (order =
400), zero-phase filter, and bad channels were
visually selected and removed (i.e., low signal quality
due to low electrode adherence).
Signals were segmented into epochs from -1 to +4
seconds with respect to each stimulus presentation.
The extended Infomax independent component
analysis (ICA) algorithm was applied to the
concatenated epochs and, with the support of the
IClabel plugin (Pion-Tonachini et al., 2019), the
sources of artifacts (i.e., ocular, heart, muscular and
residual power line noises) were identified and
removed. The previously rejected bad channels (if
any) were interpolated using spherical spline
interpolation, and signals were re-referenced to the
infinite reference using the Reference Electrode
Standardization Technique (REST plugin) (Yao,
2001). Finally, epochs with residual artifacts were
visually checked and rejected, obtaining 9.14 ± 1.07
valid trials for each participant and condition.
ERPs were obtained for each of the nine
conditions of stimulation at each EEG channel by
applying the synchronous averaging method and
using the 100 ms preceding the stimulus presentation
for baseline correction. ERP components were
extracted using a fixed time window, as suggested in
the literature (Schindler et al., 2022; Schupp et al.,
2012). We further explored specific ERP components
that have been previously correlated with emotion
perception and processing: P300 [270 - 340 ms], EPN
[200-300 ms], and the early LPP [400-700 ms].
Specifically, we identified the peak amplitude for the
Assessing Emotion-Induced Variations of Event-Related Potentials and Heart Rate During Affective Picture Processing
669
P300 and the area under the curve (AUC) for both
EPN and LPP, since these latter components cannot
be described by considering individual peaks alone.
Given that the polarity of the ERP depends on the
channel position, both the peak amplitudes and the
AUC were computed by maintaining the original
polarity. In fact, negative AUC may be obtained
because the areas corresponding to the downstate of
the ERP (negative polarity) are subtracted from the
positive one (if present). The extracted ERP and
parameters were averaged on clusters of channels:
Centrals (C3-Cz-C4), Posteriors (P7-P8-O1-O2),
Frontal Left (FP1-F1-F3), and Frontal Right (FP2-F2-
F4).
Statistical analysis was performed in R to
compare the variations in HR and ERP indices across
the different stimulation blocks.
3 RESULTS
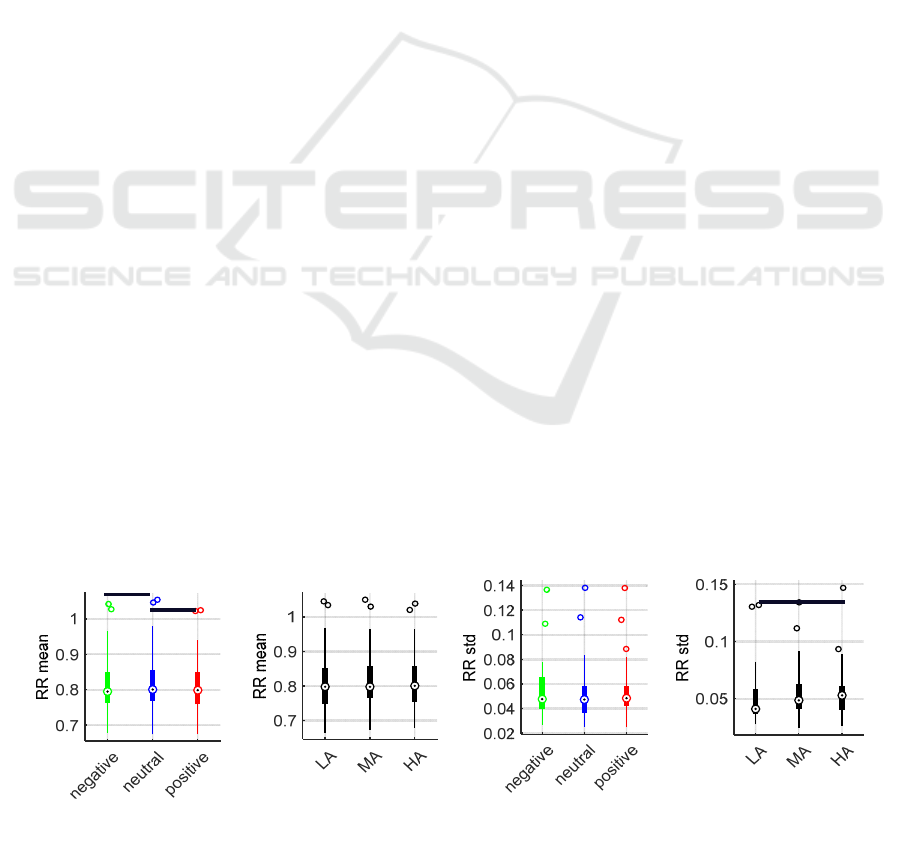
3.1 Heart Rate Analysis Results
HR variations were analyzed considering the mean
(RRmean) and standard deviation (RRstd) of the RR
intervals. Since most of the data distributions did not
pass the Shapiro-Wilk normality test, the non-
parametric Friedman’s test and Wilcoxon’s
Bonferroni-corrected post hoc tests were used to
compare the RRmean and RRstd values among the
three valence and arousal levels separately (Figure 2).
In fact, we did not find any evidence of an interaction
between the two factors (Valence*Arousal).
Friedman’s test found significant differences for the
RRmean values across valence levels (p =0.027),
while no significant differences were found for the
Arousal main effect. The significant effect of Valence
was further explored through pairwise comparisons,
which highlighted a significant difference between
the positive stimulation against the neutral one (p
=0.008) and between the negative and neutral
stimulations (p =0.008).
Conversely, for the RRstd values, Friedman’s test
found a significant difference when comparing the
arousal levels (p =0.004) but not for the valence ones.
Specifically, HA stimuli significantly differed from
the LA ones (p =0.019). Observing an increasing
trend of the RRstd from LA to HA, we cannot exclude
an influence of the protocol sequence on this finding,
given that the IAPS pictures were presented in
increasing order of arousal.
3.2 Event Related Potential Results
Figure 3 displays the grand average of the ERP time
course for each cluster of channels (rows) grouped by
arousal level (columns). Valence levels are directly
compared in each subplot.
Since all the computed ERP indices were found to
be approximately normally distributed, a repeated
measures analysis of variance (ANOVA) with two
within factors (Valence and Arousal) was performed
for each cluster of channels. The ANOVA was
followed by post hoc tests to evaluate simple main
effects when needed.
3.2.1 P300
P300 peak amplitude results are shown in Figure 4. A
significant interaction Valence*Arousal was found in
the Frontal-Right (F(4,116) = 3.391; p = 0.012) and
Frontal-Left clusters (F(4,116) = 4.17; p = 0.003). On
the right hemisphere, significantly larger peaks were
detected in the HA block for positive and negative
valence with respect to neutral stimuli (p
Neut vs
Pos
=0.005, p
Neut vs Neg
=0.0002), and differences were
observed between HA and MA when the valence was
neutral (p
HA vs MA
=0.008). The same significant
differences were found in the left hemisphere during
HA stimulation (p
Neut vs Pos
=0.005, p
Neut vs Neg
=0.002),
and between HA and LA with neutral stimuli (p
HA vs
LA
=0.007).
For the posterior cluster, results followed the same
pattern: a significant interaction was found
Figure 2: RR mean and standard deviation parameters compared by valence (colors) and arousal (black) levels.
Valence Arousal
*
*
Valence Arousal
*
BIOSIGNALS 2024 - 17th International Conference on Bio-inspired Systems and Signal Processing
670
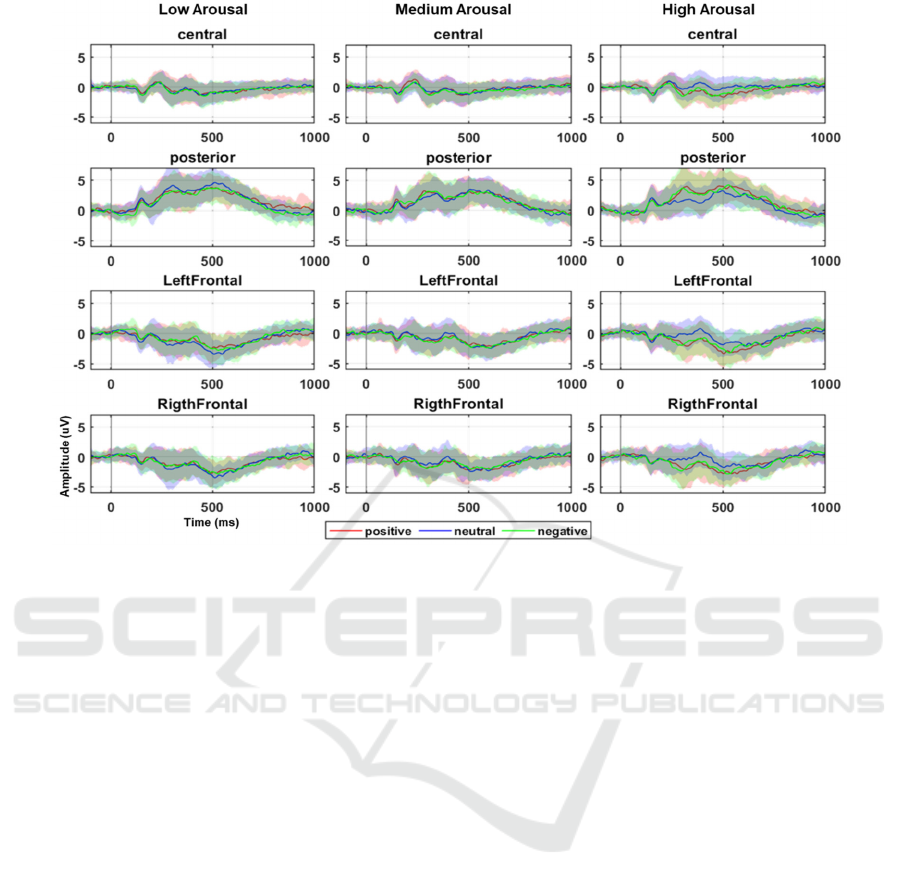
Figure 3: ERP time course averaged across clusters of channels and volunteers for each arousal/valence condition. Solid lines
represent the group mean and shaded areas display the standard deviation.
(F(4,116) = 4.794; p = 0.001), and, dividing by
factors, we obtained significantly higher peaks in the
HA block for both positive and negative valence with
respect to neutral images (p
Neut vs Pos
=0.004, p
Neut vs
Neg
=0.001) and, at neutral valence level, between HA
and LA (p
HA vs LA
=0.0002). Finally, in the central
cluster, the interaction was again significant
(F(4,116) = 2.653; p = 0.037), and stronger P300 were
elicited in the HA block for the negative and positive
valence with respect to the neutral (p
Neut vs Pos
=0.002,
p
Neut vs Neg
=0.0006), and between arousal levels when
the valence was neutral (p
HA vs MA
=0.029,
p
HA vs
LA
=0.002).
3.2.2 EPN
No significant interactions between Valence and
Arousal factors were identified in any cluster of
channels. Only the main effect of Arousal was found
significant at the posterior site (F(2,58) = 4.183;
p = 0.02), and the post hoc analysis identified
differences between LA and MA and between LA and
HA (p
LA vs MA
=0.014, p
HA vs LA
=0.024).
3.2.3 LPP
Distributions of the LPP area values are displayed in
Figure 5.
In the left frontal lobe, the two-factor interaction
was significant (F(4,116) =3.747; p = 0.007), and,
breaking down by Arousal levels, we found that the
positive stimuli elicited a stronger LPP with respect
to neutral stimulation (p
Neut vs Pos
=0.003) in the HA
condition. While analyzing the Valence simple main
effects, a difference was found in the positive
stimulation between HA and MA (p
HA vs MA
=0.032),
whereas HA was different from LA when the
stimulation was neutral (p
HA vs LA
=0.025). In the right
frontal lobe, only the main effect of Arousal was
found significant (F(2,58) = 3.19; p = 0.048);
precisely, LA was different from MA (p = 0.034).
At posterior sites, only the main effect of Arousal
was significant (F(2,58) = 3.173; p = 0.049) with a
significant pairwise difference between MA and LA
(p
MA vs LA
=0.01). Finally, in the central cluster, the
interaction was again significant (F(4,116) = 3.142; p
= 0.017), and larger LPP were elicited in the HA
block for the negative and positive valence with
respect to the neutral (p
Neut vs Pos
<0.0001, p
Neut vs
Neg
=0.001) and between arousal levels when the
valence was neutral (p
HA vs MA
=0.016,
p
HA vs
LA
=0.007).
Assessing Emotion-Induced Variations of Event-Related Potentials and Heart Rate During Affective Picture Processing
671
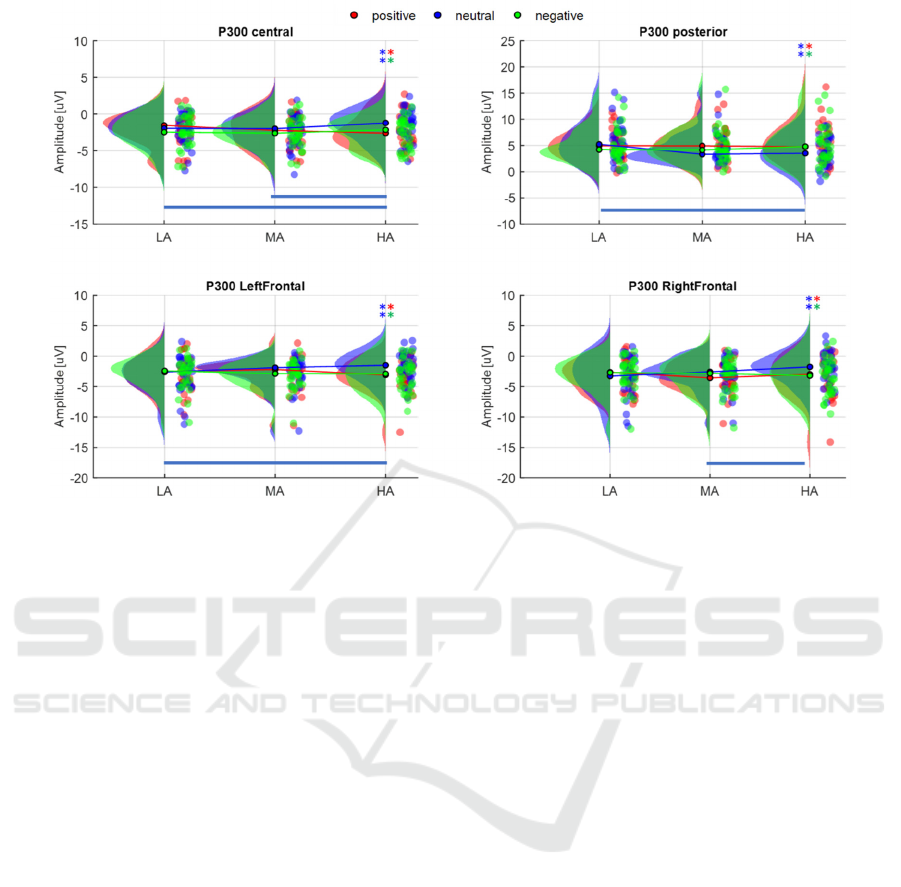
Figure 4: Comparison of P300 amplitude values across valence (colours) and arousal levels (LA, MA, HA). Pairs of * indicate
significant differences between valence levels at the corresponding arousal block (e.g., *blue-*red: difference between
positive and neutral stimulation). The coloured lines indicate the presence of a significant difference between arousal blocks
at the corresponding valence level (e.g., a blue line marks differences between arousal blocks at neutral valence).
4 DISCUSSION
In this work, we presented a classical ERP
components analysis applied to an unusual
stimulation protocol, justified by our intention to also
evaluate the slower response of the ANS through the
analysis of the RR series. Moreover, the long picture
exposure allowed us to observe the cognitive
processing of the presented stimuli (Olofsson et al.,
2008) and the associated modulations of both CNS
and ANS.
Indeed, a first interesting result was the
achievement of an expected cortical stimulation
provided by the protocol and demonstrated by the
clear ERP patterns obtained for each stimulation
condition in the different cortical regions, as defined
by clusters of channels. Specifically, ERP waves were
found prominent at posterior positions, indicating a
primary response of the visual cortex and an early
processing of the stimulus at posterior sites (Schupp
et al., 2012). Clear ERP patterns were also observed
in the frontal regions where effective content is
supposed to be further processed (Gable et al., 2014).
The interaction between the arousal and valence
emotional dimensions was significant in most cases,
particularly highlighting differences during the HA
block. Specifically, P300 and LPP were significantly
modulated by the valence of the pictures only when
the arousal level was high. In line with the literature
(Gable et al., 2014; Schindler et al., 2022; Schupp et
al., 2012), we found a stronger response to both
positive and negative pictures with respect to neutral
ones, but these were not different between them.
Unexpectedly, we found that neutral valence
images elicited weaker ERP responses in the HA
condition when compared to lower arousal levels.
This outcome might be explained by the arousal-
increasing sequence that could result in a habituation
effect, not affecting, interestingly, the volunteers’
perception of positive and negative emotions.
Moreover, such a perception was not influenced by
the presentation sequence, likely thanks to the
randomization of the different valence sub-blocks.
The EPN is often identified as a negative deflection
over fronto-central sites and a positive waveform at
lateral and posterior channels, principally modulated
by the arousal dimension of stimulating images
(Olofsson et al., 2008). Indeed, our results confirm
this statement as we coherently found a modulation
of the EPN at posterior sites induced by the arousal
dimension as a main effect.
BIOSIGNALS 2024 - 17th International Conference on Bio-inspired Systems and Signal Processing
672
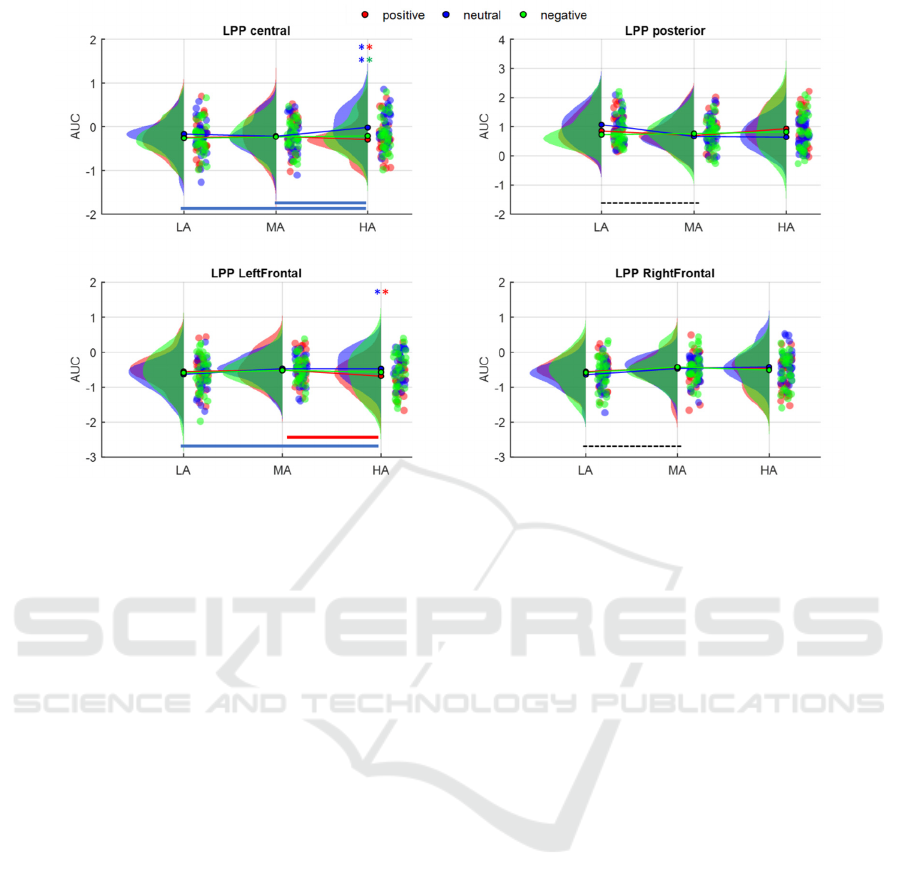
Figure 5: Comparison of LPP areas across valence (colours) and arousal levels (LA, MA, HA). Pairs of * indicate the
significant differences between valence levels at the corresponding arousal block (e.g., *blue-*red: difference between
positive and neutral stimulation). The coloured lines indicate the presence of a significant difference between arousal blocks
at specific valence level. Black lines indicate significant differences between arousal levels when only the main effect of
Arousal was found significant.
In line with the EEG results, the analysis of the
HR parameters highlighted a modulation of the mean
RR due to the valence of the stimulation, resulting in
a shorter RR interval during both negative and
positive stimuli with respect to neutral ones. The
arousal dimension did not modulate the mean RR but
its standard deviation, which increased with the
arousal level. While the results related to the mean
RR are comparable with those from previous studies,
where HR features have been found more sensitive to
valence variations rather than arousal(Bensafi, 2002;
Colomer Granero et al., 2016), changes in RRstd with
arousal are not well documented in the literature.
Since the picture arousal levels increased over time in
our stimulation protocol, we cannot exclude RRstd
changes to be an effect of time rather than arousal-
dependent. In this sense, even if the protocol was
designed with an increasing arousal stimulation to
keep the subject engaged, the lack of randomization
in the arousal dimension might be considered a
limitation of the study. However, a more detailed
analysis of the HR data (e.g., including frequency-
domain features) is needed to shed light on this
peculiar finding. Moreover, to increase the statistical
power of our findings, a larger sample size is needed,
while to assess the effectiveness of the stimulation, in
terms of elicited emotions, the participants’ feedback
should be collected through questionnaires, and the
agreement among them investigated.
5 CONCLUSIONS
In summary, this study confirmed the efficacy of the
proposed stimulation protocol as it induced HR
variations and ERP responses with similar
characteristics to those observed in previous works
through different affective stimulation protocols.
Thanks to the longer exposure times guaranteed by
our protocol, these physiological responses could be
assessed both at the CNS and ANS levels through the
simultaneous analysis of ERP and HR parameters,
respectively. In this work, we focused on a time-
domain analysis, both for the cortical and ANS
response. Future studies will also include frequency
domain analysis to find optimal combinations of EEG
and HR features to predict arousal and valence levels
from physiological signals.
ACKNOWLEDGEMENTS
The study was supported by “MUSA - Multilayered
Urban Sustainability Action” project, funded by the
Assessing Emotion-Induced Variations of Event-Related Potentials and Heart Rate During Affective Picture Processing
673

European Union – NextGeneration EU (National
Recovery and Resilience Plan).
REFERENCES
Bensafi, M., 2002. Autonomic Nervous System Responses to
Odours: the Role of Pleasantness and Arousal. Chem.
Senses 27, 703–709. https://doi.org/10.1093/chemse/2
7.8.703
Cassani, C.M., Coelli, S., Calcagno, A., Temporiti, F.,
Mandaresu, S., Gatti, R., Galli, M., Bianchi, A.M., 2022.
Selecting a pre-processing pipeline for the analysis of
EEG event-related rhythms modulation. Annu. Int. Conf.
IEEE Eng. Med. Biol. Soc. IEEE Eng. Med. Biol. Soc.
Annu. Int. Conf. 2022, 4044–4047. https://doi.org/
10.1109/EMBC48229.2022.9871394
Castaldo, R., Montesinos, L., Melillo, P., James, C., Pecchia,
L., 2019. Ultra-short term HRV features as surrogates of
short term HRV: a case study on mental stress detection
in real life. BMC Med. Inform. Decis. Mak. 19, 12.
https://doi.org/10.1186/s12911-019-0742-y
Coan, J.A., Allen, J.J.B., 2004. Frontal EEG asymmetry as a
moderator and mediator of emotion. Biol. Psychol. 67, 7–
50. https://doi.org/10.1016/j.biopsycho.2004.03.002
Coelli, S., Calcagno, A., Cassani, C.M., Temporiti, F., Reali,
P., Gatti, R., Galli, M., Bianchi, A.M., 2024. Selecting
methods for a modular EEG pre-processing pipeline: An
objective comparison. Biomed. Signal Process. Control
90, 105830. https://doi.org/10.1016/ j.bspc.2023.105830
Colomer Granero, A., Fuentes-Hurtado, F., Naranjo Ornedo,
V., Guixeres Provinciale, J., Ausín, J.M., Alcañiz Raya,
M., 2016. A Comparison of Physiological Signal
Analysis Techniques and Classifiers for Automatic
Emotional Evaluation of Audiovisual Contents. Front.
Comput. Neurosci. 10. https://doi.org/10.3389/fncom.20
16.00074
Egger, M., Ley, M., Hanke, S., 2019. Emotion Recognition
from Physiological Signal Analysis: A Review. Electron.
Notes Theor. Comput. Sci. 343, 35–55.
https://doi.org/10.1016/j.entcs.2019.04.009
Gable, P.A., Adams, D.L., Proudfit, G.H., 2014. Transient
tasks and enduring emotions: the impacts of affective
content, task relevance, and picture duration on the
sustained late positive potential. Cogn. Affect. Behav.
Neurosci. 15, 45–54. https://doi.org/10.3758/s13415-
014-0313-8
Kop, W.J., Synowski, S.J., Newell, M.E., Schmidt, L.A.,
Waldstein, S.R., Fox, N.A., 2011. Autonomic nervous
system reactivity to positive and negative mood
induction: The role of acute psychological responses and
frontal electrocortical activity. Biol. Psychol. 86, 230–
238. https://doi.org/10.1016/j.biopsycho.2010.12. 003
Lang Bradley, M.M., & Cuthbert, B.N., P.J., 2008.
International affective picture system (IAPS): Affective
ratings of pictures and instruction manual.
Mizuno-Matsumoto, Y., Inoguchi, Y., Carpels, S.M.A.,
Muramatsu, A., Yamamoto, Y., 2020. Cerebral cortex
and autonomic nervous system responses during
emotional memory processing. PLoS One 15, 1–15.
https://doi.org/10.1371/journal.pone.0229890
Olofsson, J.K., Nordin, S., Sequeira, H., Polich, J., 2008.
Affective picture processing: An integrative review of
ERP findings. Biol. Psychol. 77, 247–265.
https://doi.org/10.1016/j.biopsycho.2007.11.006
Pan, J., Tompkins, W.J., 1985. A simple real-time QRS
detection algorithm A Real-Time QRS Detection
Algorithm. IEEE Trans. Biomed. Eng. https://doi.org/
10.1109/IEMBS.1996.647473
Pion-Tonachini, L., Kreutz-Delgado, K., Makeig, S., 2019.
ICLabel: An automated electroencephalographic
independent component classifier, dataset, and website.
Neuroimage 198, 181–197. https://doi.org/10.1016/
j.neuroimage.2019.05.026
Polo, E.M., Farabbi, A., Mollura, M., Paglialonga, A.,
Mainardi, L., Barbieri, R., 2023. Comparative
assessment of physiological responses to emotional
elicitation by auditory and visual stimuli. IEEE J. Transl.
Eng. Heal. Med. 1–1. https://doi.org/10.1109/
JTEHM.2023.3324249
Reali, P., Cosentini, C., Carvalho, P. De, Traver, V., Bianchi,
A.M., 2018a. Towards the development of physiological
models for emotions evaluation*, in: 2018 40th Annual
International Conference of the IEEE Engineering in
Medicine and Biology Society (EMBC). IEEE, pp. 110–
113. https://doi.org/10.1109/EMBC.20 18.8512236
Reali, P., Martinez-millana, A., Carvalho, P. De, Bianchi,
A.M., 2018b. Cardiovascular effects of stress and
emotions : a brief overview of concepts and assessment
methods 165–173.
Ruiz-Padial, E., Mercado, F., 2021. In exogenous attention,
time is the clue: Brain and heart interactions to survive
threatening stimuli. PLoS One 16, 1–20. https://doi.org/
10.1371/journal.pone.0243117
Russell, J.A., 2003. Core affect and the psychological
construction of emotion. Psychol. Rev. 110, 145–172.
https://doi.org/10.1037/0033-295X.110.1.145
Schindler, S., Bruchmann, M., Straube, T., 2022. Feature-
based attention interacts with emotional picture content
during mid-latency and late ERP processing stages. Biol.
Psychol. 170, 108310. https://doi.org/10.1016/
j.biopsycho.2022.108310
Schupp, H.T., Schmälzle, R., Flaisch, T., Weike, A.I.,
Hamm, A.O., 2012. Affective picture processing as a
function of preceding picture valence: An ERP analysis.
Biol. Psychol. 91, 81–87. https://doi.org/
10.1016/j.biopsycho.2012.04.006
Telles, S., Singh, D., Naveen, K. V., Pailoor, S., Singh, N.,
Pathak, S., 2019. P300 and Heart Rate Variability
Recorded Simultaneously in Meditation. Clin. EEG
Neurosci. 50, 161–171. https://doi.org/10.1177/155005
9418790717
Yao, D., 2001. A method to standardize a reference of scalp
EEG recordings to a point at infinity. Physiol. Meas. 22,
693–711. https://doi.org/10.1088/0967-3334/22/4/305
BIOSIGNALS 2024 - 17th International Conference on Bio-inspired Systems and Signal Processing
674
