
Comparison of Dimension Reduction Methods for Multivariate Time
Series Pattern Recognition
Patrick Petersen
a
, Hanno Stage, Philipp Reis
b
and Jonas Rauch and Eric Sax
c
FZI Research Center for Information Technology, 76131 Karlsruhe, Germany
Keywords:
Pattern Recognition, Dimension Reduction, Motif Discovery, Time Series Data Mining.
Abstract:
Large volumes of time series data are frequently analyzed using unsupervised algorithms to identify pat-
terns. Multivariate time series’s time and space complexity poses challenges in this context. Dimensionality
reduction, a common technique in data science, provides a viable solution to improve time and space complex-
ity. Nevertheless, a crucial question arises concerning how the time advantage compares to the information
loss. This paper compares dimension reduction methods within unsupervised time series pattern recognition,
including rule-based, spectral, probabilistic, and unsupervised learning-based approaches. The comparison
involves both synthetic and real-world datasets for a comprehensive evaluation. The findings reveal the poten-
tial to accelerate pattern recognition algorithms by 90 %, with only 18 % information loss in the sense of the
F1 score.
1 INTRODUCTION
Time series analysis and pattern recognition are es-
sential in many fields such as healthcare (Kam et al.,
2010), automotive (Petersen and Sax, 2022), and fi-
nance (Chan, 2007). A time series is a collection of
data points logged in chronological order. It is char-
acterized by trends, seasonality, and cycles (Dodge,
2008). These characteristics can be used to find pat-
terns in the data and predict what will happen in the
future. Time series data offers valuable information
on system behavior and state, enabling Time Series
Pattern Recognition (TSPR) methods to identify re-
curring load situations. By identifying patterns in
time series data, it is possible to better understand how
different factors interact and how they influence the
overall system. In addition to the quality of the algo-
rithms, handling big data, especially in case of Multi-
variate Time Series (MTS), is a challenge. TSPR al-
gorithms in MTS require time-consuming numerical
computations, such as similarity measures and opti-
mization algorithms (Yeh et al., 2016; Bascol et al.,
2016), which can be costly and time-consuming.
These algorithms are iterative and require significant
computational resources like CPU time and memory.
a
https://orcid.org/0000-0003-3203-5470
b
https://orcid.org/0009-0001-2653-4559
c
https://orcid.org/0000-0003-2567-2340
The time complexity for pattern search algorithms
ranges from O(m
2
log(m)) to O(m
2
), depending on
the length m of a Univariate Time Series (UTS) (Yeh
et al., 2016; Yan et al., 2017). For MTS, the time
complexity increases to O(nlog(n)m
2
) with n being
the number of dimensions (Alaee et al., 2020). While
resources are available through data centers and ser-
vices, they are limited and expensive. Besides the
computational effort for MTS, many algorithms lack
the multi-dimensionality ability to detect patterns be-
tween different time series. Dimension reduction
(DR) methods are potential solutions for this chal-
lenge. Clustering techniques have been successfully
applied to DR methods. However, to the best of the
author’s knowledge, DR has yet to be used in TSPR.
This contribution investigates how different DR meth-
ods influence the impact on the information loss and
the time efficiency for TSPR. This paper gives an
overview of different DR approaches and their advan-
tages and disadvantages. These methods are tested on
a synthetic dataset and on the real-world Commercial
Vehicle Sensor Dataset (AB, ).
Section 2 defines necessary terms and outlines the
state of the art of unsupervised TSPR algorithm and
DR methods. In Section 3, the concept of the unsu-
pervised TSPR framework is described. The evalua-
tion of the methods described is presented in Section
4. Section 5 concludes the result of this contribution.
Petersen, P., Stage, H., Reis, P., Rauch, J. and Sax, E.
Comparison of Dimension Reduction Methods for Multivariate Time Series Pattern Recognition.
DOI: 10.5220/0012428900003654
Paper published under CC license (CC BY-NC-ND 4.0)
In Proceedings of the 13th International Conference on Pattern Recognition Applications and Methods (ICPRAM 2024), pages 809-816
ISBN: 978-989-758-684-2; ISSN: 2184-4313
Proceedings Copyright © 2024 by SCITEPRESS – Science and Technology Publications, Lda.
809

2 STATE OF THE ART
2.1 Unsupervised Pattern Recognition
Unsupervised TSPR of time series is a knowledge
discovery problem. For this problem, the following
terms need to be defined:
Definition 1 (Time Series T (M
¨
orchen, 2006)). A d-
dimensional time series w.r.t. a series of time points
T = {t
1
,...,t
n
} of length n ∈ N is T = {(t
i
,y
i
)|y
i
=
(y
i,1
,..., y
i,d
)
T
∈ R
d
,t
i
∈ T,i = 1,··· ,n}. If d = 1, T
is called univariate, for d > 1 it is a multivariate time
series.
Definition 2 (Subsequence t
i,l
(Noering, 2022)). A
subsequence t
i,l
∈R
n×d+1
of a time series T is a sub-
set of values from T of length l starting from index
i. This subsequence t
i,l
contains consecutive tuples
t
i
t
i+1
.. . t
i+l−1
.
Definition 3 (Pattern P (Noering, 2022)). A time se-
ries pattern P is a group of m (with m ≥ 2) similar
subsequences in a time series T excluding all triv-
ial matches. A subsequence t
i,l
, that is included in
a pattern P, is called a member M. Formally, P =
[M
1
,M
2
,. . .,M
m
] with each M
x
being a subsequence
with a starting index i and a length l. This includes
a distance threshold τ with dist(M
x
,M
y
) ≤ τ, ∀x, y ∈
[1,. . .,m].
Definition 4 (Full-Dimensional Pattern P
full
). A full-
dimensional pattern P
full
of dimension d is a pattern,
where the distance of two members M
x
and M
y
in di-
mension k is dist(M
x,k
,M
y,k
) ≤ τ, with {k ∈ N|1 ≤
k ≤d} in T .
Definition 5 (Sub-Dimensional Pattern P
sub
). A sub-
dimensional pattern P
sub
is a pattern of dimension b <
d, where d is the dimensionality of the time series.
The goal of TSPR is to find patterns of unknown
shape, length, frequency of occurrence, and level
of detail in time series (Noering, 2022). Existing
methods for identifying those patterns include Dy-
namic Time Warping (Berndt and Clifford, 1994), dis-
cretization (Noering, 2022), or matrix profiles (Yeh
et al., 2016). Matrix profiles have found great interest
in unsupervised TSPR in recent years and are used as
a benchmark in this contribution. Nevertheless, the
nature of multivariate time series makes TSPR com-
putational intensive. To counteract the curse of di-
mensionality, DR methods are proposed in the follow-
ing.
2.2 Dimensionality Reduction of
Multivariate Time Series
The goal of DR methods is to find a low-dimensional
data representation that retains the most relevant prop-
erties for a given problem. Such methods can be di-
vided into four categories: rule-based, spectral, prob-
abilistic, and unsupervised learning-based methods.
Rule-based methods apply rules to reduce dimensions
of time series, such as averaging the values of each in-
dex over all time series dimensions or unifying them
under one symbol based on their discretized sym-
bolic representation (Noering, 2022). Spectral meth-
ods (Chaudhuri, 2006; Hotelling, 1933) are based on
the idea that higher-dimensional data can be repre-
sented in a lower-dimensional domain using a lin-
ear or nonlinear transformation. Probabilistic meth-
ods (McInnes et al., 2018; van der Maaten and Hin-
ton, 2008; Cattell, 1965) view the data as samples
from an unknown probability distribution. A low-
dimensional latent random variable can be assumed
on which the data depends. Unsupervised learning-
based methods learn the internal structure of data
when supplied with it. AutoEncoder (AE) (Rumelhart
et al., 1986) architectures can create so-called bot-
tlenecks through which the data is routed. Thereby,
data is compressed to its essentials, which is equiv-
alent to a DR. Additionally, Long Short-Term Mem-
ory (LSTM) (Hochreiter and Schmidhuber, 1997) net-
works can process sequential data. Dictionary Learn-
ing (Mairal et al., 2009) allows sparse data encoding
by a linear combination of basis vectors, a so-called
Dictionary. For this, an optimization problem must be
solved. An overview of all methods considered in this
paper can be seen in Table 1.
Table 1: Overview of Dimension Reduction Methods.
Rule-Based Spectral Probabilistic
Unsupervised
Learning
Unification PCA t-SNE Autoencoder
Averaging FPCA UMAP LSTM Autoencoder
Factor Analysis Dictionary Learning
Although the strengths and weaknesses of these
methods are well known, there is no research on the
impact of DR on TSPR in terms of information loss
and computational efficiency. For that purpose, the
concept of a comparative analysis is described in the
following.
ICPRAM 2024 - 13th International Conference on Pattern Recognition Applications and Methods
810

Preprocessing
Dimensionality
Reduction
Pattern
Recognition
Pattern
Recognition
Evaluation
Real Data
Synthetic Data
Data Sources
Figure 1: Overview of the concept for evaluating dimension reduction for pattern recognition.
3 CONCEPT
3.1 Process
This paper evaluates ten DR methods for unsuper-
vised TSPR in MTS to investigate the advantages and
disadvantages of processing without DR. This is done
in an organized manner by predefined concept (see
Figure 1). It consists of five steps: data acquisition,
preprocessing, optional DR, TSPR, and evaluation.
This paper uses synthetic and real datasets. Fur-
ther discussions are in Section 3.3 and 3.2. Z-
normalization, Piecewise Aggregate Approximation
(PAA), and Symbolic Aggregate approXimation
(SAX) can be used as optional preprocessing meth-
ods. This study aims to accelerate the search for pat-
terns in MTS using DR. However, this can result in a
loss of information in data representation (Wang et al.,
2016), making it necessary to examine the suitabil-
ity of reduced data for unsupervised TSPR. Matrix
profiles as TSPR algorithm is applied after prepro-
cessing, considering both the dimension reduced (up-
per path) and original (lower path) data. This paper
uses the implementation stumpy (Law, 2019), which
allows TSPR for UTS and MTS. The application of
TSPR to the dimensionally reduced and the original
data allows statements to be made about the influence
of DR on TSPR.
This study examines the results of dimension-
reduced time series compared to non-dimension-
reduced ones. Since the synthetically generated
data contains much less incorporated pattern sam-
ple points compared to the overall number of sam-
ple points, is considered to be unbalanced. Thus, F1
score (Sokolova et al., 2006) is used a metric to eval-
uate the precision and recall of TSPR algorithms. In
addition, the gain or loss of ∆F1
a
of the reduced data
F1 score F1
RPR
in comparison to the original data F1
score F1
PR
is calculated by
∆F1
a
=
F1
RPR
−F1
PR
F1
PR
, (1)
with ∆F1
a
∈[−1, 1], where −1 means 100 % loss and
1 means 100 % gain of the dimension reduced data.
The computational efficiency ∆t
a
is analyzed by com-
paring the runtime of the dimension reduction t
DR
and
the TSPR on the reduced data t
RPR
with the runtime
of the TSPR the original data t
PR
:
∆t
a
=
t
PR
−(t
DR
+t
RPR
)
t
PR
, (2)
with ∆t
a
∈ [−1,1], where −1 means 100 % compu-
tational efficiency loss and 1 means 100 % computa-
tional efficiency gain of the dimension reduced data.
3.2 Discussion on Synthetic and
Real-World Data
One of the main benefits of synthetic datasets is that
they are entirely labeled by nature. That is why they
require less time and effort to prepare for analysis
and experimentation. They are helpful in study fields
with privacy problems, since they also eliminate pri-
vacy and confidentiality difficulties. Although syn-
thetic datasets can be tuned to produce flawless re-
sults, they can also accidentally skew data or overfit
models. Despite their benefits, synthetic datasets may
fail to capture real-world processes accurately. Be-
cause of their inability to capture intricacies in real-
world events when generalizing conclusions based
on synthetic data, undertaking extensive validation in
real-world contexts is still necessary.
Real-world datasets provide an excellent oppor-
tunity for investigating characteristics that synthetic
datasets may miss. Their variety and diversity al-
low for investigating features, discovering unexpected
patterns, and improving the validity and application of
study findings. Real-world datasets have advantages
but drawbacks, such as the time and money required
to gather and manage big, diverse, and representative
datasets. Data collection and labeling take time and
effort to assure quality and dependability. Concerns
about privacy and confidentiality occur when dealing
with sensitive material, limiting access, and placing
legal and ethical constraints on research operations.
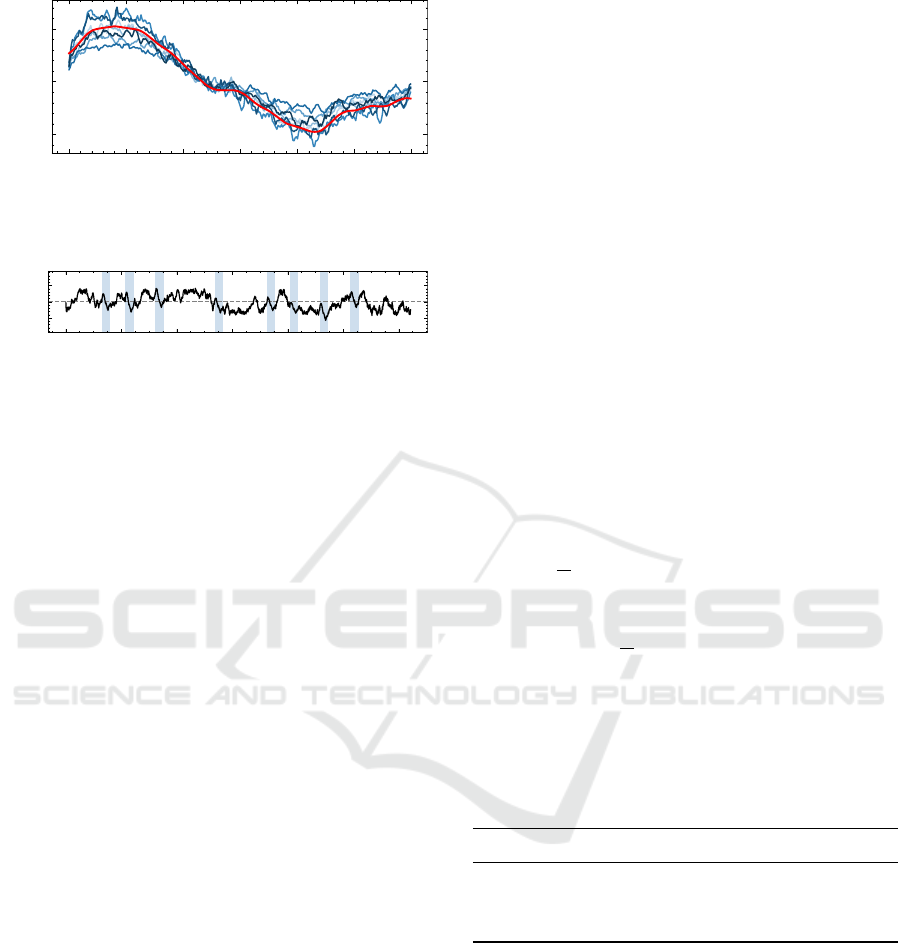
3.3 Synthetic Data Generation
To generate synthetic time series, a random
walk (Pearson, 1905) is utilized, as is also recom-
mended for pattern recognition in the literature (No-
ering, 2022). Therefore, a broader examination for
Comparison of Dimension Reduction Methods for Multivariate Time Series Pattern Recognition
811
0
50
100
150
200
250
300
Temporal sampling points (no unit)
−50
0
50
Value points (no unit)
(a) A 1-dimensional pattern with its template (red) and vari-
ations (blue shapes).
0 2000 4000
6000
8000 10000 12000
Temporal sampling points (no unit)
−100
0
100
y
0
(b) A synthetically created 1-dimensional time series with
a single pattern incorporated in several occurrences (blue
background).
Figure 2: Synthetic data generated via the random walk ap-
proach.
use cases other than driving TSPR may be conducted.
The test patterns may include all randomly produced
forms. Nonetheless, the synthetic data must be ver-
ified as a suitable foundation for a valid comparison
of DR. As a result, restrictions are put on the syn-
thetic time series data to meet the given objectives,
which are defined as follows in the current study: The
synthetic MTS can either contain full-dimensional
or sub-dimensional patterns without time warping or
shifts in pattern variances. Pattern class instances
should have different noise levels and amplitude val-
ues, as sensor signals are noisy. Time series data
should be within a predefined range, but seasonality
and wear and tear may be present.
Using the random walk approach, the n-
dimensional random walk generates random se-
quences of arbitrary length. It creates pattern tem-
plates and variations to assemble multiple patterns
in a time series with random connections. Five dis-
tinct trends are created: strong-up, up, stay, down,
and strong-down. When the trend time is exceeded,
a new trend type is selected randomly, but two super
trends cannot follow each other. The resulting curve
is smoothed using linear convolution and scaled or
squashed according to predefined values.
Variations are made by adding white Gaussian
noise and amplitude scaling individually for each di-
mension, resulting in a variable signal-to-noise ratio
(see Figure 2a). The desired order of pattern oc-
currences is randomly created, and multi-dimensional
patterns appear within the time series. A symmetrical
random walk with random length and white Gaussian
noise connects the patterns. The link and patterns are
shifted along the value axis, preventing value jumps
within the series (see Figure 2b). The resulting series
is smoothed and covered with white Gaussian noise,
and the same procedure is applied for all dimensions.
The method generates 100 three-dimensional time se-
ries with 10k data points with obvious patterns by ad-
justing scaling or noise parameters. Amplitude differ-
ences or noise levels can control the obviousness. To
ensure application relevance, the randomly generated
data must be correlated to some degree, allowing for
multivariate TSPR and DR. Real-world sensor data is
correlated to some degree, allowing for multivariate
TSPR and DR. For example, the angle of an acceler-
ator pedal and measurement data of an Inertial Mea-
surement Unit (IMU). Synthetic data can embed sim-
ple patterns, which search algorithms can easily find
due to their conciseness. However, this is unrealistic.
Three datasets with different cross-instance dis-
tances CR
dist
and pattern amplitudes MA were created
to test the effectiveness of DR and TSPR in different
difficulty levels (see Table 2).
CR
dist
=
1
N
|P|
∑
n=1
m
∑
i, j=1
|Z (M
i
) −Z (M
j
)|, i ̸= j, (3a)
MA =
1
N
|P|
∑
n=1
m
∑
1
max(Z (M
i
)), (3b)
where Z is the Z-Score normalization, |P| the number
of patterns, m the number of members in each pattern,
and N the total number of members over all patterns.
Table 2: Overview of the cross-instance distances and pat-
tern amplitudes of three generated benchmark datasets.
Case CR
dist
MA
I 2.95 0.94
II 3.57 0.86
III 4.32 0.75
4 EVALUATION
The evaluation aims to examine ten used DR meth-
ods for unsupervised TSPR in MTS. Therefore, the
benefits and drawbacks of DR for TSPR versus non-
reduction processing are investigated. A synthetic
dataset (see Section 4.1) and a real-dataset (see Sec-
tion 4.2) are used to compare the DR methods in
TSPR.
ICPRAM 2024 - 13th International Conference on Pattern Recognition Applications and Methods
812
4.1 Synthetic Data
4.1.1 Selection of Suitable Methods for
Dimension Reduction
Three-dimensional time series are synthetically gen-
erated as a full-dimensional TSPR problem. As pre-
processing, only z-normalization has been applied.
These dimensions were reduced to one dimension to
evaluate the effectiveness of different DR methods.
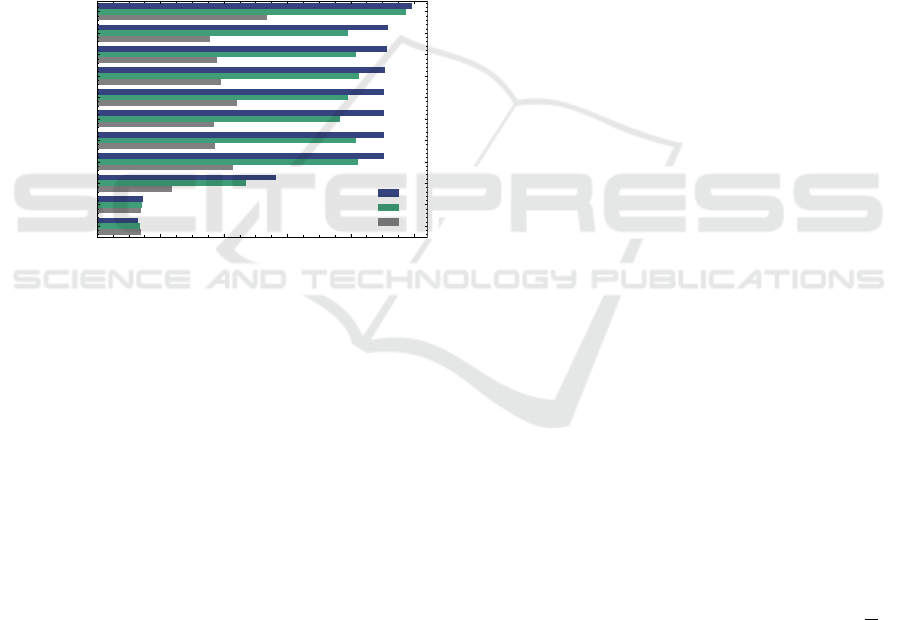
The hypothesis that larger amplitude and smaller dis-
tance make patterns easier to find is confirmed by pat-
tern search results. For cases I and II, F1 values are
good, while for case III, the values are worse. This
correlation is also observed for reduced time series,
indicating that pattern difficulty is not a significant
factor in evaluating reduction methods (see Figure 3).
0.0 0.2 0.4
0.6
0.8 1.0
F1
Original MTS
FPCA
AE
FA
Dictionary Learning
Avaraging
LSTM AE
PCA
Unification
UMAP
t-SNE
Case
I
II
III
Figure 3: Results of pattern recognition with and without
prior dimensionality reduction on different pattern proper-
ties (Table 2).
It can be seen from the results that Factor Anal-
ysis (FA), Functional PCA (FPCA), and AE are the
most promising DR methods due to performing the
best throughout the different cases.
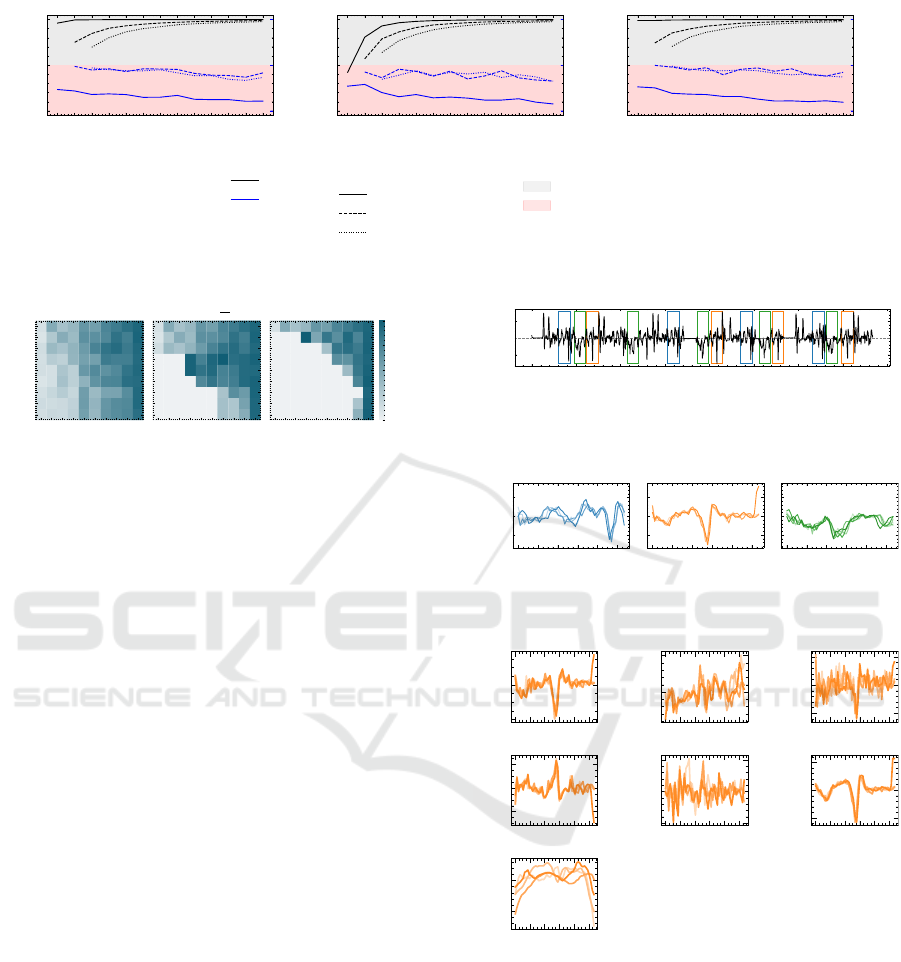
4.1.2 Runtime Analysis of Dimension Reduction
DR in TSPR aims to save time by analyzing di-
mensionally reduced time series compared to original
data, speeding up the analytical process. The evalu-
ation of dimension reduction methods involves com-
paring their runtime with (2). Time series are synthet-
ically generated as a full-dimensional TSPR problem
with dimensions from 2 to 14 reduced to 1, 2, and
3 dimensions. Each reduction process is tested ten
times to compensate for measurement variations. For
this analysis, the top three reduction methods regard-
ing their F1 score, as mentioned in Figure 3, are used.
The loss and gain of computational efficiency
∆t
a
of dimension reduction by Principal Component
Analysis (PCA), AE, and FA is shown in Figure 4.
In this scenario, the training of the AE is done in
three epochs with a batch size of six, and there is no
need to retrain after each sample.
The inference times for individual methods are in-
significant compared to the time required for TSPR.
A benefit in speed is nearly always present compared
to multivariate TSPR on all initial dimensions, re-
gardless of the combination of initial or reduced di-
mensions. The lower the number of reduced dimen-
sions, the higher the benefit. The percentage bene-
fit also increases with the number of original dimen-
sions. However, AE training can have a negative im-
pact when the distance between the number of orig-
inal dimensions and the number of reduced dimen-
sions is less than three.
In conclusion, a reduction generally leads to a
speed benefit. The higher the distance between the
original MTS dimensions compared to the reduced
time series, the higher the temporal benefit. From Fig-
ure 4, it can be seen that the decision on how many
dimensions the original MTS should be reduced has
an impact on the overall performance of the TSPR al-
gorithm. Therefore, it is recommended to investigate
the optimal number of dimensions before analysis.
4.1.3 Dealing with Sub-Dimensional Patterns in
Reduced Dimension
To find the optimal number of reduced dimension
n
y,opt
, the dimension reduction method FA is tested
by reducing a 10-dimensional MTS to all possible di-
mensions n
y
∈[1,2,... , 9]. The study aims to find the
optimal number of components n
y
, which is the num-
ber of dimensions of the reduced time series T , to
achieve the best possible results in TSPR. However,
an additional problem arises during TSPR: the pat-
terns in the reduced times series T do not necessarily
have to be a full-dimensional TSPR problem. Speci-
fying the minimum number of dimensions in which
a sub-dimensional pattern should occur in a multi-
dimensional pattern search is necessary. The test is
performed in three cases:
1. Sub-dimensional TSPR problem with |k| ≥ 1.
2. Sub-dimensional TSPR problem with |k| ≥
j
n
y
2
k
.
3. Full-dimensional TSPR problem with |k| = n
y
.
The test results are displayed as heatmap matrices,
with each heatmap showing one of the three test cases
(see Figure 5).
The patterns’ dimensions n
m
are horizontally dis-
played, and the number of reduced time series’ di-
mensions n
y
are vertically displayed. The F1 score
Comparison of Dimension Reduction Methods for Multivariate Time Series Pattern Recognition
813
2 3 4
5 6
7 8 9 10 11 12 13 14
Number of Original Dimensions n
−100
0
100
∆t
a
[%]
AE
2 3 4
5 6
7 8 9 10 11 12 13 14
Number of Original Dimensions n
−100
0
100
FA
2 3 4
5 6
7 8 9 10 11 12 13 14
Number of Original Dimensions n
−100
0
100
FPCA
−100
0
100
−100
0
100
−100
0
100
−100
0
100
−100
0
100
−100
0
100
−100
0
100
∆F1
a
[%]
−100
0
100
∆F1
a
[%]
−100
0
100
∆F1
a
[%]
Metric:
∆t
a
∆F1
a
Number of Reduced
Dimensions n
y
1
2
3
Impact on Metric:
Gain
Loss
Figure 4: Loss and Gain of ∆F1
a
and computation time ∆t
a
of different dimension reduction methods in pattern recognition.
1 2 3 4 5 6 7 8 9 10
n
m
123456789
n
y
|k| ≥ 1
1 2 3 4 5 6 7 8 9 10
n
m
|k| ≥ b
n
y
2
c
1 2 3 4 5 6 7 8 9 10
n
m
|k| = n
y
0.00
0.25
0.50
0.75
1.00
F 1
Figure 5: Heatmaps displaying the F1 score of pattern
recognition after reduction with FA regarding different
numbers of dimensions as well as dimensions of patterns.
values are indicated in color, with dark values repre-
senting high scores and light values representing low
scores. The smaller n
m
, the more difficult it is to find
the pattern in the reduced time series. This is because
the fewer dimensions contribute to a pattern, and the
less FA can identify and reproduce it. The relation-
ship between the number of dimensions in a reduced
time series and the size of the pattern is influenced
by the number of dimensions. The smaller the pat-
tern dimensions in the original MTS and the larger
the number of dimensions reduced, the less well the
pattern is found. The best possible combination of
n
m
, n
y
, and min n
m,r
cannot be guaranteed and must
be determined at the beginning of each new analysis.
4.2 Real-World Data
The Commercial Vehicles Sensor Dataset (AB, ) is
used to validate TSPR on a reduced dataset. The
dataset classifies the activities of two dumpers dur-
ing regular use. Dumpers have various states, such
as idle, driving, loading, dumping, and engine-off, la-
beled in their MTS data. These states are less detailed
and suitable for classifying operating modes, but re-
curring events within these modes require unsuper-
vised TSPR. The data is z-normalized and analyzed
using a 100 Hz sampling rate for MTS acquisition.
Data reduction is performed using a 128-sequence
SAX dictionary with 256 symbols converted from let-
ters to floating point numbers, as both matrix pro-
files and DR methods work with numeric data. Time
0
250 500 750
1000
1250 1500 1750
2000
Time [s]
−2.5
0.0
2.5
y
11 110 00 0 22 22 2
(a) Reduce time series by FA with recognized patterns. The
top three patterns were drawn with different colored boxes.
0 12 24
36
48
60
Time [s]
−2.5
0.0
2.5
y
Pattern 0
0 12 24
36
48
60
Time [s]
Pattern 1
0 12 24
36
48
60
Time [s]
Pattern 2
(b) Extracted value curves of the patterns found in the re-
duced time series.
0 12 24
36
48
60
−2
0
gFx
0 12 24
36
48
60
0
1
gFy
0 12 24
36
48
60
−0.5
0.0
0.5
gFz
0 12 24
36
48
60
−2
0
2
wx
0 12 24
36
48
60
Time [s]
−1
0
1
wy
0 12 24
36
48
60
Time [s]
−2.5
0.0
2.5
wz
0 12 24
36
48
60
Time [s]
0
1
speed
(c) Sensor values at the location of the found pattern 2.
Figure 6: Results of real-world data pattern recognition.
frames during idle or engine-off mode are removed, as
they lack useful patterns and are irrelevant to the anal-
ysis. The dataset has seven dimensions, reduced using
FA for synthetic data and MTS reduced to one dimen-
sion. Pattern classes are represented by the same box
color, with value curves of pattern instances repre-
sented by different shades (see Figure 6a). Three pat-
terns with the smallest z-normalized Euclidean dis-
ICPRAM 2024 - 13th International Conference on Pattern Recognition Applications and Methods
814

tance are marked with colored boxes in the reduced
time series. Value curves are extracted and displayed
in separate diagrams for all classes (see Figure 6b).
The question remains whether these patterns in
the reduced time series are also present in the orig-
inal MTS. Therefore, as an example, the original
segments of the identified pattern 2 are investigated
(see Figure 6c). Positive and negative correlations are
evident between sensor values, mainly between gy-
roscope data in x and z direction and accelerometer
data in x and z direction. Patterns are found between
variables of gyroscope data in x direction, accelerom-
eter data in x, and z direction, indicating a link be-
tween correlation and patterns. However, some sen-
sors have little to no correlation to other sensors, such
as speed and accelerometer data in y direction. A cor-
relation between sensor values is necessary for DR,
especially for PCA methods, which use correlation as
a primary factor. Patterns 0 and 2 show similar re-
sults, indicating that patterns found for reduced time
series also occur in the MTS. However, higher vari-
ances or noise among pattern instances occur in a sub-
set of the dimensions, making them sub-dimensional
patterns. Utilizing upstream DR for TSPR results in a
time saving of 89 % compared to multivariate cases.
5 CONCLUSION & OUTLOOK
This paper compares various methods for dimen-
sion reduction in the context of unsupervised pat-
tern recognition. As a result, Autoencoder, Func-
tional Principle Component Analysis (FPCA), and
Factor Analysis (FA) produce dimensionally reduced
data with the least loss of ∆F1
a
using a synthetic
dataset. Furthermore, dimension reduction with FA
and FPCA yields a runtime advantage of up to 90 %
over a non-reduced pattern search while losing only
18 % of ∆F1
a
. This result is validated with the real-
world dataset Commercial Vehicles Sensor Dataset.
However, the speed benefits must be weighed against
potential loss in accuracy and tested in advance, es-
pecially in the case of sub-dimensional pattern recog-
nition. Future studies can explore alternative pattern
algorithms, increase dataset diversity, investigate sub-
dimensional pattern recognition and variable pattern
lengths, and consider the temporal offset of patterns.
REFERENCES
AB, S. S. Commercial vehicles data set. Accessed: 2023-
04-11.
Alaee, S., Kamgar, K., and Keogh, E. (2020). Matrix profile
xxii: Exact discovery of time series motifs under dtw.
Proceedings - IEEE International Conference on Data
Mining, ICDM, 2020-November:900–905.
Bascol, K., Emonet, R., Fromont, E., and Odobez, J. M.
(2016). Unsupervised interpretable pattern discovery
in time series using autoencoders. Lecture Notes in
Computer Science (including subseries Lecture Notes
in Artificial Intelligence and Lecture Notes in Bioin-
formatics), 10029 LNCS:427–438.
Berndt, D. J. and Clifford, J. (1994). Using dynamic time
warping to find patterns in time series. In Proceed-
ings of the 3rd International Conference on Knowl-
edge Discovery and Data Mining, AAAIWS’94, page
359–370. AAAI Press.
Cattell, R. B. (1965). A biometrics invited paper. factor
analysis: An introduction to essentials ii. the role of
factor analysis in research. Biometrics, 21(2):405–
435.
Chan, N. H. (2007). Time series: applications to finance.
Statistica, 62.
Chaudhuri, P. (2006). Functional data analysis by j. o. ram-
say; b. w. silverman. Sankhy
¯
a: The Indian Journal of
Statistics (2003-2007), 68:364–365.
Dodge, Y. (2008). The concise encyclopedia of statistics.
Springer Science & Business Media.
Hochreiter, S. and Schmidhuber, J. (1997). Long short-term
memory. Neural computation, 9:1735–80.
Hotelling, H. (1933). Analysis of a complex of statistical
variables into principal components. Journal of Edu-
cational Psychology, 24:498–520.
Kam, H. J., Sung, J. O., and Park, R. W. (2010). Predic-
tion of daily patient numbers for a regional emergency
medical center using time series analysis. Healthcare
informatics research, 16(3):158–165.
Law, S. M. (2019). STUMPY: A Powerful and Scalable
Python Library for Time Series Data Mining. The
Journal of Open Source Software, 4(39):1504.
Mairal, J., Bach, F., Ponce, J., and Sapiro, G. (2009). Online
dictionary learning for sparse coding. In Proceedings
of the 26th Annual International Conference on Ma-
chine Learning, ICML ’09, page 689–696, New York,
NY, USA. Association for Computing Machinery.
McInnes, L., Healy, J., Saul, N., and Großberger, L. (2018).
Umap: Uniform manifold approximation and projec-
tion. Journal of Open Source Software, 3(29):861.
M
¨
orchen, F. (2006). Time series knowlegde mining. G
¨
orich
und Weiersh
¨
auser.
Noering, F. K. D. (2022). Unsupervised pattern discovery
in automotive time series.
Pearson, K. (1905). The problem of the random walk. Na-
ture 1905 72:1865, 72:294–294.
Petersen, P. and Sax, E. (2022). A fully automated method-
ology for the selection and extraction of energy-
relevant features for the energy consumption of bat-
tery electric vehicles. SN Computer Science, 3(5):342.
Rumelhart, D. E., Hinton, G. E., and Williams, R. J. (1986).
Learning representations by back-propagating errors.
Nature, 323:533–536.
Comparison of Dimension Reduction Methods for Multivariate Time Series Pattern Recognition
815

Sokolova, M., Japkowicz, N., and Szpakowicz, S. (2006).
Beyond accuracy, f-score and roc: A family of dis-
criminant measures for performance evaluation. vol-
ume Vol. 4304, pages 1015–1021.
van der Maaten, L. and Hinton, G. (2008). Viualizing data
using t-sne. Journal of Machine Learning Research,
9:2579–2605.
Wang, Y., Yao, H., and Zhao, S. (2016). Auto-encoder
based dimensionality reduction. Neurocomputing,
184:232–242.
Yan, Z. et al. (2017). Matrix profile ii: Exploiting a novel
algorithm and gpus to break the one hundred million
barrier for time series motifs and joins. IEEE 16th
International Conference on Data Mining (ICDM),
pages 739–748.
Yeh, C.-C. M. et al. (2016). Matrix profile i: All pairs
similarity joins for time series: A unifying view that
includes motifs, discords and shapelets. IEEE 16th
International Conference on Data Mining (ICDM),
pages 1317–1322.
ICPRAM 2024 - 13th International Conference on Pattern Recognition Applications and Methods
816
