
Heimatkunde: Dataset for Multi-Modal Historical Document Analysis
Josef Baloun
1,2 a
, V
´
aclav Honz
´
ık
1
, Ladislav Lenc
1,2 b
, Ji
ˇ
r
´
ı Mart
´
ınek
1,2 c
and Pavel Kr
´
al
1,2 d
1
Department of Computer Science and Engineering, University of West Bohemia, Univerzitn
´
ı, Pilsen, Czech Republic
2
NTIS - New Technologies for the Information Society, University of West Bohemia, Univerzitn
´
ı, Pilsen, Czech Republic
Keywords:
BERT, Deep Learning, Layout Analysis, Multi-Modality, Transformer.
Abstract:
This paper introduces a novel Heimatkunde dat aset comprising printed documents in German, specifically de-
signed for evaluating layout analysis methods with a focus on multi-modality. The dataset is openly accessible
for research purposes. The study further presents baseline results for instance segmentation and multi-modal
element classification. Three advanced models, Mask R-CNN, YOLOv8, and LayoutLMv3, are employed for
instance segmentation, while a fusion-based model integrating BERT and various vision Transformers are pro-
posed for multi-modal classification. Experimental findings reveal that optimal bounding box segmentation is
achieved with YOLOv8 using an input image size of 1280 pixels, and the best segmentation mask is produced
by LayoutLMv3 with PubLayNet weights. Moreover, the research demonstrates superior multi-modal clas-
sification results using BERT for textual and Vision Transformer for image modalities. The study concludes
by suggesting the integration of the proposed models into the historical Porta fontium portal to enhance the
information retrieval from historical data.
1 INTRODUCTION
Multi-modal document processing, which involves
the analysis of complex documents comprising mul-
tiple modalities such as text, images, audio, or video,
has become a rapidly growing area of research. This
is because the use of multiple modalities can compen-
sate for errors that may arise when only one modality
is employed. Such documents can range from books
and scientific papers to social media posts or medi-
cal data. This field closely follows advances in sev-
eral research fields such as natural language process-
ing (NLP), computer vision (CV) or automatic speech
recognition.
This work focuses on the utilization of modern
multi-modal techniques in order to perform document
layout analysis (DLA) on historical documents con-
taining visual and textual modalities. This task is usu-
ally composed of two steps: instance segmentation to
identify individual image components and the subse-
quent classification of these elements.
The main contribution of this paper is creating
a large document layout analysis dataset that can
a
https://orcid.org/0000-0003-1923-5355
b
https://orcid.org/0000-0002-1066-7269
c
https://orcid.org/0000-0003-2981-1723
d
https://orcid.org/0000-0002-3096-675X
be used for both image-only/multi-modal document
analysis. This dataset is freely available for research
purposes at https://corpora.kiv.zcu.cz/ heimatkunde/.
We further propose and implement a model for multi-
modal layout analysis and evaluate it on this dataset,
representing another contribution of this paper.
The outcomes of this work will be integrated into
historical Porta fontium portal
1
to improve informa-
tion retrieval from historical documents.
2 RELATED WORK
The following text introduces key concepts used in
multi-modal document processing as well as the state-
of-the-art models applicable to the task. We primarily
cover models that process images and text, as these
are the types of data processed in this paper, but many
of the techniques can be adapted to other modalities
such as audio or video.
The most common approach is to use state-of-the-
art networks for each modality and merge their out-
puts. This technique is commonly referred to as a
fusion. For image-text documents, this typically in-
volves the use of deep convolutional networks such
1
https://www.portafontium.eu/
Baloun, J., Honzík, V., Lenc, L., Martínek, J. and Král, P.
Heimatkunde: Dataset for Multi-Modal Historical Document Analysis.
DOI: 10.5220/0012428500003636
Paper published under CC license (CC BY-NC-ND 4.0)
In Proceedings of the 16th International Conference on Agents and Artificial Intelligence (ICAART 2024) - Volume 3, pages 995-1001
ISBN: 978-989-758-680-4; ISSN: 2184-433X
Proceedings Copyright © 2024 by SCITEPRESS – Science and Technology Publications, Lda.
995
as InceptionV3 (Szegedy et al., 2015), VGG16 (Si-
monyan and Zisserman, 2014), or vision-based Trans-
formers to process the visual part, and a Transformer
encoder model such as BERT (Devlin et al., 2018) to
process the textual modality.
A relatively simple, but in many cases effective,
approach is to use a linear combination of the output
probabilities from each network. For instance, Fer-
rando et al. (Ferrando et al., 2020) use EfficientNet
(for visual information) and BERT (for textual infor-
mation) on the Small-Tobacco and Big-Tobacco im-
age datasets with different weights for the modalities.
Gallo et al. (Gallo et al., 2020) concatenate the out-
puts of individual networks into a single vector, which
is then fed into another classifier model. The authors
use BERT and InceptionV3 to perform classification
on the Food101 (Bossard et al., 2014) dataset. They
use two variants of building the fused vector. Late fu-
sion uses class probabilities for each modality as input
to the classifier, while early fusion uses features from
the last hidden layer of each network.
The use of early and late fusion differs in each
paper using such a technique. The previously men-
tioned paper (Gallo et al., 2020) reports better results
with early fusion. In contrast, other papers such as
(Dauphinee et al., 2019) only use late fusion.
With the rise of self-attention and Transform-
ers (Vaswani et al., 2017) in general, various fu-
sion blocks emerged. For example, audio and visual
modalities are fused in (Huang et al., 2020) using the
multi-head attention. The visual features are encoded
as query and audio features as key and value. Self-
attention is used also in (Prakash et al., 2021) to fuse
image and LiDAR inputs. Mid-fusion and fusion bot-
tlenecks are presented in (Nagrani et al., 2021). In
short, it uses the Transformer and a multi-modal in-
put that consists of individual modality tokens and op-
tionally bottleneck tokens. Depending on the context,
the token can attend to bottleneck tokens or other to-
kens including different modalities.
3 HEIMATKUNDE DATASET
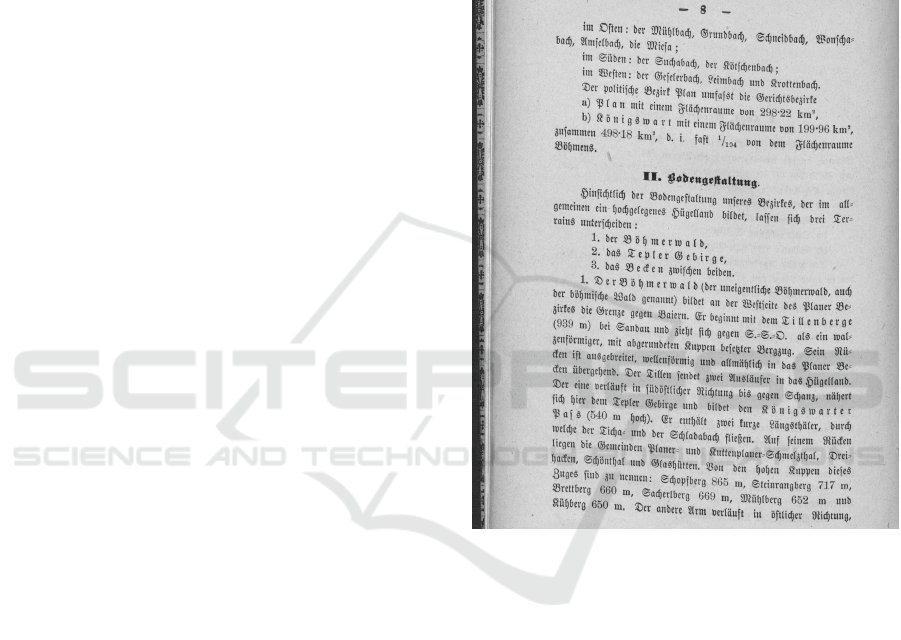
We use images from two historical books de-
scribing political districts in the Czech Republic -
Heimatkunde des Ascher Bezirkes (Local History of
the A
ˇ
s District) by J. Tittmann and Heimatkunde
des politischen Bezirkes Plan (Local History of the
Plan
´
a District) by Georg Weidl. Due to the name
of the books, we name the resulting dataset the
Heimatkunde dataset. The documents contain infor-
mation about the geography, agriculture, population,
administration, education, and local history of the dis-
tricts at the end of the 19th century. The text in both
books is printed in Fraktur font and written in Ger-
man.
The scanned images contain two pages. Most of
the pages have a conventional one-column layout in
a portrait format. The scans are grayscale with a very
high resolution (300 DPI and most of the images are
around 3400 × 2500 pixels in height and width). An
unprocessed example from the dataset can be seen in
Figure 1.
Figure 1: Example of an unprocessed page from the dataset.
In total, both books contain 468 images (930
pages). For our dataset, we use only a subset - 329
images, which we have manually annotated for the
document layout analysis task.
3.1 Classes
There are 7 types of objects that we identify in the
dataset. Although some of the original documents
contain images, we decided not to include them as
there are only 10 images in both books and such
a sample size is not enough to perform training or
validation. Consequently, all of the 7 classes contain
some form of text, which should however be advan-
tageous for multi-modal processing since the model
can always utilize both sources of information. The
classes of the document entities are as follows:
• Paragraph - larger block of text, often with an
ICAART 2024 - 16th International Conference on Agents and Artificial Intelligence
996
indented first line.
• Heading - bold text in a different font style that is
one or few lines long.
• Footnote - contains miscellaneous information,
located at the bottom of the page, separated from
paragraphs by a line.
• Page number - always at the top of the page.
• Table - collection of rows and columns, often with
different formatting. May or may not have bor-
ders.
• List / Listing - list of items, e.g. animal species,
list of inhabitants, etc.
• Centered text - typically a small portion of
text containing quotations, smaller font size than
a paragraph.
Each of the selected categories should be either
semantically or visually distinct. Additionally, some
classes such as page numbers or footnotes only appear
in certain parts of the layout, which is another source
of information that could, in theory, be exploited by
the model.
Arguably the two most difficult elements to rec-
ognize/classify should be tables and centered text.
While centered text appears consistently throughout
the data, there are not many samples (see Table 1 in
the following section), and tables, on the other hand,
can have several formats. One solution would be to
create a separate class for each type of table but this is
likely not feasible here as the number of tables in the
text is low as well.
3.2 Annotation Process
To create the annotations we use a widely used Com-
puter Vision Annotation Tool – CVAT
2
(CVAT.ai Cor-
poration, 2022). Arguably one of the main benefits of
this application is that it is open-sourced and can be
deployed locally in Docker.
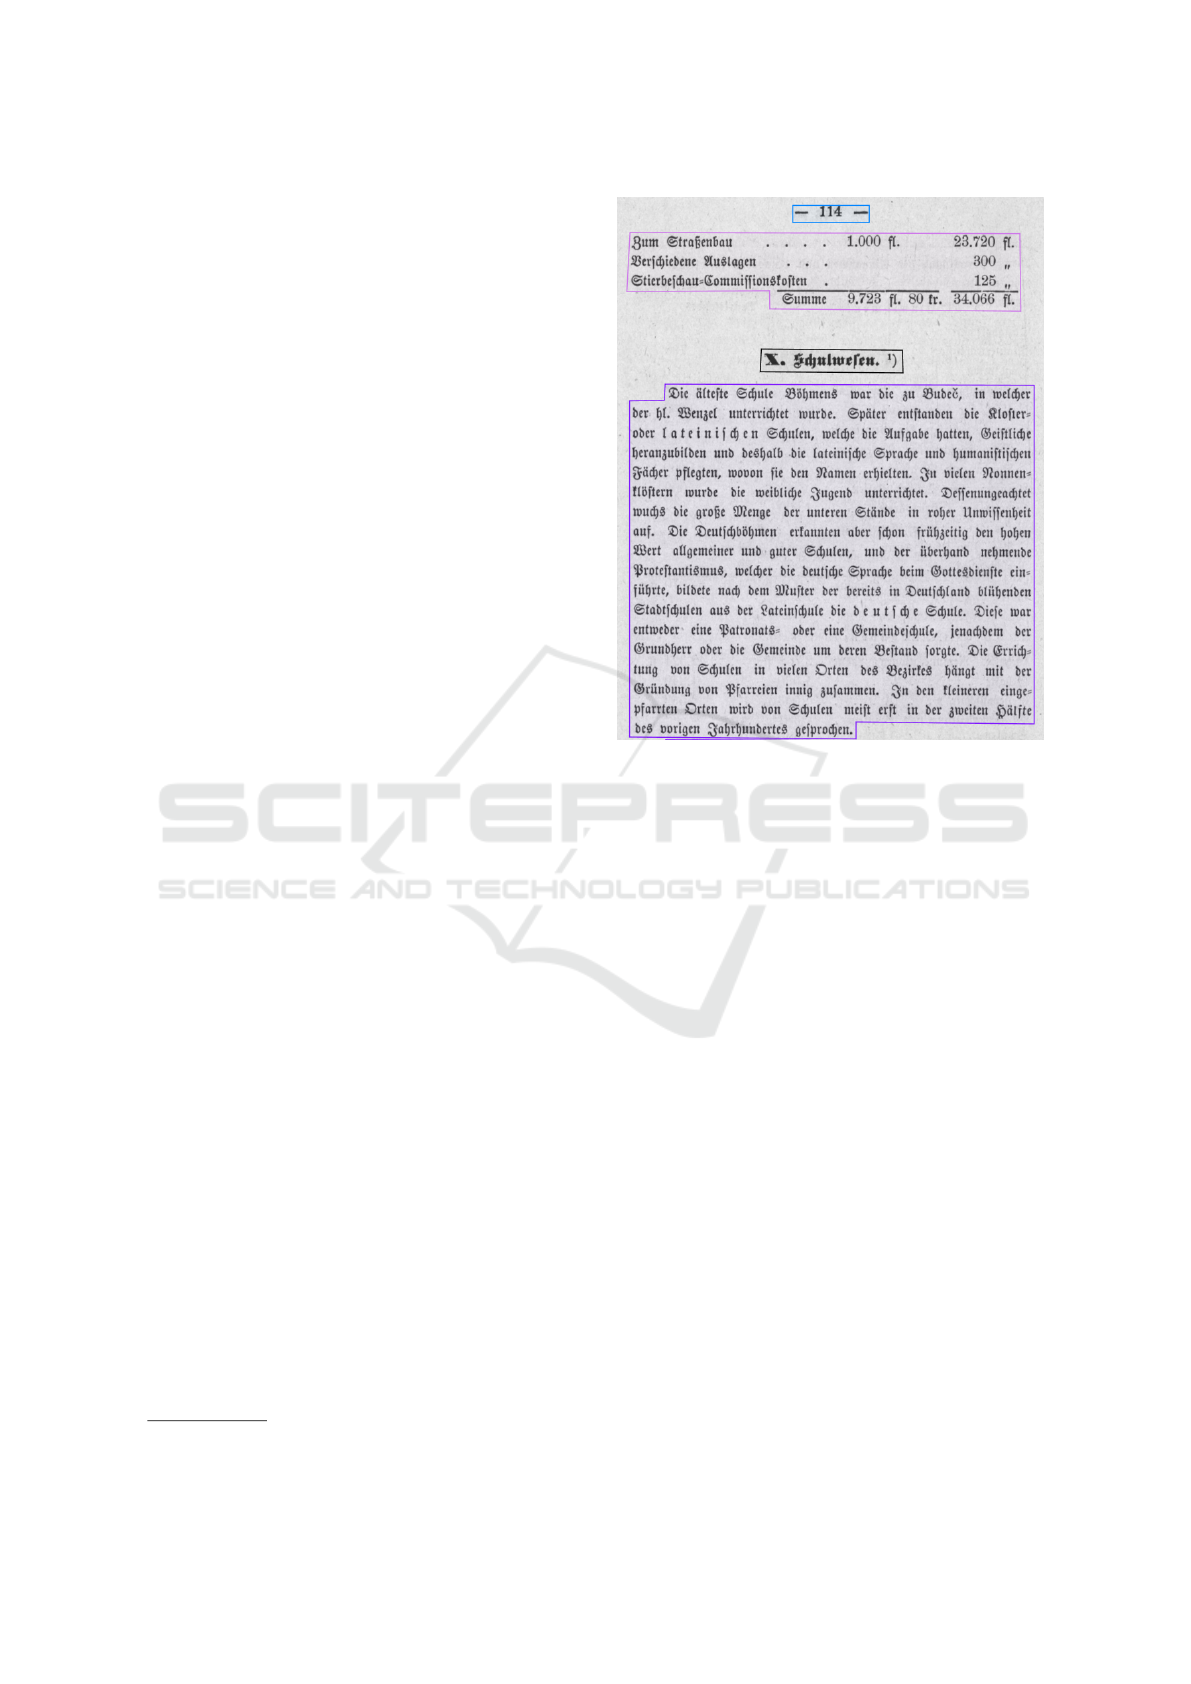
All the images are annotated for the instance seg-
mentation task, where we mark the area of each object
by a bounding polygon. An example of the annota-
tion from the editor can be seen in Figure 2. Addi-
tionally, we also save bounding boxes of each object
(simply by using the minimum and maximum of x and
y coordinates), as they are used to extract additional
data such as text that is needed for the experiments.
The annotations are converted to the COCO for-
mat, which makes the most sense for our use case
as this format is directly supported by many image
segmentation frameworks. Additionally, it is very
2
https://github.com/opencv/cvat
Figure 2: An example of the annotation in the CVAT appli-
cation. There are four classes in the image - page number
(blue), table (pink), heading (black), and paragraph (pur-
ple).
straightforward to work with and can be easily trans-
formed into other formats such as YOLO.
3.3 Resulting Dataset
As a result of the annotation process, we obtained
a dataset that can be used for layout analysis in histor-
ical documents. In total, there are 4.640 annotations
across 329 images. The created dataset has a rela-
tively large imbalance between the classes, which is to
be expected since some elements such as paragraphs
occur much more frequently than elements such as ta-
bles or footnotes.
The counts of the individual classes can be seen
in Table 1. The two most common types of entities
are paragraphs and listings. On the other hand, cen-
tered text and tables appear infrequently and should
be harder for the model to detect.
Finally, we split the dataset for training and eval-
uation. Approximately 70% of the dataset is used for
training while the remaining 30% is kept as evaluation
data. The counts for each split can be seen in Table 2.
Heimatkunde: Dataset for Multi-Modal Historical Document Analysis
997

Table 1: Number of occurrences for each class in the
dataset, sorted according to class frequencies.
Class name Count [%]
Paragraph 2079 44.8
Listing 1306 28.1
Page number 640 13.8
Heading 378 8.1
Footnote 107 2.3
Table 91 2.0
Centered text 39 0.8
Total 4640 100
Table 2: Number of occurrences for each class in the train-
test split, sorted according to class frequencies.
Train Test
Class name Count [%] Count [%]
Paragraph 1483 45.4 596 43.5
Listing 921 28.2 385 28.1
Page number 447 13.7 193 14.1
Heading 264 8.1 114 8.3
Footnote 74 2.3 33 2.4
Table 59 1.8 32 2.3
Centered text 22 0.7 17 1.2
Total 3270 100 1370 100
3.3.1 OCR Subset
In addition to the document layout analysis variant of
our dataset described above, we also annotate a subset
of its images with a text layer used for training and
evaluation of OCR models.
Each example comprises an image that contains
a text line as well as a corresponding ground truth la-
bel. Such examples are shown below in Figures 3 and
4.
Figure 3: Example of a test sample with reference text: ”des
Volkes, das er
¨
uber alles in der Welt liebe. Der J
¨
ungling ge-
”.
For training, we use two variants of the dataset.
The first variant contains only the annotated exam-
ples from our dataset, which is around 14 pages, or
782 lines. The other variant is larger and includes our
annotations as well as annotations from the Historical
German OCR Corpus (Mart
´
ınek et al., 2019). This
OCR dataset contains very similar data and has 1386
lines. In total, the second variant results in 2168 lines
of text.
For the evaluation, we annotated around 12 pages,
resulting in 439 lines or 4430 words. Such a sample
size should provide meaningful enough results to es-
timate the performance of an OCR model.
Figure 4: Example of a test sample with reference text: ”er-
streckte sich
¨
uber die Bezirke von Weiden, Thierstein, Asch
und El-”.
4 APPROACH
As mentioned previously, the whole task is decom-
posed into two steps: instance segmentation and ele-
ment classification which are subsequently described
below.
4.1 Instance Segmentation
An instance segmentation model is used to detect the
individual components in the document. We analyse
and compare three different models for this task.
YOLO and Mask R-CNN are used since they
are commonly employed for instance segmentation,
while the LayoutLMv3-based model is used be-
cause it achieves state-of-the-art results on vari-
ous document layout analysis datasets such as Pub-
LayNet (Zhong et al., 2019).
4.1.1 Mask R-CNN
Mask R-CNN is one of the most popular solutions for
instance segmentation. We use Mask R-CNN imple-
mented in Detectron2
3
(Wu et al., 2019), which is an
image segmentation/object detection framework de-
veloped by the authors of PyTorch. Specifically, we
use the mask rcnn R 50 FPN 3x configuration, which
utilizes ResNet50 as its backbone.
4.1.2 YOLO
As a second model, the latest iteration of YOLO is
used - YOLOv8
4
, which is developed by Ultralytics
(Jocher et al., 2023). The advantage of this model
is its scalability, as it can even be deployed on mo-
bile devices or e.g. Raspberry Pi because the small-
est model n has only 3.4M parameters. On the other
hand, larger variants l and x should match or exceed
the performance of Mask R-CNN.
In the context of our implementation, the main
drawback of the model is that it is not directly im-
plemented in Detectron2, which requires additional
effort to incorporate it into our multi-modal system.
We choose to use the l variant of the model, as it has
a similar number of parameters to Mask R-CNN.
3
https://github.com/facebookresearch/detectron2
4
https://github.com/ultralytics/ultralytics
ICAART 2024 - 16th International Conference on Agents and Artificial Intelligence
998
4.1.3 LayoutLMv3 with Cascade R-CNN
The third model is based on LayoutLMv3. The im-
plementation used is adapted from the official reposi-
tory
5
and also utilizes Detectron2 for training and in-
ference.
The main advantage of this model over YOLOv8
and Mask R-CNN should be its multi-modal pre-
training. We expect this model to perform the best
since all our classes contain textual features. The net-
work is used as a backbone, while the segmentation is
performed by Cascade R-CNN.
The detected instance images and their corre-
sponding text are then used as input for the subse-
quent multi-modal classifier.
4.2 Multi-Modal Classification
Using both text and image features in a multi-modal
way might improve the number of correct predictions,
especially in cases where semantics is important. Al-
ternatively, should the model not yield better results,
it can still be useful, e.g. for further validation of the
document layout analysis results, where we can be
more certain if both classifier and segmentation pre-
dictions match.
We employ a fusion model that uses early fusion
to generate the prediction for this task.
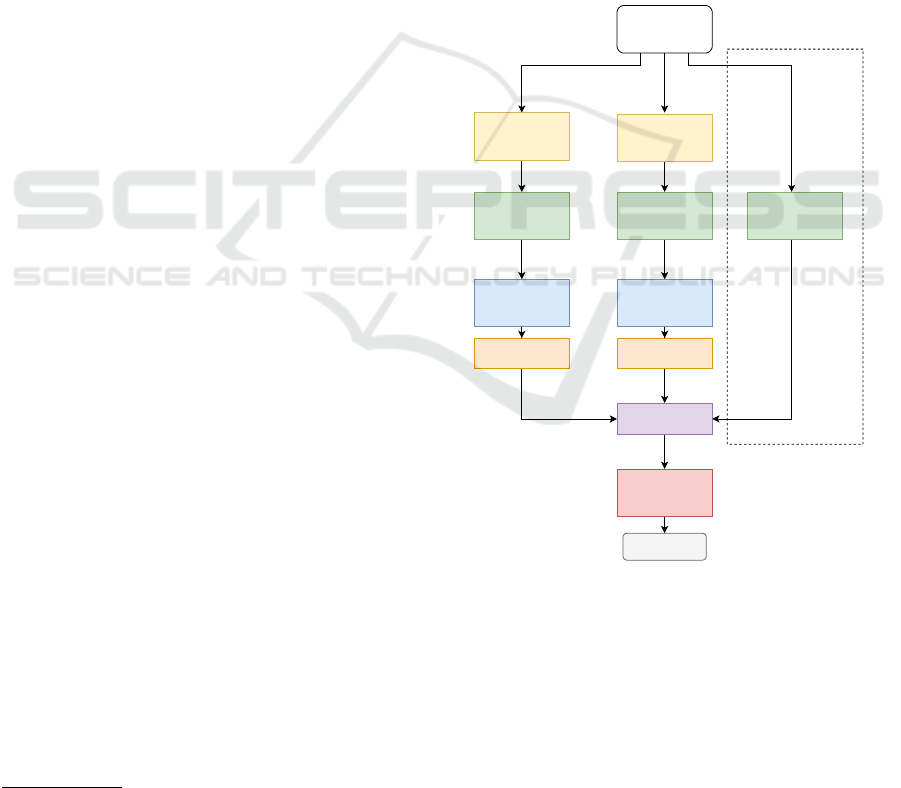
4.2.1 Fusion-Based Model
The architecture of this network is depicted in Fig. 5.
To process the textual modality, we use a German pre-
trained variant of BERT. The visual stream is handled
by a vision Transformer - either ViT or Swin Trans-
former V2.
The architecture of the model follows early fusion
and thus, all of the variants of the Transformers are
used without a classification head on top and serve as
feature extractors. In our configuration, BERT pro-
duces a matrix with the shape of (512, 768), corre-
sponding to 512 768-dimensional word embeddings.
Similarly, ViT and Swin output either 197 or 49 of
identically long patch embeddings.
The features extracted from each modality should
reflect the sequence as a whole, for which a single
pass through a fully-connected layer is not optimal.
Therefore, we introduce an additional layer on top of
each Transformer output, which is an BiLSTM, sim-
ilarly to (Gallo et al., 2020). Additionally, it can be
used to harmonize the dimension vector length for the
different modalities.
5
https://github.com/microsoft/unilm/tree/master/
layoutlmv3
The outputs from both directions are concate-
nated, resulting in much more compact 128 or 256-
dimensional vectors, depending on the hyperparame-
ter configuration. To reduce the chance of overfitting
during training, the LSTM output is passed through
a dropout layer with 30% probability of being zeroed.
Finally, the vector is modified by the ReLU activation
and concatenated.
Depending on the hyperparameters, the fusion
model can also employ information from the bound-
ing box of the annotation. The data is passed via
perceptron with a single 64-neuron hidden layer, that
outputs a 16-dimensional vector. Subsequently, such
a vector is concatenated with text and image features
and fed to the fusion MLP. Note that we do not use the
additional LSTM layer for the bounding box features
because the data is not sequential and already has very
low dimensionality.
BERT ViT/Swin V2
BBox Feature
Extractor
Classification
Example
BERT
Tokenizer
Token
sequence
Tokens,
Attention mask
ViT/Swin V2
Feature Extractor
Instance
image
Bounding box
Information
Pixel values
BiLSTM BiLSTM
Word
Embeddings
Patch
Embeddings
(n, 768) (m, 768)
MLP
Class prediction
Concatenate
Layout
modality
Text
modality
Image
modality
(16)(128) (128)
(272)
Early fused
modalities
Optional - enabled
as a hyperparameter
Dropout
(training only)
Dropout
(training only)
Figure 5: Architecture of the early-fusion model. The shape
of the image/text features is either a 128 or 256-dimensional
vector.
Heimatkunde: Dataset for Multi-Modal Historical Document Analysis
999

5 EXPERIMENTS
5.1 Evaluation Metrics
For classification, we use standard accuracy, preci-
sion, recall and F1-score metrics (Hossin and Su-
laiman, 2015). For document layout analysis we
employ COCO evaluation metrics
6
, which are com-
monly used to evaluate the image segmentation of
state-of-the-art models.
5.2 Set-up
The hyper-parameters for all segmentation models
are depicted in Table 3. During training, the mod-
els are periodically evaluated on the test data, and
their best parameters are selected based on the COCO
AP@[0.50:0.95] metric.
Table 3: Hyperparameters and variants of the models -
model, input size, initial weights, learning rate, optimizer,
scheduler, and batch size.
Model Input
Init. Weights
LR Optimizer Scheduler Batch
Mask R-CNN 1280 COCO 1× 10
−4
SGD None 4
LayoutLMv3 1280 Default 2 × 10
−4
AdamW CosineLR 3
LayoutLMv3 1280 PubLayNet 2 ×10
−4
AdamW CosineLR 3
YOLOv8 1280 COCO 1× 10
−2
SGD OneCycleLR 2
YOLOv8 640 COCO 1× 10
−2
SGD OneCycleLR 4
5.3 Instance Segmentation Results
The results regarding bounding boxes are shown in
Table 4, while the results for segmentation masks
are shown in Table 5. The most important metric is
AP@[0.50:0.95] because it is averaged over 10 dif-
ferent Intersection over Union values.
Table 4: Bounding box COCO metrics of each model -
Mask R-CNN, LayoutLMv3 with Cascade R-CNN, and
YOLOv8. The best values are denoted in bold.
Model
Initial
weights
Input size
AP@
[0.50:0.95]
AP50 AP75
Mask R-CNN COCO 1280 73.55 94.75 88.08
LayoutLMv3 PubLayNet 1280 79.45 95.46 91.76
LayoutLMv3 Default 1280 73.59 91.64 82.38
YOLOv8 COCO 1280 83.64 95.68 94.37
YOLOv8 COCO 640 81.34 93.46 91.96
In terms of bounding box average precision, the
two best models are variants of YOLOv8 that pro-
cess either 640p or 1280p input. The 1280p variant
achieves an AP@[0.50:0.95] of 83.64, while the 640p
one attains an AP@[0.50:0.95] of 81.34. These re-
sults are surprising because both variants outperform
the much larger LayoutLMv3-based model, which is
6
https://cocodataset.org/\#detection-eval
Table 5: Segmentation COCO metrics of each model -
Mask R-CNN, LayoutLMv3 with Cascade R-CNN, and
YOLOv8. The best values are denoted in bold.
Model
Initial
weights
Input size
AP@
[0.50:0.95]
AP50 AP75
Mask R-CNN COCO 1280 75.12 93.84 89.07
LayoutLMv3 PubLayNet 1280 79.77 95.60 90.99
LayoutLMv3 Default 1280 75.22 91.80 85.77
YOLOv8 COCO 1280 76.34 95.81 86.54
YOLOv8 COCO 640 55.20 86.34 54.89
only competitive when trained with the PubLayNet
weights and achieves an AP@[0.50:0.95] of 79.45.
On the other hand, for the segmentation step, the
best variant is the LayoutLMv3-based model with the
PubLayNet weights, achieving an AP@[0.50:0.95] of
79.77. The second best model is the 1280p variant
of YOLOv8, closely followed by the LayoutLMv3-
based model with the default pre-training weights.
These models score an AP@[0.50:0.95] of 76.34
and 75.22 respectively. The least competitive
model is the 640p variant of YOLOv8 with 55.20
AP@[0.50:0.95].
5.4 Multi-Modal Classification Results
We evaluate several configurations of two fusion-
based models: BERT + ViT and BERT + Swin V2.
In total, we run 48 different configurations for BERT
+ ViT and BERT + Swin V2.
We select the best model based on its macro-
averaged F1. From all configurations, we collect the
three best ones for each model, which are depicted in
Table 6. The hyperparameters used for these models
are shown in Table 7.
The best F1 score of 97.38 is achieved by the fu-
sion model comprising BERT and ViT. The fusion
model using BERT and Swin Transformer V2 with
the same hyperparameters and an F1 of 97.24 is very
close to the best variant.
Table 6: F1, precision, recall and accuracy [%] of the top 3
variants of each model. The best values are denoted in bold.
F1, precision, and recall are macro averaged.
Model Configuration F1 Prec. Recall Acc.
BERT + ViT Fusion-34 97.38 98.16 96.72 96.28
BERT + ViT Fusion-2 97.21 98.02 96.46 96.20
BERT + ViT Fusion-1 96.95 97.34 96.59 95.69
BERT + Swin V2 Fusion-34 97.24 97.92 96.62 96.13
BERT + Swin V2 Fusion-7 96.85 97.80 95.98 95.69
BERT + Swin V2 Fusion-26 96.54 96.99 96.14 95.18
6 CONCLUSIONS
In this paper, we present a novel Heimatkunde dataset
composed of printed documents in German. This
ICAART 2024 - 16th International Conference on Agents and Artificial Intelligence
1000

Table 7: Hyperparameter configurations used in the top two
best models. Learning rate, number of steps in the learning
rate scheduler, whether to use bounding box features, size
of the extracted text vector from BERT, and size of the ex-
tracted image vector from ViT/Swin Transformer V2.
Configuration
Learning
rate
Scheduler
steps
BBox
features
Text vector
size
Image vector
size
Fusion-1 1 × 10
−5
None True 128 128
Fusion-2 1 × 10
−5
None True 128 256
Fusion-7 1 × 10
−5
1000 True 256 128
Fusion-26 1 × 10
−5
None False 128 256
Fusion-34 1 × 10
−5
1500 False 128 256
dataset is dedicated to the evaluation of methods for
layout analysis, with a focus on multi-modality. The
dataset is freely available for research purposes.
Next, we present baseline results for instance
segmentation and multi-modal element classification.
For instance segmentation, we employed three state-
of-the-art models, namely Mask R-CNN, YOLOv8,
and LayoutLMv3. For multi-modal classification, we
proposed a fusion-based model that combines BERT
with various vision Transformers.
We experimentally showed that the best segmenta-
tion of bounding boxes was obtained using YOLOv8
with an input image size of 1280 pixels, while the best
segmentation mask was produced by LayoutLMv3
with the PubLayNet weights.
We further demonstrated that the best multi-modal
classification results has been obtained with BERT for
textual and ViT for image modalities.
Based on these experimental results, we can con-
clude that the proposed models will be integrated into
Porta fontium portal to facilitate the information ex-
traction from historical data.
ACKNOWLEDGEMENTS
This work has been partly supported by the Grant No.
SGS-2022-016 Advanced methods of data processing
and analysis.
REFERENCES
Bossard, L., Guillaumin, M., and Van Gool, L. (2014).
Food-101–mining discriminative components with
random forests. In Computer Vision–ECCV 2014:
13th European Conference, Zurich, Switzerland,
September 6-12, 2014, Proceedings, Part VI 13, pages
446–461. Springer.
CVAT.ai Corporation (2022). Computer Vision Annotation
Tool (CVAT). https://github.com/opencv/cvat.
Dauphinee, T., Patel, N., and Rashidi, M. (2019). Modular
multimodal architecture for document classification.
Devlin, J., Chang, M.-W., Lee, K., and Toutanova, K.
(2018). Bert: Pre-training of deep bidirectional trans-
formers for language understanding.
Ferrando, J., Dom
´
ı nguez, J. L., Torres, J., Garc
´
ıa, R.,
Garc
´
ıa, D., Garrido, D., Cortada, J., and Valero, M.
(2020). Improving accuracy and speeding up docu-
ment image classification through parallel systems. In
Lecture Notes in Computer Science, pages 387–400.
Springer International Publishing.
Gallo, I., Ria, G., Landro, N., and Grassa, R. L. (2020).
Image and text fusion for upmc food-101 using bert
and cnns. In 2020 35th International Conference on
Image and Vision Computing New Zealand (IVCNZ),
pages 1–6.
Hossin, M. and Sulaiman, M. N. (2015). A review on evalu-
ation metrics for data classification evaluations. Inter-
national Journal of Data Mining & Knowledge Man-
agement Process, 5:01–11.
Huang, J., Tao, J., Liu, B., Lian, Z., and Niu, M. (2020).
Multimodal transformer fusion for continuous emo-
tion recognition. In ICASSP 2020-2020 IEEE Inter-
national Conference on Acoustics, Speech and Signal
Processing (ICASSP), pages 3507–3511. IEEE.
Jocher, G., Chaurasia, A., and Qiu, J. (2023). YOLO by
Ultralytics. https://github.com/ultralytics/ultralytics.
Mart
´
ınek, J., Lenc, L., Kr
´
al, P., Nicolaou, A., and
Christlein, V. (2019). Hybrid training data for his-
torical text OCR. In 15th International Conference on
Document Analysis and Recognition (ICDAR 2019),
pages 565–570, Sydney, Australia.
Nagrani, A., Yang, S., Arnab, A., Jansen, A., Schmid, C.,
and Sun, C. (2021). Attention bottlenecks for multi-
modal fusion. Advances in Neural Information Pro-
cessing Systems, 34:14200–14213.
Prakash, A., Chitta, K., and Geiger, A. (2021). Multi-
modal fusion transformer for end-to-end autonomous
driving. In Proceedings of the IEEE/CVF Conference
on Computer Vision and Pattern Recognition, pages
7077–7087.
Simonyan, K. and Zisserman, A. (2014). Very deep convo-
lutional networks for large-scale image recognition.
Szegedy, C., Vanhoucke, V., Ioffe, S., Shlens, J., and Wojna,
Z. (2015). Rethinking the inception architecture for
computer vision.
Vaswani, A., Shazeer, N., Parmar, N., Uszkoreit, J., Jones,
L., Gomez, A. N., Kaiser, Ł., and Polosukhin, I.
(2017). Attention is all you need. Advances in neural
information processing systems, 30.
Wu, Y., Kirillov, A., Massa, F., Lo, W.-Y., and Gir-
shick, R. (2019). Detectron2. https://github.com/
facebookresearch/detectron2.
Zhong, X., Tang, J., and Yepes, A. J. (2019). Publaynet:
largest dataset ever for document layout analysis. In
2019 International Conference on Document Analysis
and Recognition (ICDAR), pages 1015–1022. IEEE.
Heimatkunde: Dataset for Multi-Modal Historical Document Analysis
1001
