
Facial Point Graphs for Amyotrophic Lateral Sclerosis Identification
Nicolas Barbosa Gomes
1 a
, Arissa Yoshida
1 b
, Mateus Roder
1 c
,
Guilherme Camargo de Oliveira
1,2 d
and Jo
˜
ao Paulo Papa
1 e
1
Department of Computing, S
˜
ao Paulo State University (UNESP), Brazil
2
School of Engineering, Royal Melbourne Institute of Technology (RMIT), Australia
Keywords:
Neurodegenerative Disease, ALS, Graph Neural Networks, Facial Point Graph.
Abstract:
Identifying Amyotrophic Lateral Sclerosis (ALS) in its early stages is essential for establishing the beginning
of treatment, enriching the outlook, and enhancing the overall well-being of those affected individuals. How-
ever, early diagnosis and detecting the disease’s signs is not straightforward. A simpler and cheaper way arises
by analyzing the patient’s facial expressions through computational methods. When a patient with ALS en-
gages in specific actions, e.g., opening their mouth, the movement of specific facial muscles differs from that
observed in a healthy individual. This paper proposes Facial Point Graphs to learn information from the ge-
ometry of facial images to identify ALS automatically. The experimental outcomes in the Toronto Neuroface
dataset show the proposed approach outperformed state-of-the-art results, fostering promising developments
in the area.
1 INTRODUCTION
A gradual decline in the structure and functioning
of the central nervous system marks Neurodegenera-
tive Diseases (NDDs). The incidence and prevalence
of these diseases exhibit a sharp increase with age,
which means that life expectancy continues to rise in
many parts of the world. Consequently, the number of
cases is projected to grow in the future (Checkoway
et al., 2011). Despite the availability of certain treat-
ments that can relieve the physical or mental symp-
toms linked to NDDs, there is currently no known
method to slow down their progression or achieve a
complete cure.
Amyotrophic Lateral Sclerosis (ALS) is an NDD
that causes the gradual deterioration of motor func-
tions of the nervous system. Worldwide, the annual
incidence of ALS is about 1.9 per 100,000 inhabi-
tants (Arthur et al., 2016). Although there are doc-
uments, such as El Escorial, published by the World
Federation of Neurology (Brooks et al., 2000), ad-
dressing essential criteria regarding the diagnosis of
ALS, current concepts and definitions of ALS have
not yet been unified or standardized in clinical prac-
tice and are occasionally imprecise, causing difficul-
a
https://orcid.org/0000-0002-8571-8198
b
https://orcid.org/0000-0002-6715-4050
c
https://orcid.org/0000-0002-3112-5290
d
https://orcid.org/0000-0002-9698-2445
e
https://orcid.org/0000-0003-3529-3109
ties for neurologists in the clinical treatment of ALS.
In addition, patients face a delay in disease diagnosis
by approximately 18 months (Bandini et al., 2018a)
and an average survival of 3 to 5 years after diagno-
sis (Xu and Yuan, 2021). Since effective treatments
are currently unavailable, early and precise diagnosis
is crucial in maintaining patients’ quality of life as it
leads to earlier intervention and recruitment for clini-
cal trials.
Evaluating the facial expression of people is one
effective way to diagnose neurological diseases, for
the subject may lose a significant amount of verbal
communication ability (Yolcu et al., 2019). Sev-
eral studies have explored the use of computer vision
techniques in analyzing human faces for clinical pur-
poses, further emphasizing its significance (Bevilac-
qua et al., 2011; Bandini et al., 2018a; Jin et al.,
2020; Gomes et al., 2023; Oliveira et al., 2023).
An important point to mention is that many types of
NDDs affect the oro-facial musculature
1
with signif-
icant impairments in speech, swallowing, and oro-
motor skills, as well as emotion expression (Bandini
et al., 2020). Therefore, analyzing a patient’s facial
expression in an image or video can be crucial for di-
agnosing ALS.
The geometry-based characteristics derived from
an individual’s face describe the shape of its compo-
nents, such as the eyes or mouth, which are essential
1
Musculature related to communication and critical to
functions such as chewing, swallowing, and breathing.
Gomes, N., Yoshida, A., Roder, M., Camargo de Oliveira, G. and Papa, J.
Facial Point Graphs for Amyotrophic Lateral Sclerosis Identification.
DOI: 10.5220/0012428400003660
Paper published under CC license (CC BY-NC-ND 4.0)
In Proceedings of the 19th International Joint Conference on Computer Vision, Imaging and Computer Graphics Theory and Applications (VISIGRAPP 2024) - Volume 3: VISAPP, pages
207-214
ISBN: 978-989-758-679-8; ISSN: 2184-4321
Proceedings Copyright © 2024 by SCITEPRESS – Science and Technology Publications, Lda.
207

for facial analysis (Wu and Ji, 2019). Based on these
landmarks, Bandini et al. (Bandini et al., 2018a) pro-
posed an approach that predicts the patient’s healthy
state based on features representing motion, asymme-
try, and face shape through video analysis. Such an
inference was accomplished using well-known ma-
chine learning techniques, i.e., Support Vector Ma-
chines (SVM) (Cortes and Vapnik, 1995) and Logis-
tic Regression (Cox, 1958). Although reasonable re-
sults have been reported, there is still the need to deal
with the limited representation power and biases as-
sociated with handcrafted features. Our work circum-
vents such a shortcoming by introducing Facial Point
Graphs (FPGs) to automatically learn motion infor-
mation from facial expressions. Our model is based
on Graph Neural Networks (GNNs) and first con-
structs a graph with the most important facial points
for ALS diagnosis to fulfill that purpose for further
training. Later, each frame is classified as positive or
negative to the disease. The majority voting then as-
signs the final label to the individual.
To the best of our knowledge, no method employs
Facial Point Graphs for ALS identification. We firmly
believe that the landmarks extracted from frames can
be better encoded in a non-Euclidean space, enabling
the precise definition and representation of their dis-
tinct features. Therefore, the main contributions of
this paper are twofold:
• To introduce Facial Point Graphs to identify ALS.
• To employ a deep learning approach to the same
context, thus not requiring handcrafted features.
The remainder of this paper is structured as fol-
lows: Sections 2 and 3 present the literature re-
view and theoretical background, respectively. Sec-
tion 4 presents an explanation regarding the employed
dataset, the used models to crop images and extract fa-
cial features, the proposed approach, and the classifi-
cation method. Finally, Section 5 presents the exper-
imental results, and Section 6 states the discussions
about the results, conclusions, and future works.
2 RELATED WORKS
Facial expression is a significant part of human
nonverbal contact, is more effective than words in
face-to-face communication (Mehrabian, 1968), and
serves as a distinctive universal means of transmis-
sion. Very often, impaired facial expressions manifest
as symptomatic indications across countless medical
conditions (Yolcu et al., 2019).
Bandini et al. (Bandini et al., 2018a) introduced
a novel approach for automatically detecting bulbar
ALS. Their method involves analyzing facial move-
ment features extracted from video recordings. The
dataset comprises ten ALS patients (six male and four
female) and eight age-matched healthy control sub-
jects (six male and two female), which were asked to
perform specific actions during recordings. Initially,
each individual was recorded at rest (REST) with a
neutral facial expression for 20 seconds. An impor-
tant point to mention is that this task was not used
for analysis but only as a reference for extracting the
geometric characteristics during the tasks.
Next, each participant was asked to perform the
following actions: open their jaw to the maximum ex-
tent, repeated five times (OPEN); lip puckering (as if
kissing a baby) a total of four times (KISS); pretend
to blow out a candle, five times (BLOW); smile with
closed lips, five times (SPREAD); repeat the syllable
/pa/ in a single breath as fast as possible (PA); repeat
the word /pataka/ as quickly as possible (PATAKA);
repeat the sentence “Buy Bobby a puppy” (BBP) ten
times in their usual tone and speaking speed.
Furthermore, the image pre-processing step
was performed using the supervised descent
method (Xiong and De la Torre, 2013), which ex-
tracts corresponding facial landmarks for eyebrows,
eyelids, and nose, as likewise outer and inner lip
contours for each frame. Also, a third coordinate
was estimated for these landmarks based on intrinsic
camera parameters. In this regard, feature extraction
was carried out considering the points in the mouth
region, as they demonstrated greater sensitivity to
ALS. Considering aspects of lip movement such as
range and speed of motion, symmetry, and shape,
two different algorithms were used for classification:
SVM and Logistic Regression. Last but not least,
the best classification result was achieved in the BBP
task, with an accuracy of 88.9%.
Xu et al. (Xu et al., 2020) conducted a study
on classifying expressions using facial landmarks.
Their approach used a Graph Convolutional Network
(GCN) (Kipf and Welling, 2016) to classify facial
expressions in images. They employed the Dlib-ml
machine learning algorithm (King, 2009) to estimate
the positions of 64 facial landmarks, which are em-
ployed to construct a graph along with their two-
dimensional coordinates. The training process in-
corporated three different databases: JAFFE (Lyons
et al., 1998), FER2013 (Goodfellow et al., 2013), and
CK+ (Lucey et al., 2010). The classes considered
in this study included Anger, Disgust, Fear, Happi-
ness, Sadness, and Surprise, achieving an accuracy of
95.85%.
VISAPP 2024 - 19th International Conference on Computer Vision Theory and Applications
208
3 THEORETICAL BACKGROUND
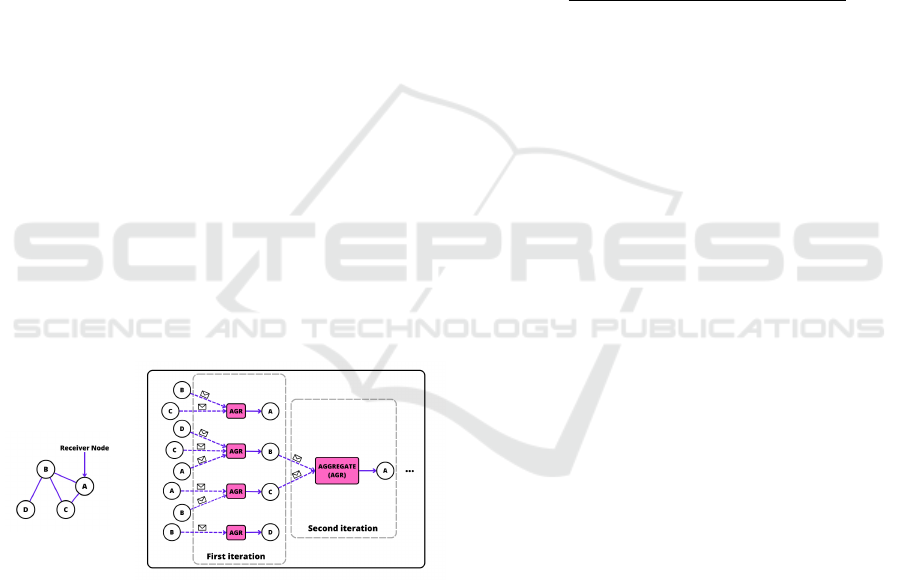
Graph Neural Networks bring the problem of learning
patterns in a dataset to the graph domain. Formally,
a graph G = (V , E) is defined as a set of nodes V
and a set of edges E between them, aka the adjacency
relation. During the iteration process, each node (re-
ceiver) receives a set of aggregated messages from its
neighbors, applying an aggregation function and an
update function. Each node forwards information to
its neighbors before its features are updated. In the
next iteration, it forwards the new information (mes-
sage) to its neighbors once more, as illustrated in Fig-
ure 1.
For each iteration k, a hidden vector h
u
(k)
∈ R
n
in-
corporates the features of node u ∈ V , where n stands
for the number of input features. It is important to
highlight that the hidden vector h
u
(0)
encodes the fea-
tures before training, i.e., at the initial stage. Firstly,
a node-order invariant function aggregates features
from the neighborhood N(u) of node u. Secondly,
the aggregated features are used to update the node
information, described as follows:
h
k+1
u
= U
k
h
k
u
, A
k
u
{h
k
v
, ∀v ∈ N(u)}
, (1)
where U
(k)
and A
(k)
stand for the updating and aggre-
gating functions, respectively. One can use distinct
models for these functions, but this paper employs
a formulation based on an attention mechanism, de-
scribed further,
(a) b
Figure 1: Aggregation of messages in a bidirectional graph:
(a) input graph and (b) an example of GNN working mech-
anism (for the sake of simplification, the second iteration
considers node ‘A’ only).
3.1 Graph Attention Networks
Graph Attention Networks (GATs) are a strategy for
improving the aggregation function. In this network,
the message gives different priorities to the informa-
tion from the neighborhood. The first application of
this concept in a model was described by Veli
ˇ
ckovi
´
c
et al. (Veli
ˇ
ckovi
´
c et al., 2017) and crafted as follows:
h
k+1
u
= σ
∑
v∈N(u)
α
k
v→u
W
k
h
k
v
!
, (2)
where W ∈ R
n
′
×n
is a trainable parameter known as
the weight matrix, n
′
and σ stand for the number of
output features and the sigmoid function, respectively.
In addition, α
v→u
∈ R indicates the attention given
from v to the node u, i.e., the degree of influence v
has on updating the features of node u. A higher value
of α
v→u
implies a stronger impact of v on the feature
update process of u. Formally, its definition is repre-
sented as follows:
α
k
v→u
=
exp
λ
[
a
k
u
]
T
[
W
k
h
k
u
∥W
k
h
k
v
]
∑
v
′
∈N(u)
exp
λ
[
a
k
u
]
T
h
W
k
h
k
u
∥W
k
h
k
v
′
i
, (3)
where a
u
∈ R
2∗n
′
defines a trainable parameter known
as the attention vector. The symbol ∥ denotes the con-
catenation operator, and λ represents the LeakyReLU
non-linearity function (with negative input slope β =
0.2).
In addition, this particular GNN has proven to be
more effective in accurately identifying the healthy
state of patients by analyzing the facial landmarks
extracted from their expressions during task perfor-
mance.
4 EXPERIMENTAL
METHODOLOGY
4.1 Dataset
Established by Bandini et al. (Bandini et al., 2020),
Toronto NeuroFace is the first public dataset with
videos of oro-facial gestures performed by individu-
als with oro-facial impairments, including post-stroke
(PS), ALS, and healthy control (HC). The dataset con-
sists of 261 colored (RGB) videos featuring thirty-six
participants: 11 patients with ALS, 14 patients with
PS, and 11 HC. This work emphasizes the distinction
between ALS and healthy individuals, as the primary
interest lies in the former. Consequently, emphasis
was placed on a subset that exclusively included ALS
and HC groups. Each video captures a participant per-
forming one of the subtasks from a set of speech and
non-speech tasks commonly used during the clinical
oro-facial examination. Following the manual seg-
mentation of the videos, the dataset was partitioned
into 921 videos of repetitions. Table 1 presents the
distribution of the number of repetitions for each sub-
task used in the experiments.
Facial Point Graphs for Amyotrophic Lateral Sclerosis Identification
209
Table 1: Number of repetitions for each subtask.
Subtask Description ALS HC
SPREAD Pretending
to smile with tight lips
55 59
KISS Pretend
to kiss a baby
59 57
OPEN Maximum
opening of the jaw
54 55
BLO
W
Pretend
to blow a candle
31 39
BBP
Repetitions
of the sentence
“Buy Bobby a Puppy”
95 111
P
A
Repetitions
of the syllables /pa/
as fast as possible in a single breath
100 110
P
ATAKA
Repetitions of the syllables /pataka/
as fast as possible in a single breath
88 108
4.2 Pre-Processing
To eliminate visual elements outside the subject’s face
and ensure consistency in the dataset, OpenFace 2.0
tool (Baltrusaitis et al., 2018) is employed during the
preprocessing stage. This tool first detects the main
face, then performs a transformation based on head
pose estimation and a crop operation on all frames.
The resulting output ends up in 200 × 200 grayscale
images centered on the facial region, as illustrated in
Figure 2.
Figure 2: Illustration of OpenFace 2.0 for: (i) main face
detection, (ii) transformation based on head pose estima-
tion, and (iii) face cropping on an image from the Flickr30k
dataset (Young et al., 2014).
4.3 Feature Extraction
In this work, the Facial Alignment Network
(FAN) (Bulat and Tzimiropoulos, 2017), a deep learn-
ing model, was utilized to identify the frame-by-
frame face geometric structure of each video in the
dataset. As a state-of-the-art approach, FAN employs
heatmap regression to accurately detect facial land-
mark points following the MULTI-PIE 2D 68-point
format (Gross et al., 2010), enabling alignment in
two and three dimensions. Since the dataset contains
videos recorded with the frontal face position, align-
ment was considered in two dimensions only.
Previous studies show that patients with ALS ex-
hibit significant sensitivity in lip and jaw movements
(Langmore and Lehman, 1994; Bandini et al., 2018b).
Therefore, 26 points were selected from the land-
marks extracted by FAN, representing the relevant
regions (Figure 3a). To establish connections be-
tween these landmark nodes, the Delaunay triangula-
tion (Delaunay et al., 1934) was employed, involving
the creation of a triangular mesh by connecting the
specific landmarks (Figure 3b).
To enhance information communication among
graph nodes during the learning process, a strategic
choice is made to use point 31 (according to the 68-
point format) (Gross et al., 2010), corresponding to
the nose tip, as a central node. This key node serves
as a hub, connecting all other nodes independently
of the Delaunay triangulation calculation (Figure 3c).
Lastly, as the final step of the feature extraction pro-
cess, the edge’s weight is set as the Euclidean distance
between its corresponding nodes.
Figure 3: Representation of the feature extraction process.
4.4 Classification and Evaluation
The classification performance was evaluated using
a leave-one-subject-out cross-validation (LOSO-CV)
approach, following the method proposed by Bandini
et al. (Bandini et al., 2018a). Furthermore, to en-
hance the reliability of predictions in real-world sce-
narios and mitigate issues like overfitting or memoriz-
ing training data, separate sets for training, validation,
and testing are employed in each interaction. Regard-
ing the validation sets, two subjects are randomly se-
lected, one categorized as HC and the other as ALS,
ensuring a balanced representation of both classes in
this stage.
The evaluation was conducted in two modes, i.e.,
repetition- and subject-based classification:
4.4.1 Repetition Classification
For each iteration of the LOSO-CV, the repetitions
produced by one participant were treated as individual
samples in the test set. At the same time, the remain-
ing data was split into validation and training sets.
This approach ensures that every participant, both HC
and those with ALS, and their respective repetitions
were considered in separate test sets. During this
VISAPP 2024 - 19th International Conference on Computer Vision Theory and Applications
210
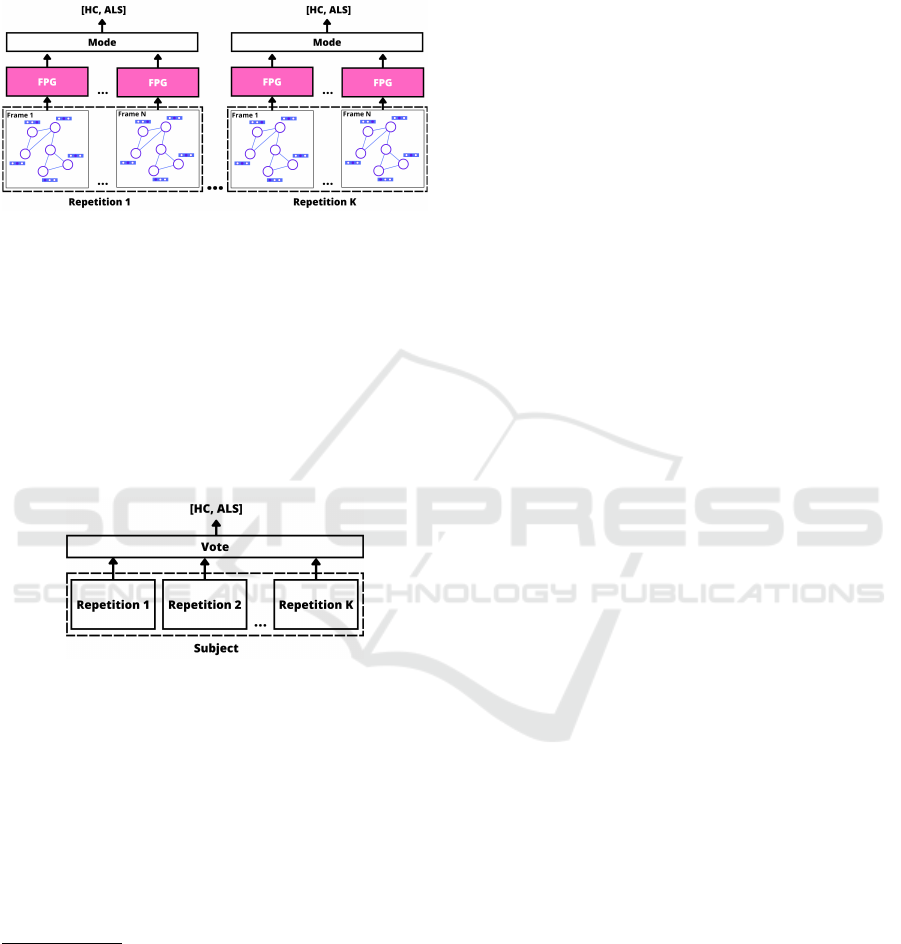
trial, individuals’ speech and non-speech repetitions
were classified as belonging to the HC or ALS group.
Figure 4 illustrates the process mentioned above for a
given individual
2
.
Figure 4: Overview of the repetition-based evaluation step.
4.4.2 Subject Classification
At each iteration of the LOSO-CV, each subject was
treated as a test case and classified as either HC or
ALS. The classification was determined through a
majority vote among its predicted repetitions; in tie
cases, the subject was considered HC to generate a
more conservative prediction according to Bandini
et al. (Bandini et al., 2018a). Figure 5 depicts an
overview of the subject classification process.
Figure 5: Overview of the subject-based evaluation step.
In both repetition- and subject-based classifica-
tion, the validation set was used to prevent bias in the
model’s hyperparameters and to facilitate the imple-
mentation of the early stopping technique. The num-
ber of epochs for training was determined by moni-
toring the learning progress on the validation set
3
.
Considering Bandini et al. (Bandini et al., 2018a)
as the benchmark to our work, the experiments were
also performed considering two other classification
models for comparison purposes: SVM with linear
2
This experiment involves tallying the instances of hits
and misses for each repetition (per individual) to construct
the ultimate classification accuracy. Essentially, the label-
ing is applied to repetitions rather than individuals.
3
The maximum number of epochs is set to 100, the
batch-size comprises 64 samples, the learning rates are set
to 10
−4
and 10
−5
considering the GAT and linear layers,
respectively. The number of hidden layers was set to 17.
These values were empirically chosen based on the results
over the validation set.
and radial basis function (RBF) and Logistic Regres-
sion. Both models use 11 geometric and kinematic
features extracted from speech and non-speech tasks.
A grid search was used to find proper values for SVM
parameters, i.e., the confidence value C and the RBF
kernel scale parameter γ.
4.5 Proposed Model
Initially, the proposed model uses fifteen frames for
each repetition performed by the patient. Although
the entire video of each repetition contains approxi-
mately thirty frames, the model showed better results
using just half of them at equally spaced intervals.
FPG receives a graph of twenty-six nodes represent-
ing the face landmarks, where each node encodes a
feature vector with the x and y coordinates of its re-
lated landmark. In addition, each graph edge stores its
length determined by the Euclidean distance between
its two corresponding nodes.
Further, each frame proceeds through six GAT and
two linear layers. Before the information is forwarded
to the linear layers, an average pooling is performed
using the nodes, i.e., all information encoded in the
graph is mapped into a single vector. Figure 6 illus-
trates such a process.
The result obtained after pooling goes through
two linear layers, which generate the model’s out-
put. Nonetheless, the error is calculated based on the
frame label, and the mode among frames represents
the outcomes concerning the repetition experiment.
In other words, classifying an individual’s repetition
is based on the majority consensus among the frames.
Likewise, when classifying the subject, the majority
mode derived from the classifications of each repeti-
tion determines whether the patient has ALS or not.
5 RESULTS
The experimental results were obtained for each sub-
task separately. For a thorough assessment of the pro-
posed approach, three evaluation measures were con-
sidered: accuracy, sensitivity, and specificity. Table 2
presents the results for each subtask accordingly.
According to previous studies, the SPREAD sub-
task also appears to be the most discriminative one,
with an accuracy of 80.7% during repetition-based
classification and 81.8% concerning the subject-based
classification in our model approach. As described
in Section 4, the experiments were conducted by first
splitting the dataset into training and test folds. The
former was partitioned into a smaller training set to
generate a validation fold, whose size was limited to
Facial Point Graphs for Amyotrophic Lateral Sclerosis Identification
211
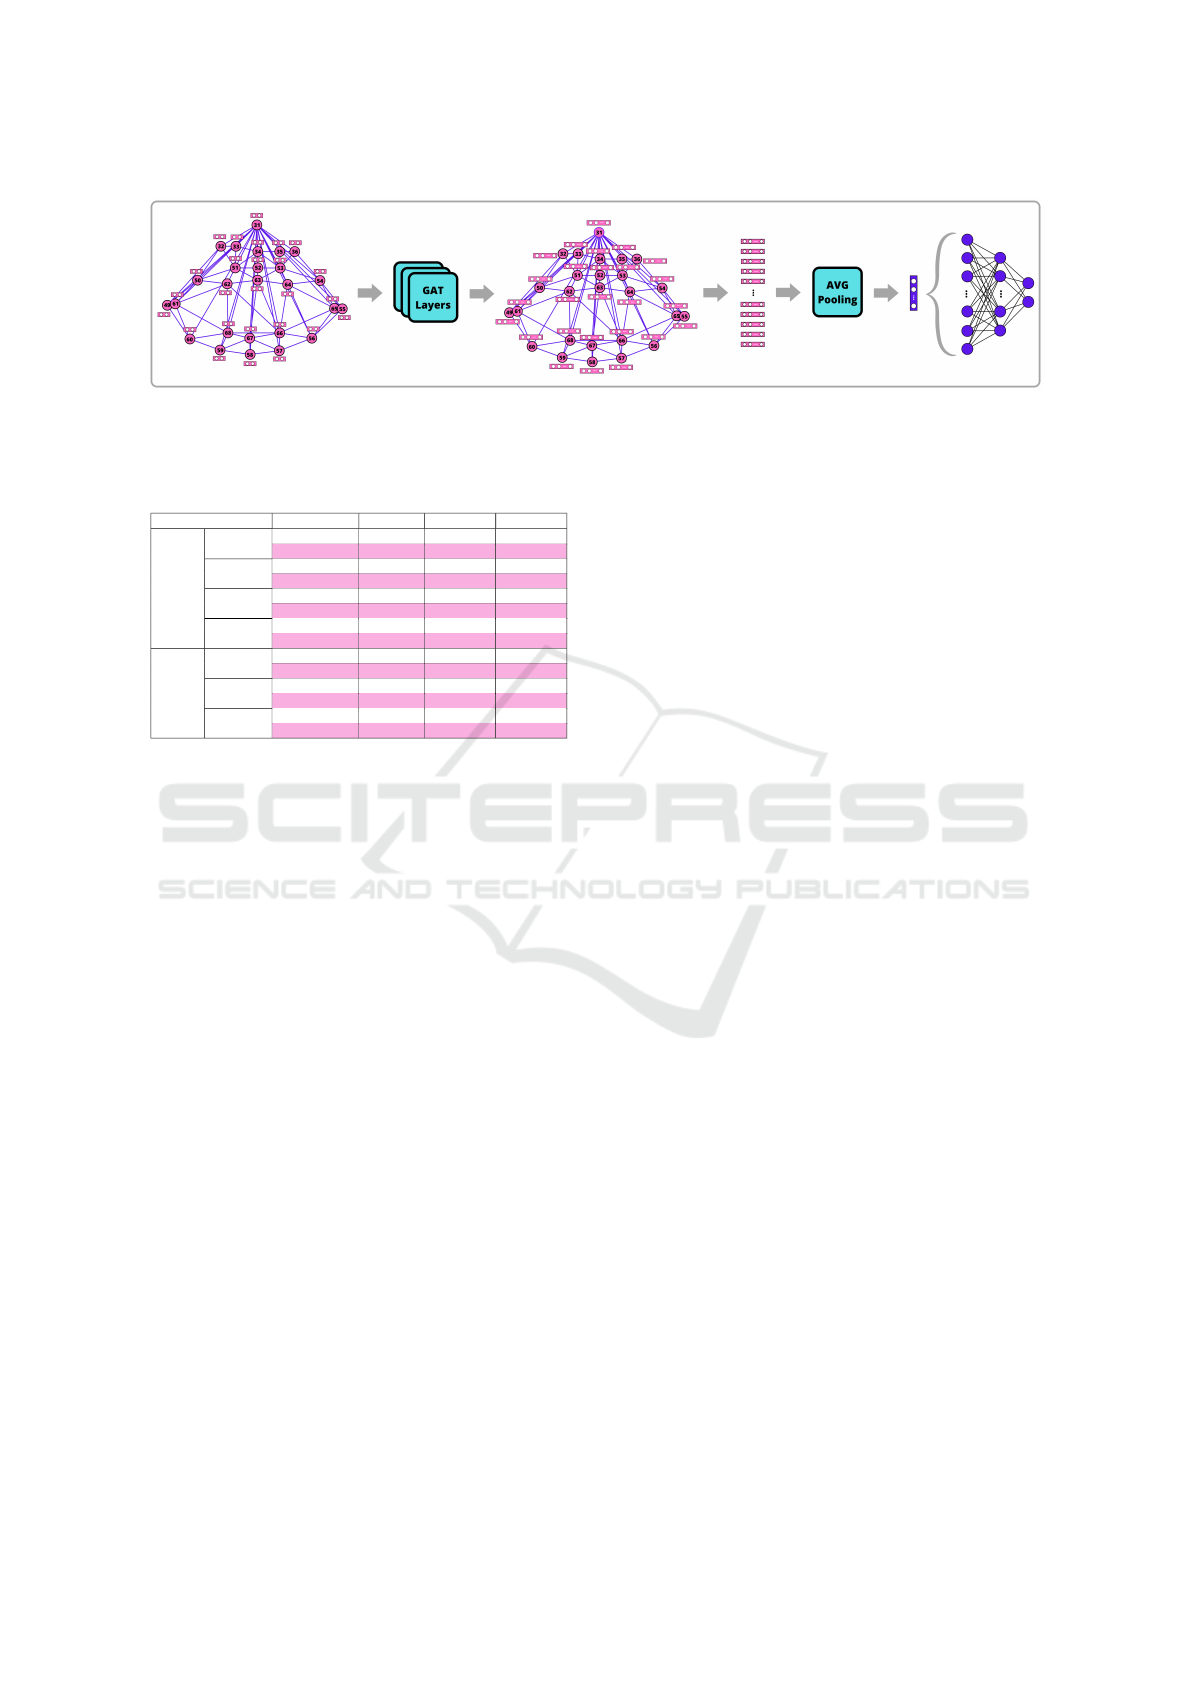
Figure 6: FPG model.
Table 2: FPG results for each subtask in speech and non-
speech data.
TASK Classification Accuracy Specificity Sensitivity
Repetition 80,7% 79,6% 81,8%
SPREAD
Subject 81,8% 81,8% 81,8%
Repetition 68,1% 80,7% 55,9%
KISS
Subject 68,1% 81,8% 54,5%
Repetition 77,0% 78,1% 75,9%
OPEN
Subject 81,8% 81,8% 81,8%
Repetition 37,1% 51,2% 19,3%
Non-
speech
BLOW
Subject 38,4% 57,1% 16,6%
Repetition 49,0% 63,0% 32,6%
BBP
Subject 50,0% 63,6% 33,3%
Repetition 64,2% 64,5% 64,0%
PA
Subject 57,1% 54,5% 60,0%
Repetition 67,3% 65,7% 69,3%
Speech
PATAKA
Subject 66,6% 63,6% 70,0%
the data available for training.
An important point to anticipate is that the re-
sults obtained using SVM and Logistic Regression
may differ significantly from the findings presented
by Bandini et al. (Bandini et al., 2018a), for they
employed a slightly different approach. Although
Toronto Neuroface contains the same speech and non-
speech tasks as those in the study conducted by Ban-
dini et al. (Bandini et al., 2018a), our approach has
several differences. Initially, the participants in the
accessible dataset varied both in identity and quan-
tity. Videos with repetitions were manually cropped
to streamline the content since only the complete
video, including all repetitions, was provided. Unfor-
tunately, access to videos featuring samples from the
REST subtask, essential for normalization in SVM
and Regression models, was not granted. Further-
more, our videos only included color information and
did not incorporate three-dimensional depth features.
Figure 7 compares FPG against the baselines in-
spired in Bandini et al. (Bandini et al., 2018a) work.
One can observe that our model consistently outper-
forms others in the majority of tasks, e.g., SPREAD,
KISS, PA, and PATAKA. However, SVM-RBF stands
out as the top-performing model in the BLOW sub-
task. However, SVM-RBF stands out as the top-
performing model in the BLOW subtask, which was
the most challenging, as also observed by Bandini et
al. (Bandini et al., 2018a).
6 DISCUSSIONS AND
CONCLUSIONS
To the best of our knowledge, the current study is
the first to evaluate Graph Neural Networks for ALS
identification based on facial expression. As the main
finding, state-of-the-art results were demonstrated in
all subtasks of the Toronto Neuroface dataset except
for one.
The two highest accuracies are observed in
SPREAD and OPEN subtasks, achieving results
above 80%. Similar values for specificity and sensi-
tivity are observable in both subtasks, demonstrating
the model’s robustness in distinguishing ALS patients
from healthy ones.
The high accuracy in the SPREAD task is at-
tributed to the pure lip movement, not involving the
jaw muscles (Bandini et al., 2018a), allowing the de-
tection of the loss of lip muscle extension exhibited by
bulbar ALS patients. Additionally, as shown in pre-
vious studies, the jaw muscles decline in bulbar ALS
patients (Bandini et al., 2018a). Consequently, the ex-
tension of this movement was distinguished with high
accuracy by the model during the OPEN task. OPEN
considers the greatest extent of jaw muscle movement
among all other tasks, justifying the model’s accuracy.
The exchange of information among the graph
nodes during the learning iterations allowed for bet-
ter differentiation of facial points between individuals
with ALS or HC. It is also noteworthy that, except for
PA and PATAKA tasks, the model showed inferior or
equal results in repetition classification compared to
subject-base classification, indicating that most rep-
etitions were correctly classified, as the mode of la-
beled repetitions ended in the correct classification of
the subject.
One of the major limitations and challenges in
training deep learning models is the limited number of
videos available in the dataset. Deep models typically
require a substantial amount of data to learn effec-
tively. However, FPG showcased exceptional perfor-
mance despite being a deep approach. Remarkably,
VISAPP 2024 - 19th International Conference on Computer Vision Theory and Applications
212
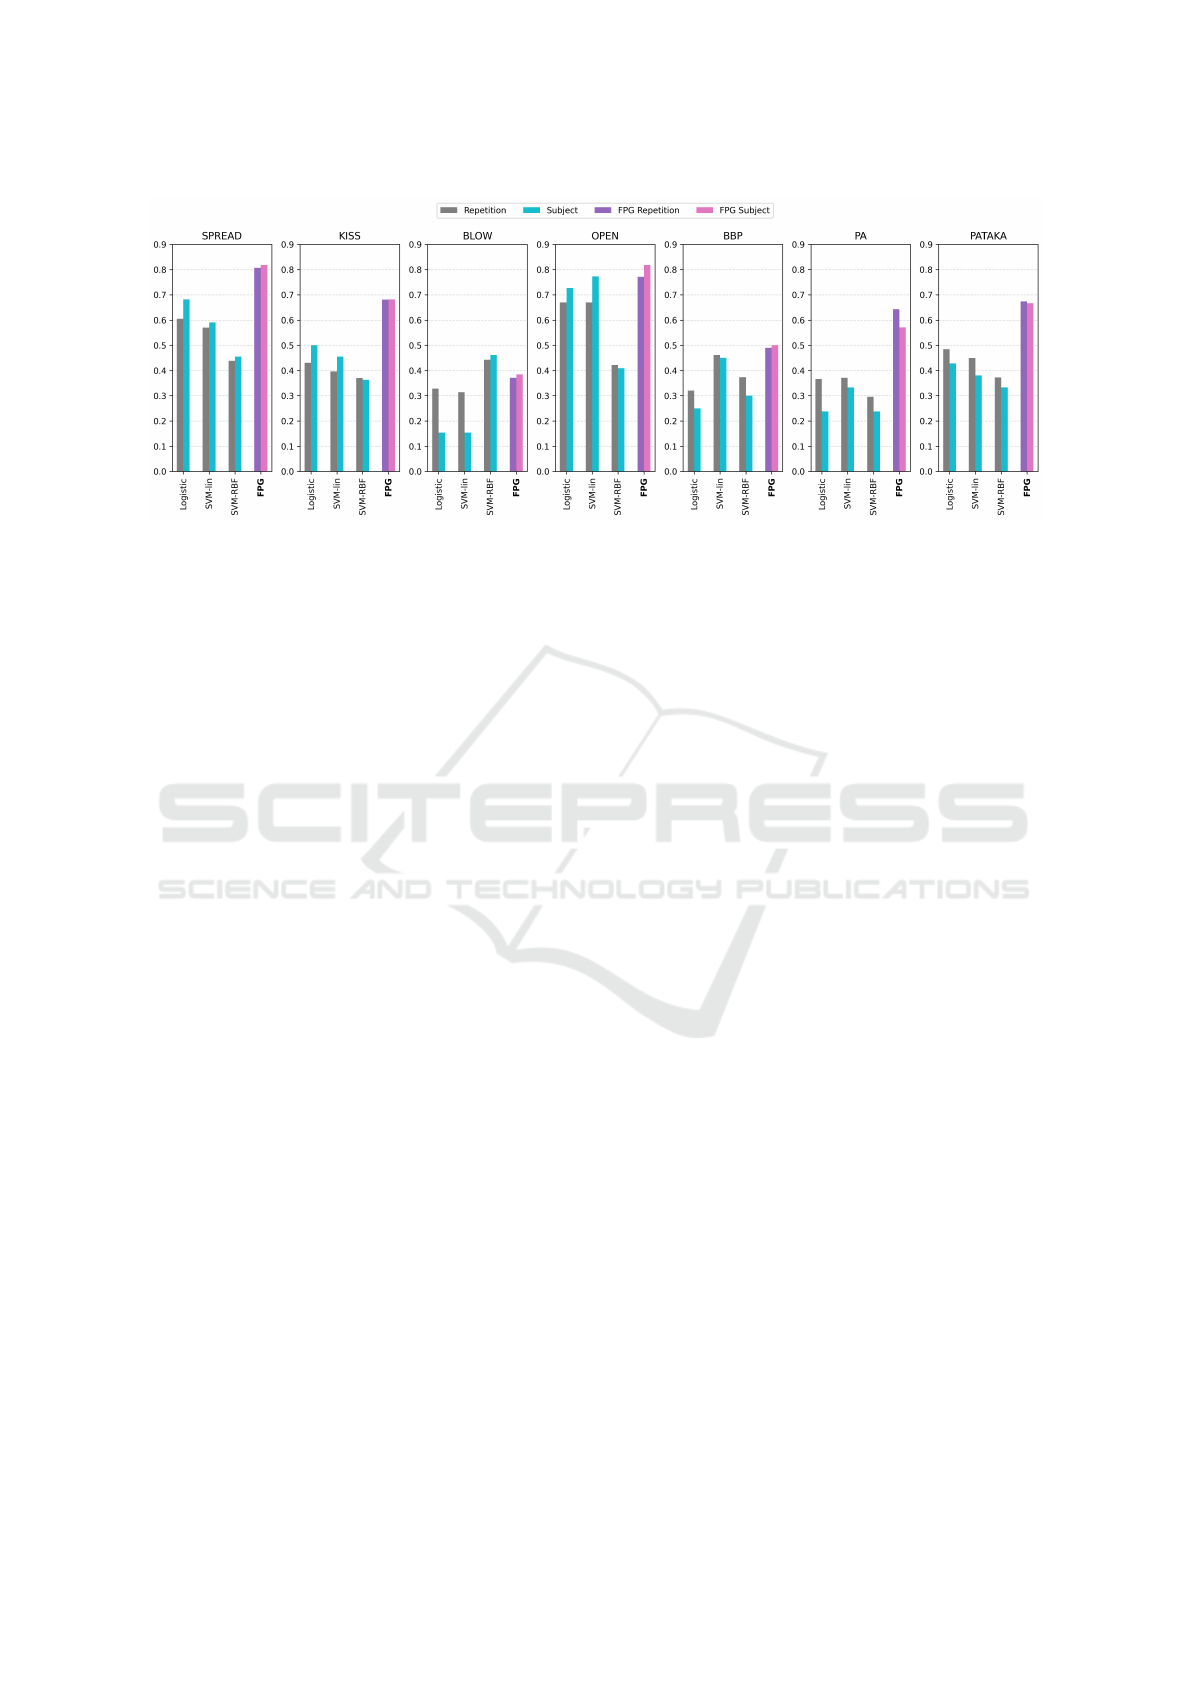
Figure 7: Comparison between FPG and baselines.
it achieved high accuracy without data augmentation
during training.
Such outcomes highlight the effectiveness of
GNN models, showcasing their inherent structural
characteristics and information propagation capabil-
ities. GNNs demonstrate their ability to capture com-
plex patterns and relationships within the data, even
when dealing with a limited dataset, underscoring
GNNs as a powerful approach in this particular do-
main.
This study did not consider the order of repeti-
tions. Therefore, exploring temporal information in
the Facial Point Graph as a future work would be in-
teresting, particularly the changes observed in facial
movements in the presence of neurodegenerative dis-
eases. Further investigation into the impact of fatigue
found in ALS patients during speech tasks such as
’PA’ and ’PATAKA’ will be conducted, with the po-
tential aim of improving the model’s performance in
capturing these variations.
The problem addressed by this work has high
complexity due to the heterogeneity and the dataset’s
limited size. Besides that, the proposed approach
achieved significant results when compared to sim-
ilar works, introducing the Facial Point Graph for
ALS diagnosis. In addition, the results were achieved
without handcrafted features and with a lightweight
model, enabling the development of affordable sys-
tems capable of supporting clinicians in automatic
ALS diagnosis.
ACKNOWLEDGMENT
The research in this paper uses the Toronto Neuro-
Face Dataset collected by Dr. Yana Yunusova and
the Vocal Tract Visualization and Bulbar Function
Lab teams at UHN-Toronto Rehabilitation Institute
and Sunnybrook Research Institute respectively, fi-
nancially supported by the Michael J. Fox Founda-
tion, NIH-NIDCD, Natural Sciences and Engineer-
ing Research Council, Heart and Stroke Foundation
Canadian Partnership for Stroke Recovery and AGE-
WELL NCE.
The authors would like to thank FAPESP
(Fundac¸
˜
ao de Amparo
`
a Pesquisa do Estado de
S
˜
ao Paulo), process number #2022/13156-8 and
#2022/16090-8.
REFERENCES
Arthur, K. C., Calvo, A., Price, T. R., Geiger, J. T., Chio, A.,
and Traynor, B. J. (2016). Projected increase in amy-
otrophic lateral sclerosis from 2015 to 2040. Nature
communications, 7(1):12408.
Baltrusaitis, T., Zadeh, A., Lim, Y. C., and Morency, L.-
P. (2018). Openface 2.0: Facial behavior analysis
toolkit. In 2018 13th IEEE international conference
on automatic face & gesture recognition (FG 2018),
pages 59–66. IEEE.
Bandini, A., Green, J. R., Taati, B., Orlandi, S., Zinman,
L., and Yunusova, Y. (2018a). Automatic detection of
amyotrophic lateral sclerosis (als) from video-based
analysis of facial movements: speech and non-speech
tasks. In 2018 13th IEEE International Conference
on Automatic Face & Gesture Recognition (FG 2018),
pages 150–157. IEEE.
Bandini, A., Green, J. R., Wang, J., Campbell, T. F., Zin-
man, L., and Yunusova, Y. (2018b). Kinematic fea-
tures of jaw and lips distinguish symptomatic from
presymptomatic stages of bulbar decline in amy-
otrophic lateral sclerosis. Journal of Speech, Lan-
guage, and Hearing Research, 61(5):1118–1129.
Bandini, A., Rezaei, S., Guarin, D. L., Kulkarni, M., Lim,
D., Boulos, M. I., Zinman, L., Yunusova, Y., and Taati,
B. (2020). A new dataset for facial motion analysis
Facial Point Graphs for Amyotrophic Lateral Sclerosis Identification
213

in individuals with neurological disorders. IEEE jour-
nal of biomedical and health informatics, 25(4):1111–
1119.
Bevilacqua, V., D’Ambruoso, D., Mandolino, G., and
Suma, M. (2011). A new tool to support diagnosis of
neurological disorders by means of facial expressions.
In 2011 IEEE International Symposium on Medical
Measurements and Applications, pages 544–549.
Brooks, B. R., Miller, R. G., Swash, M., Munsat, T. L.,
of Neurology Research Group on Motor Neuron Dis-
eases, W. F., et al. (2000). El escorial revisited: revised
criteria for the diagnosis of amyotrophic lateral scle-
rosis. Amyotrophic lateral sclerosis and other motor
neuron disorders, 1(5):293–299.
Bulat, A. and Tzimiropoulos, G. (2017). How far are we
from solving the 2d & 3d face alignment problem?
(and a dataset of 230,000 3d facial landmarks). In
International Conference on Computer Vision.
Checkoway, H., Lundin, J. I., and Kelada, S. N. (2011).
Neurodegenerative diseases. IARC scientific publica-
tions, (163):407–419.
Cortes, C. and Vapnik, V. (1995). Support-vector networks.
Machine Learning, 20:273–297.
Cox, D. R. (1958). The regression analysis of binary se-
quences. Journal of the Royal Statistical Society: Se-
ries B (Methodological), 20(2):215–232.
Delaunay, B. et al. (1934). Sur la sphere vide. Izv. Akad.
Nauk SSSR, Otdelenie Matematicheskii i Estestven-
nyka Nauk, 7(793-800):1–2.
Gomes, N. B., Yoshida, A., de Oliveira, G. C., Roder, M.,
and Papa, J. P. (2023). Facial point graphs for stroke
identification. In Iberoamerican Congress on Pattern
Recognition, pages 685–699. Springer.
Goodfellow, I. J., Erhan, D., Carrier, P. L., Courville, A.,
Mirza, M., Hamner, B., Cukierski, W., Tang, Y.,
Thaler, D., Lee, D.-H., et al. (2013). Challenges in
representation learning: A report on three machine
learning contests. In Neural Information Processing:
20th International Conference, ICONIP 2013, Daegu,
Korea, November 3-7, 2013. Proceedings, Part III 20,
pages 117–124. Springer.
Gross, R., Matthews, I., Cohn, J., Kanade, T., and Baker,
S. (2010). Multi-pie. Image and vision computing,
28(5):807–813.
Jin, B., Qu, Y., Zhang, L., and Gao, Z. (2020). Diagnosing
parkinson disease through facial expression recogni-
tion: video analysis. Journal of medical Internet re-
search, 22(7):e18697.
King, D. E. (2009). Dlib-ml: A machine learning toolkit.
The Journal of Machine Learning Research, 10:1755–
1758.
Kipf, T. N. and Welling, M. (2016). Semi-supervised clas-
sification with graph convolutional networks. arXiv
preprint arXiv:1609.02907.
Langmore, S. E. and Lehman, M. E. (1994). Physiologic
deficits in the orofacial system underlying dysarthria
in amyotrophic lateral sclerosis. Journal of Speech,
Language, and Hearing Research, 37(1):28–37.
Lucey, P., Cohn, J. F., Kanade, T., Saragih, J., Ambadar,
Z., and Matthews, I. (2010). The extended cohn-
kanade dataset (ck+): A complete dataset for action
unit and emotion-specified expression. In 2010 ieee
computer society conference on computer vision and
pattern recognition-workshops, pages 94–101. IEEE.
Lyons, M., Akamatsu, S., Kamachi, M., and Gyoba,
J. (1998). Coding facial expressions with gabor
wavelets. In Proceedings Third IEEE international
conference on automatic face and gesture recognition,
pages 200–205. IEEE.
Mehrabian, A. (1968). Some referents and measures of non-
verbal behavior. Behavior Research Methods & In-
strumentation, 1(6):203–207.
Oliveira, G. C., Ngo, Q. C., Passos, L. A., Papa, J. P.,
Jodas, D. S., and Kumar, D. (2023). Tabular data
augmentation for video-based detection of hypomimia
in parkinson’s disease. Computer Methods and Pro-
grams in Biomedicine, 240:107713.
Veli
ˇ
ckovi
´
c, P., Cucurull, G., Casanova, A., Romero, A., Lio,
P., and Bengio, Y. (2017). Graph attention networks.
arXiv preprint arXiv:1710.10903.
Wu, Y. and Ji, Q. (2019). Facial landmark detection: A
literature survey. International Journal of Computer
Vision, 127:115–142.
Xiong, X. and De la Torre, F. (2013). Supervised descent
method and its applications to face alignment. In Pro-
ceedings of the IEEE conference on computer vision
and pattern recognition, pages 532–539.
Xu, R.-S. and Yuan, M. (2021). Considerations on the con-
cept, definition, and diagnosis of amyotrophic lateral
sclerosis. Neural Regeneration Research, 16(9):1723.
Xu, X., Ruan, Z., and Yang, L. (2020). Facial expression
recognition based on graph neural network. In 2020
IEEE 5th International Conference on Image, Vision
and Computing (ICIVC), pages 211–214. IEEE.
Yolcu, G., Oztel, I., Kazan, S., Oz, C., Palaniappan, K.,
Lever, T. E., and Bunyak, F. (2019). Facial expres-
sion recognition for monitoring neurological disorders
based on convolutional neural network. Multimedia
Tools and Applications, 78:31581–31603.
Young, P., Lai, A., Hodosh, M., and Hockenmaier, J.
(2014). From image descriptions to visual denota-
tions: New similarity metrics for semantic inference
over event descriptions. Transactions of the Associa-
tion for Computational Linguistics, 2:67–78.
VISAPP 2024 - 19th International Conference on Computer Vision Theory and Applications
214
