
Towards Using Synthetic User Interaction Data in Digital Healthcare
Usability Evaluation
Bilal Maqbool
a
, Laoa Jalal and Sebastian Herold
b
Department of Mathematics and Computer Science, Faculty of Health, Science and Technology, Karlstad University,
Karlstad, Sweden
Keywords:
Time Series Data, Generative Adversarial Networks (GAN), Synthetic Data Generation, Usability Evaluation,
Machine Learning (ML), Digital Healthcare (DH).
Abstract:
Effective usability evaluation of user interface (UI) designs is essential. Particularly in digital healthcare,
frequently involving relevant user groups in usability evaluations is not always possible or is ethically ques-
tionable. On the other hand, neglecting the perspectives of such groups can lead to UI designs that fail to
be inclusive and adaptable. In this paper, we outline an initial idea to utilize artificial intelligence methods to
simulate mobile user interface interactions of such user groups. The goal is to support software developers and
designers with tools that show them how users of certain user groups might interact with a user interface under
development and show potential issues before actual, more expensive usability evaluations are conducted. We
present a study that employs synthetic representations of user interactions with UI elements based on a small
sample of real interactions. This synthetic data was then used to train a classification model predicting whether
real user interactions were from younger or elderly persons. The good performance of this model provides
evidence that synthetic user interface interactions might be accurate enough to feed into imitation learning
approaches, which, in turn, could be the foundation for the desired tool support.
1 INTRODUCTION
Software systems, increasingly integral to daily activ-
ities, are set to become more interconnected as tech-
nology advances (Serrano, 2018). By 2023, smart-
phone usage is expected to surge by 79% compared to
a decade earlier, indicating a growing reliance on dig-
ital systems (Statista, 2023). This rise emphasizes the
need for intuitive interfaces catering to diverse user
experiences (Alghamdi et al., 2022). However, cur-
rent design guidelines often struggle to meet the vary-
ing needs of different user demographics, particularly
in terms of unique interactive gestures and accessibil-
ity requirements (Ahmad Faudzi et al., 2023; Zhang
and Adipat, 2005).
Usability evaluation plays a crucial role in ad-
dressing these design challenges (Zhang and Adipat,
2005), especially in digital health products, where
it can significantly affect patient care by simpli-
fying tasks, reducing errors, and improving treat-
ments (Cresswell et al., 2013; Khajouei et al., 2009).
Conducting such evaluations, particularly with spe-
a
https://orcid.org/0000-0002-1309-2413
b
https://orcid.org/0000-0002-3180-9182
cific groups like the elderly or those with certain
medical conditions, faces practical and ethical hur-
dles (Maqbool and Herold, 2024), leading to a lack
of UI interaction data from these demographics. This
scarcity creates a gap in our understanding of user-
software interaction and usage patterns and impacts
the development of inclusive and accessible software
solutions.
We see a potential solution in machine learn-
ing (ML) and synthetic data generation tech-
niques (Dahmen and Cook, 2019). These tech-
niques can infer and augment limited user interac-
tion datasets, offering a richer, more diverse dataset
that mirrors actual user behaviours (see more in Sec-
tion 2). Studies like (Kobayashi et al., 2011) and (Tsai
et al., 2017) have analysed the UI interactions across
diverse user groups, including the elderly, to un-
derstand their effectiveness and challenges in touch-
screen interactions. However, a gap exists in the lit-
erature regarding the augmentation of mobile interac-
tion data for potential UI usability evaluations.
The study aims to evaluate a Synthesis Data Gen-
erator (SDG) using the Generative Adversarial Net-
work (GAN) framework for creating drag-and-drop
Maqbool, B., Jalal, L. and Herold, S.
Towards Using Synthetic User Interaction Data in Digital Healthcare Usability Evaluation.
DOI: 10.5220/0012427600003657
Paper published under CC license (CC BY-NC-ND 4.0)
In Proceedings of the 17th International Joint Conference on Biomedical Engineering Systems and Technologies (BIOSTEC 2024) - Volume 2, pages 595-603
ISBN: 978-989-758-688-0; ISSN: 2184-4305
Proceedings Copyright © 2024 by SCITEPRESS – Science and Technology Publications, Lda.
595
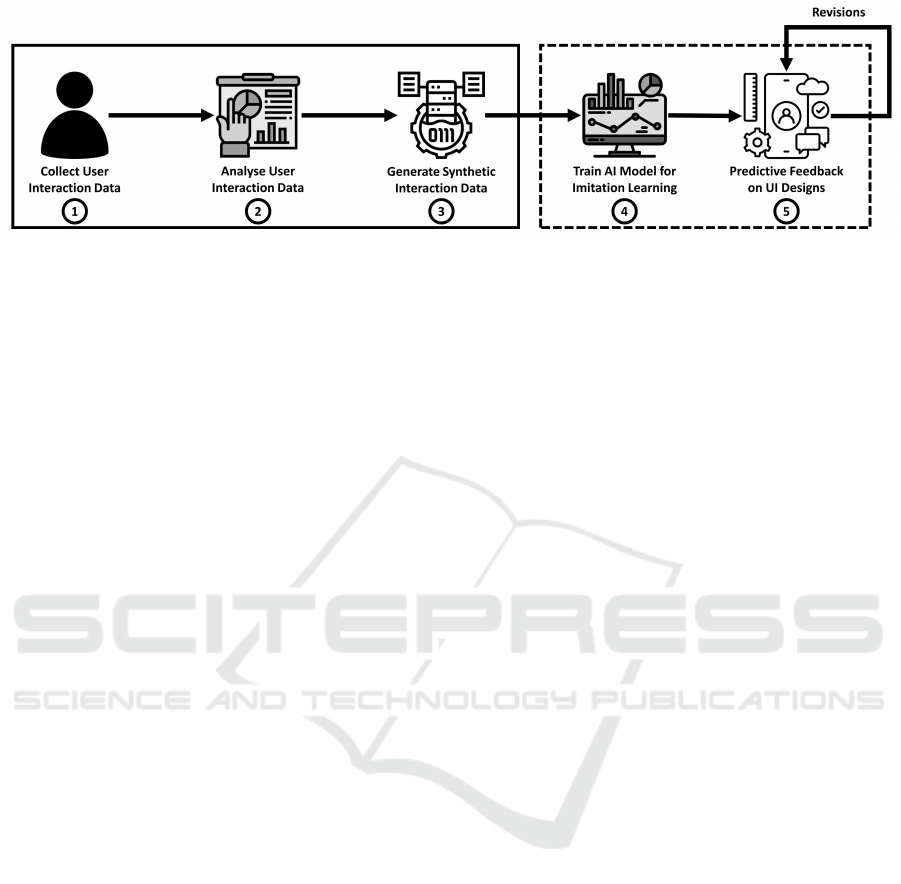
Figure 1: Overview of proposed framework: Usability evaluation using AI.
UI interaction data. We collect and augment interac-
tion data from young and elderly users to assess qual-
ity and usability for mobile UI evaluations, guided by
two primary research questions.
• RQ1: How accurately does synthetically gener-
ated UI interaction data simulate and classify real
user interactions across diverse user groups?
• RQ2: What are the implications and opportunities
for utilizing synthetically generated UI interaction
data in mobile UI usability evaluations for digital
healthcare?
The study further aims to motivate further re-
search in this area to explore more complex settings
with multiple UI interactions.
2 OVERVIEW OF PROPOSED
FRAMEWORK
Figure 1 outlines our predictive usability paradigm,
from data collection to tool support. This paper fo-
cuses on the first three phases, with further explo-
ration planned for future research.
Data-driven foundation: Our methodology starts
by collecting real UI interaction data from various
user groups, focusing on capturing essential inter-
action patterns across age demographics to form a
foundational dataset for synthesis. After data collec-
tion, the phase examines this data to identify key be-
haviours which guide the creation of synthetic data,
ensuring it accurately reflects real user interactions
and underpins the reliability of further development.
Synthetic data generation: Recognising the con-
straints in the size of the primary data collected, we
augment our dataset by generating synthetic user UI
interactions. The generation is facilitated by ma-
chine learning techniques specifically developed to
infer and augment additional user behaviours. The
synthetic dataset thus created allows us to model a
broader spectrum of interactions.
Imitation learning and tool support: The repre-
sentative synthetic datasets will be fed into the next
phase: training an AI model through imitation learn-
ing techniques. This model will help to determine and
simulate how a specific user group interacts with a
given UI. The final phase envisions tool support op-
erationalising our methodology into a practical appli-
cation. Using our AI model, this tool will provide
data-driven predictive feedback on UI designs, thus
enabling developers and designers to optimize inter-
faces for usability and accessibility efficiently. By in-
tegrating this tool into the UI design process–either
through direct input of design elements or as an em-
bedded plugin within existing design environments–
developers and designers gain access to a try-and-fix
mechanism that predicts UI design issues.
In summary, this paper establishes a methodolog-
ical foundation for future work in synthetic data and
imitation learning for usability evaluation. The even-
tual goal is to build a robust, AI-powered framework
that can simulate and predict user interactions across
various demographics, with particular sensitivity to
the patterns and limitations of the senior population.
This framework aims to enhance the usability of mo-
bile interfaces, steering the efficient design process to-
wards creating more inclusive digital healthcare envi-
ronments.
3 METHODOLOGY
3.1 Data Collection
Figure 2 shows three main stages of the experiment.
In stage 1, we used a custom-designed Android ap-
plication to collect data, capturing details about par-
ticipants and their interactions during drag-and-drop
tasks. Initially, participants fill out a questionnaire
about their age group, dominant hand when using a
smartphone, and if they use fingers or thumb to inter-
act with smartphone UI. We analysed this interaction
HEALTHINF 2024 - 17th International Conference on Health Informatics
596
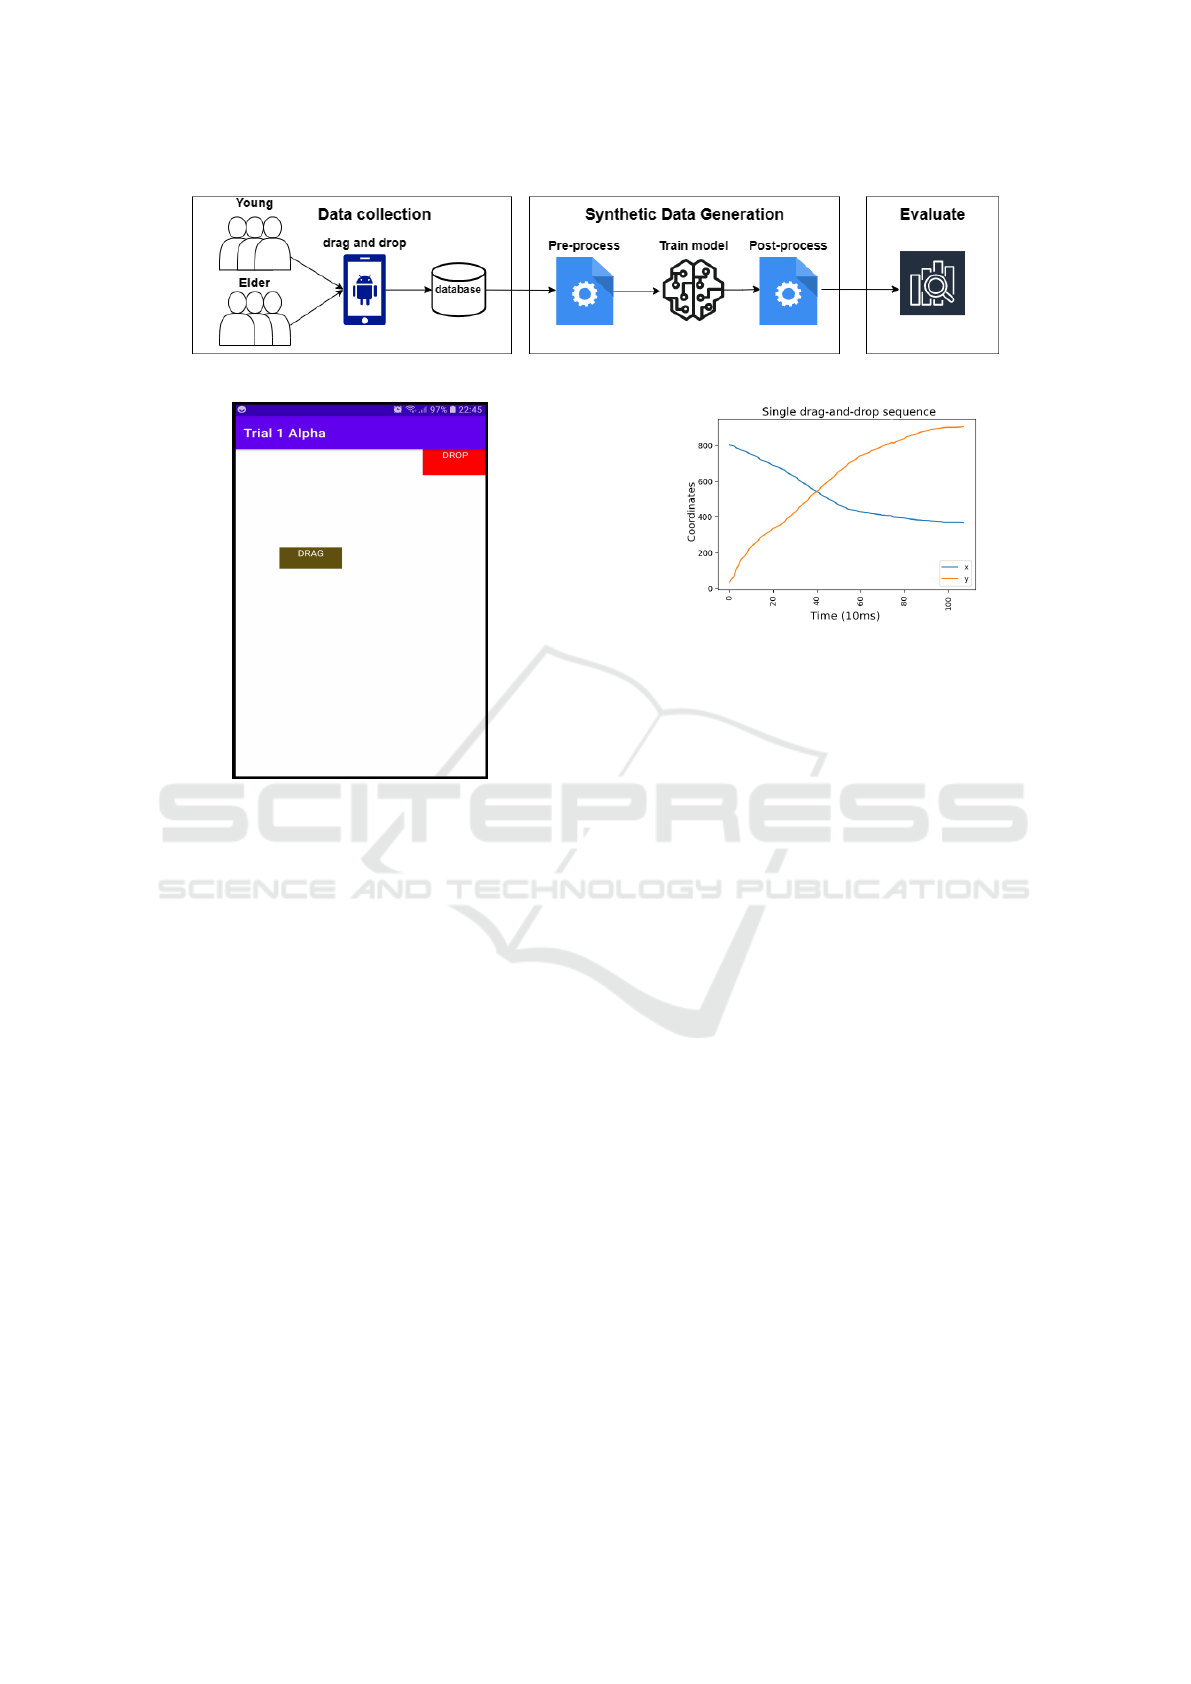
Figure 2: Overview of experimental stages.
Figure 3: Moving square to the specified drop location.
data to identify patterns, enabling us to differentiate
behaviours among participants across younger and el-
derly users.
Participants engaged in tasks where they move
a square (button) labelled ‘DRAG’ to a ‘DROP’ lo-
cation, as illustrated in Figure 3. The timer acti-
vates when the participant starts moving the ‘DRAG’
square and stops upon reaching the ‘DROP’ location.
Upon successful completion, the app randomly re-
locates the ‘DRAG’ and ‘DROP’ squares, and the
task is repeated for a total of 15 sequences. Dur-
ing each drag-and-drop task, the application recorded
the position of the ‘DRAG’ square at 10 millisec-
ond intervals, generating 100 data points every sec-
ond. This provided a consistent stream of changes in
the x and y coordinates until the user relocated the
‘DRAG’ square to the ‘DROP’ location, illustrated
in Figure 4. The overall data set consists of multi-
ple time series, where each instance mirrors a single
drag-and-drop sequence. Despite potential variance
in sample lengths due to random square positions
and participant capabilities, every drag-and-drop is
recorded. For instance, Figure 4 illustrates a sequence
starting at (x
start
,y
start
) = (800,0) and the destination
(x
dest
,y
dest
) = (400,890) over 110 time-steps.
Figure 4: A single drag-and-drop sequence from start to
finish.
3.2 Synthetic Data Generation
3.2.1 Pre-Processing
Careful data pre-processing and training are essential
to achieve optimal performance from a machine learn-
ing model. This section briefly describes time-series
data pre-processing, GAN architecture, training, and
synthetic data post-processing.
Outliers can adversely affect training, especially
in time-series data where padding is needed. For ex-
ample, if the average time step count is 150 and an
outlier has 400, padding the majority of time steps
with 250 empty points may negatively impact train-
ing. Outliers—time series longer than the fourth quar-
tile (Q4)—were removed to address this. Q4 is calcu-
lated using:
Q4 = Q3 + 1.5(Q3 − Q1), (1)
where Q1 and Q3 are the 25% and 75% percentiles,
respectively.
Machine learning models require consistent input
dimensions. To address variable time series lengths,
we pad them to match the longest sequence, excluding
outliers. For instance, given:
X = [[15,23],[6,103,5],[1,3,10,15,54]]
It becomes:
X
padded
=
15 23 0 0 0
6 103 5 0 0
1 3 10 15 54
(2)
A ‘pad’ feature flags each coordinate as ‘padded’
(0) or ‘not padded’ (1).
Towards Using Synthetic User Interaction Data in Digital Healthcare Usability Evaluation
597

Figure 5: The left shows the non-normalized sample within
the original dataset, and the right shows the same sample
but normalized.
Dataset normalization stabilises gradient-based
learning and facilitates faster convergence (see exam-
ple in Figure 5). Coordinates are scaled such that
x,y ∈ [−1,1] using:
x
norm
= 2
x − x
min
x
max
− x
min
− 1 (3)
3.2.2 GAN Training
This research employs the doppelGANger architec-
ture for synthetic data generation, motivated by its su-
perior fidelity in long sequence data (Lin et al., 2020).
Separate GANs are used for younger and elderly pop-
ulations, differing in input dimensions and configu-
rations. Settings were based on manual tuning of
components and their impact on model performance,
as well as DoppelGANger’s author’s guidelines (Lin
et al., 2020).
The architecture has five networks: meta-data
generator, time series generator, min/max genera-
tor, auxiliary discriminator, and primary discrimi-
nator. We exclude the metadata generator in our
project due to introducing two distinct GANs for el-
derly and younger populations, eliminating the need
for attribute generation linking time series to user
groups. The min/max generator employs a dense
Multi-layer Perceptron (MLP) with Rectified Linear
Units (ReLU) activations and a single output, using a
Gaussian-distributed noise vector as input to produce
the desired metadata: the (min ± max)/2 value. This
metadata generates time series sequences and ensures
quality by learning each sample’s range, mitigating
mode collapse.
The time series generator operates on a Recur-
rent Neural Network (RNN) with Long Short-Term
Memory (LSTM) units, utilizing the previously gen-
erated (min ± max)/2 value and another noise vector.
It can produce multiple sequences per unit or batch
generation, depending on the settings. Batch gen-
erations above five have shown enhanced capability
to capture temporal correlations in sequences. The
model’s performance with varying batch sizes is eval-
uated through testing.
Two discriminators were used: the auxiliary and
the primary. Both use dense MLPs with ReLU. The
auxiliary discriminator evaluates the min/max genera-
tor’s performance against the actual dataset using the
Wasserstein-1 metric with a gradient penalty. Sim-
ilarly, the primary discriminator compares the time
series generator output to real sequences. Their loss
values merge to provide the GAN’s total loss, with
the auxiliary discriminator’s loss being adjustable in
weight. We update the model’s parameters using the
Adam optimizer, an efficient extension of stochas-
tic gradient descent widely used as a baseline opti-
mizer (Kingma and Ba, 2017).
Training parameters include epochs and batch
size. We employ a full dataset batch size due to
our small datasets, which helps stabilize loss val-
ues. Epoch numbers are set and adjusted based on
model performance, with evaluation techniques de-
tailed later in Section 3.3 & 4.1.2.
3.2.3 Post-Processing
Following GAN training, we generate synthetic drag-
and-drop sequences using random input vectors. The
generated data undergoes post-processing for quality
evaluation. We first re-normalize coordinates to the
original ranges using:
x = (x
norm
+ 1)
(x
max
− x
min
)
2
+ x
min
(4)
We stored the dataset’s minimum and maximum val-
ues during pre-processing, which is essential, and re-
moved padding by eliminating entries with pad =
0. Lastly, we applied an exponential moving aver-
age (EMA) to smoothen the synthetic coordinate se-
quences. EMA emphasizes recent data points and is
calculated using the following:
y
t
= (1 − α)y
t−1
+ αx
t
(5)
Where y
t
is the EMA at time t, α is the smoothing
factor (0 < α ≤ 1), and x
t
is the data point at time
t. Figure 6 illustrates EMA applied to a synthetic se-
quence with α = 0.2.
3.3 Evaluating Synthetic Data
GAN evaluation differs from traditional machine
learning domains (Goodfellow et al., 2014; Lin et al.,
2020; Esteban et al., 2017a; Yoon et al., 2019). Un-
like models judged by converging loss values, GANs
use the discriminator’s loss to adjust the generator’s
weights. To ensure quality, we combine quantita-
tive and qualitative measurements. Quantitatively,
HEALTHINF 2024 - 17th International Conference on Health Informatics
598
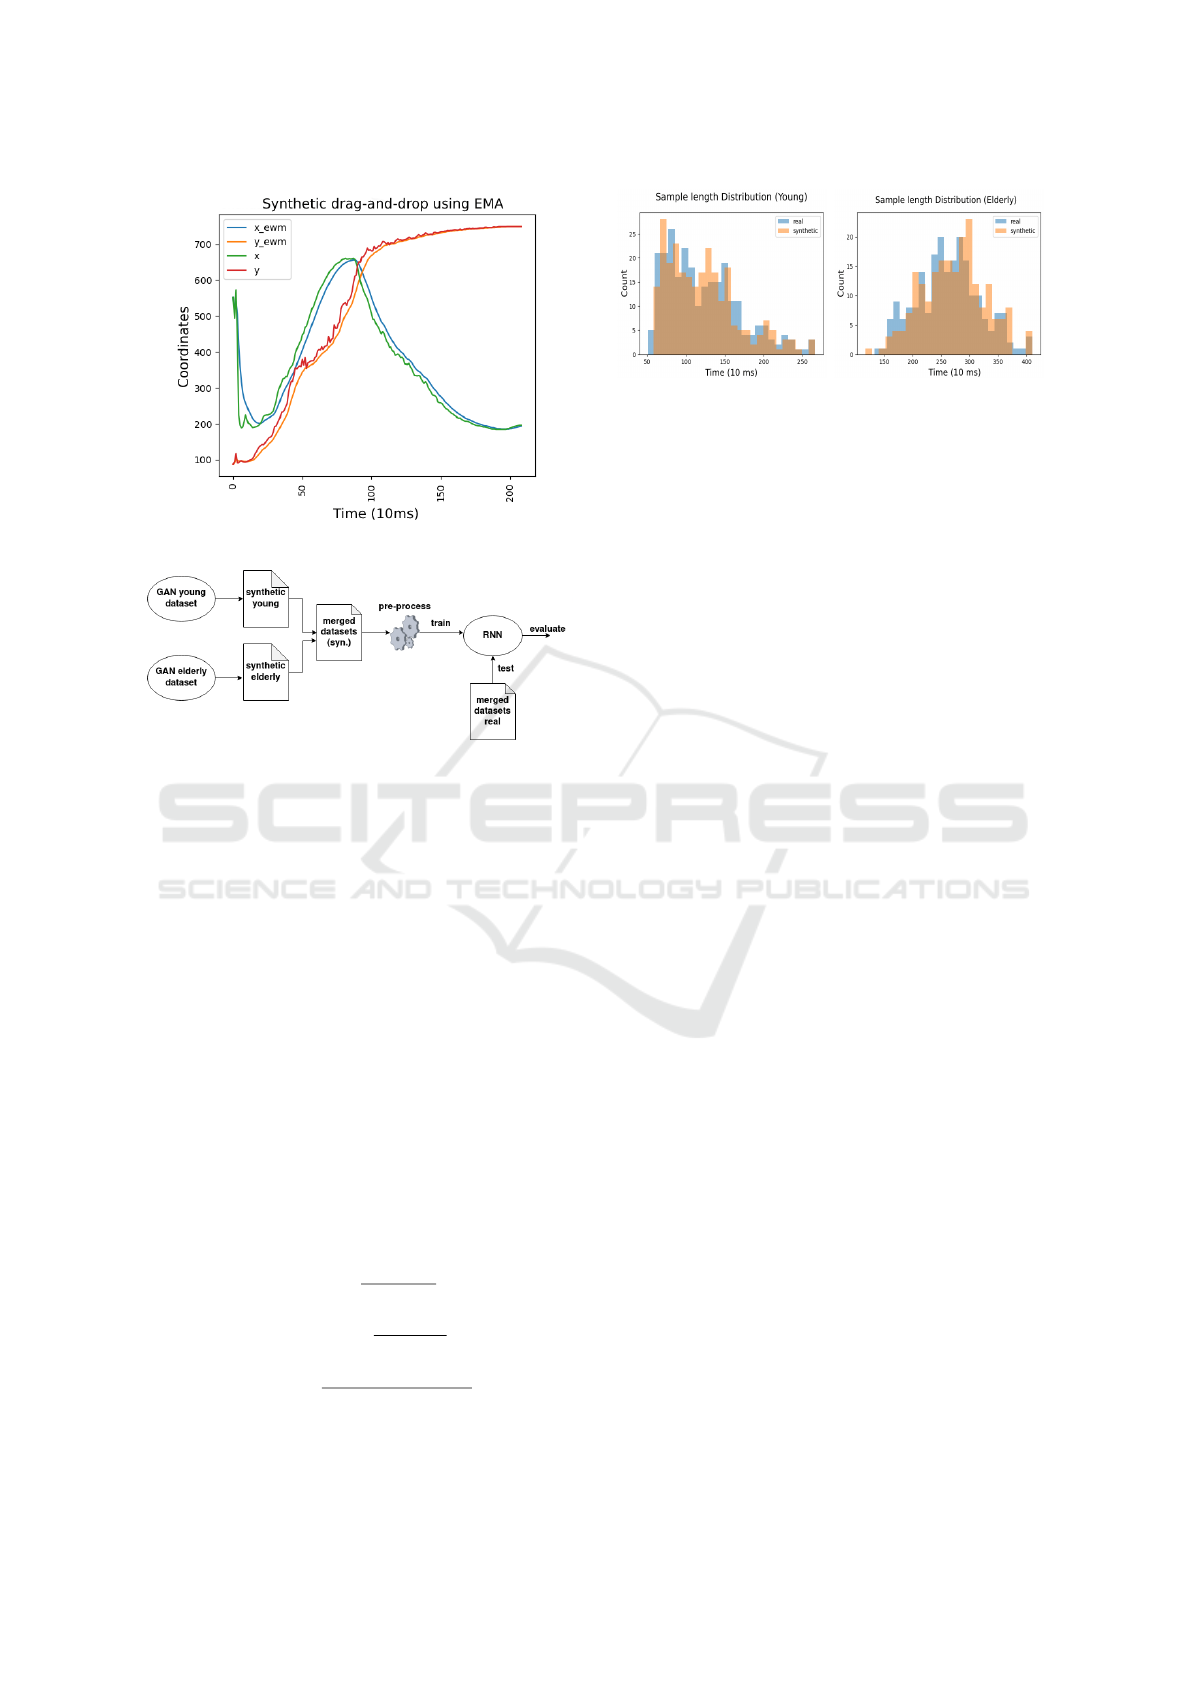
Figure 6: EMA applied over the generated coordinates.
Figure 7: TSTR workflow for the classification experiment.
we measure synthetic sample performance against the
real dataset using an RNN model. Qualitatively, we
employ visualizations and compare random synthetic
samples to real ones.
For RQ1, we checked if the GAN has captured
the real data’s distribution. Considering the time se-
ries nature, we analyse temporal correlations, calcu-
late the average delta distance between drag and drop
locations, compare sample lengths after padding re-
moval, and assess diversity using k-nearest neigh-
bours (KNN) (k=3) via Dynamic Time Warping
(DTW) (Tavenard, 2021).
We further employed the Train on Synthetic, Test
on Real (TSTR) methodology (Esteban et al., 2017b).
Using an RNN model, we classify data into younger
or elderly samples (see Figure 7). After generating
samples with trained GANs, we pre-process, label,
and train an RNN model with LSTM units. We then
test the model on real data, assessing recall, precision,
and F1 score.
Recall =
T P
T P + FN
(6)
Precision =
T P
T P + FP
(7)
F1 = 2 ∗
Precision ∗ Recall
Precision + Recall
(8)
We also train an RNN on real data for comparison.
Figure 8: Sample length distribution for the real and syn-
thetic datasets.
If metrics align for both models, the synthetic data
quality is considered comparable to the real data.
4 RESULTS AND DISCUSSION
The data were collected through opportunistic sam-
pling at Karlstad University and through personal and
professional connections in Karlstad, involving a to-
tal of 34 participants: 19 young (18-45 years, 56%)
and 15 elderly (>45 years, 44%). UI interaction was
equally split between thumb and finger. 94% were
right-handed and 6% left-handed. After removing
outliers, the average drag-and-drop time was 1.22s for
the younger group and 2.64s for the elderly. Stan-
dard deviations were 0.48s (young) and 0.56s (el-
derly). The longest times were 2.66s (young) and
4.10s (elderly), while the shortest were 0.51s (young)
and 1.33s (elderly).
4.1 Answer to RQ1
4.1.1 Fidelity of the Synthetic Data
In this section, we focus on addressing RQ1 on the
accuracy and performance of SDG-generated user UI
interaction data in replicating real UI interactions.
Figure 8 shows the length distribution of actual and
synthetic datasets.
In analysis, the GAN for younger users was found
to mirror the real dataset, especially in the 0.5-1.75s
range. The elderly data GAN also aligns but is
more biased toward samples around 3s. Table 1 lists
the datasets’ mean, median, and standard deviation,
with minor differences between the synthetic and real
datasets for the younger group and a slight mean dif-
ference of 83ms for the elderly group. Figure 9 dis-
plays delta distance trends for target locations. Syn-
thetic data for both groups have a similar delta dis-
tance decrease over time, indicating accurate tempo-
ral correlations. Yet, both synthetic datasets show mi-
nor increases in initial delta distances, more so for the
Towards Using Synthetic User Interaction Data in Digital Healthcare Usability Evaluation
599
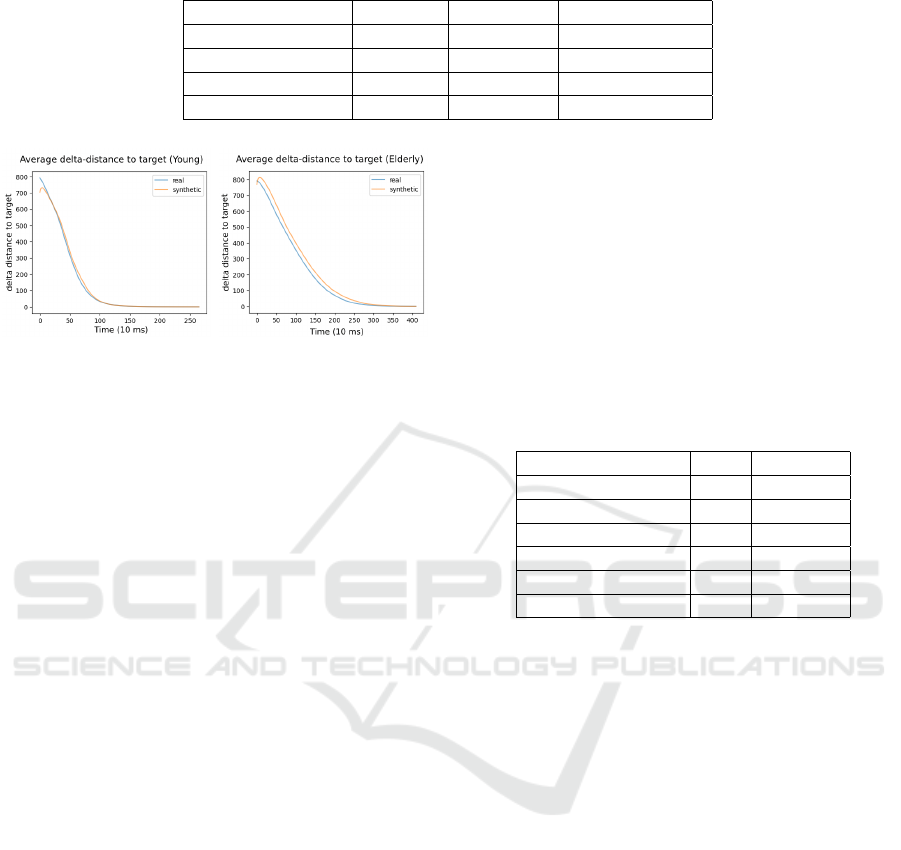
Table 1: Sample length distribution.
Dataset Mean (s) Median (s) Std. Dev. (+/- s)
Real (Young) 1.224 1.130 0.476
Synthetic (Young) 1.218 1.160 0.425
Real (Elder) 2.634 2.635 0.562
Synthetic (Elder) 2.717 2.745 0.559
Figure 9: Average delta distance to target location.
elderly. To ensure GANs didn’t mimic the original
dataset, Figures 10 compare three synthetic samples
to their nearest real counterparts. These comparisons
show synthetic samples follow general trends but dif-
fer in length and contain some noise, confirming they
aren’t direct copies of the original data.
Overall, the results show that elderly and younger
GANs produce sample lengths similar to the real user
interaction dataset, maintaining consistent statistical
properties like mean, median, and standard deviation.
GANs must produce diverse, high-quality samples;
otherwise, synthetic data won’t accurately represent
the original dataset’s range. Both GANs avoid mode-
collapse concerning length distribution. Figure 9 re-
veals that the synthetic dataset for the young popu-
lation has decreasing delta distance over time, indi-
cating maintained temporal correlation. However, the
younger GAN samples start closer to the target loca-
tion than the real data. This suggests the min-max
generator might not entirely capture the real dataset’s
range. The elderly synthetic data shows decreasing
delta distances but leans towards longer sequences,
potentially biasing its use cases. Both GANs exhibit a
slight fluctuation in delta distance at sequence starts,
possibly due to architectural issues. Adjusting GAN
settings, like adding layers, might address this. Lastly,
synthetic datasets for both populations are diverse and
unique, ensuring no duplicate entries when augment-
ing existing datasets.
4.1.2 Performance Evaluation
Using a simple RNN architecture, we classify the
drag-and-drop sequences into younger or elderly
groups. The model is trained for 50 epochs with a
batch size of 64. Of 477 samples, 382 (80%) are for
training (210 younger, 172 elderly) and 95 (20%) for
testing. Figure 11 displays precision, recall, and F1
scores from cross-validation. The model generally
performs better with real data, though synthetic data
occasionally scores slightly higher. Table 2 presents
average scores. The real dataset’s recall surpasses the
synthetic by 2.4%, with both having minor variance.
The precision difference between datasets is 1.9%,
with real data performing better. F1 scores show a
similar trend.
Table 2: Average model performance for both synthetic and
real datasets.
Metrics Real Synthetic
Recall % 94.0 91.6
Std. Dev. (Rec.)% 4.2 5.4
Precision% 84.8 82.9
Std. Dev. (Prec.)% 5.4 3.1
F1% 88.9 86.9
Std. Dev. (F1)% 1.6 2.5
The external RNN model trained on real data per-
forms better than synthetic data, aligning with previ-
ous studies (Lin et al., 2020; Yoon et al., 2019; Es-
teban et al., 2017a). However, the performance dif-
ference is minimal, showing the synthetic data’s qual-
ity is comparable to real UI interactions. The current
model architecture might not be optimal; adjusting
hyperparameters or model complexity could enhance
performance. Yet, it’s likely real data would still out-
perform synthetic, even though by a smaller margin.
The RNN model’s ability to differentiate between el-
derly and young interactions depends on two patterns.
One, the average length differences between elderly
and young samples are distinct (Table 1), potentially
influencing the RNN’s learning process. Two, the
model might recognise samples based on temporal
correlations in captured coordinates. Elderly users of-
ten prioritize accuracy over speed for precise, error-
free interactions with technology (Nurgalieva et al.,
2019; Tsai et al., 2017), resulting in more clustered
coordinates toward sequence ends. This observation
is backed by Figure 10 showcasing the synthetic sam-
ples’ nearest neighbours. Overall, the GANs’ abil-
ity to produce synthetic data nearly matching real
data performance demonstrates their significant util-
HEALTHINF 2024 - 17th International Conference on Health Informatics
600
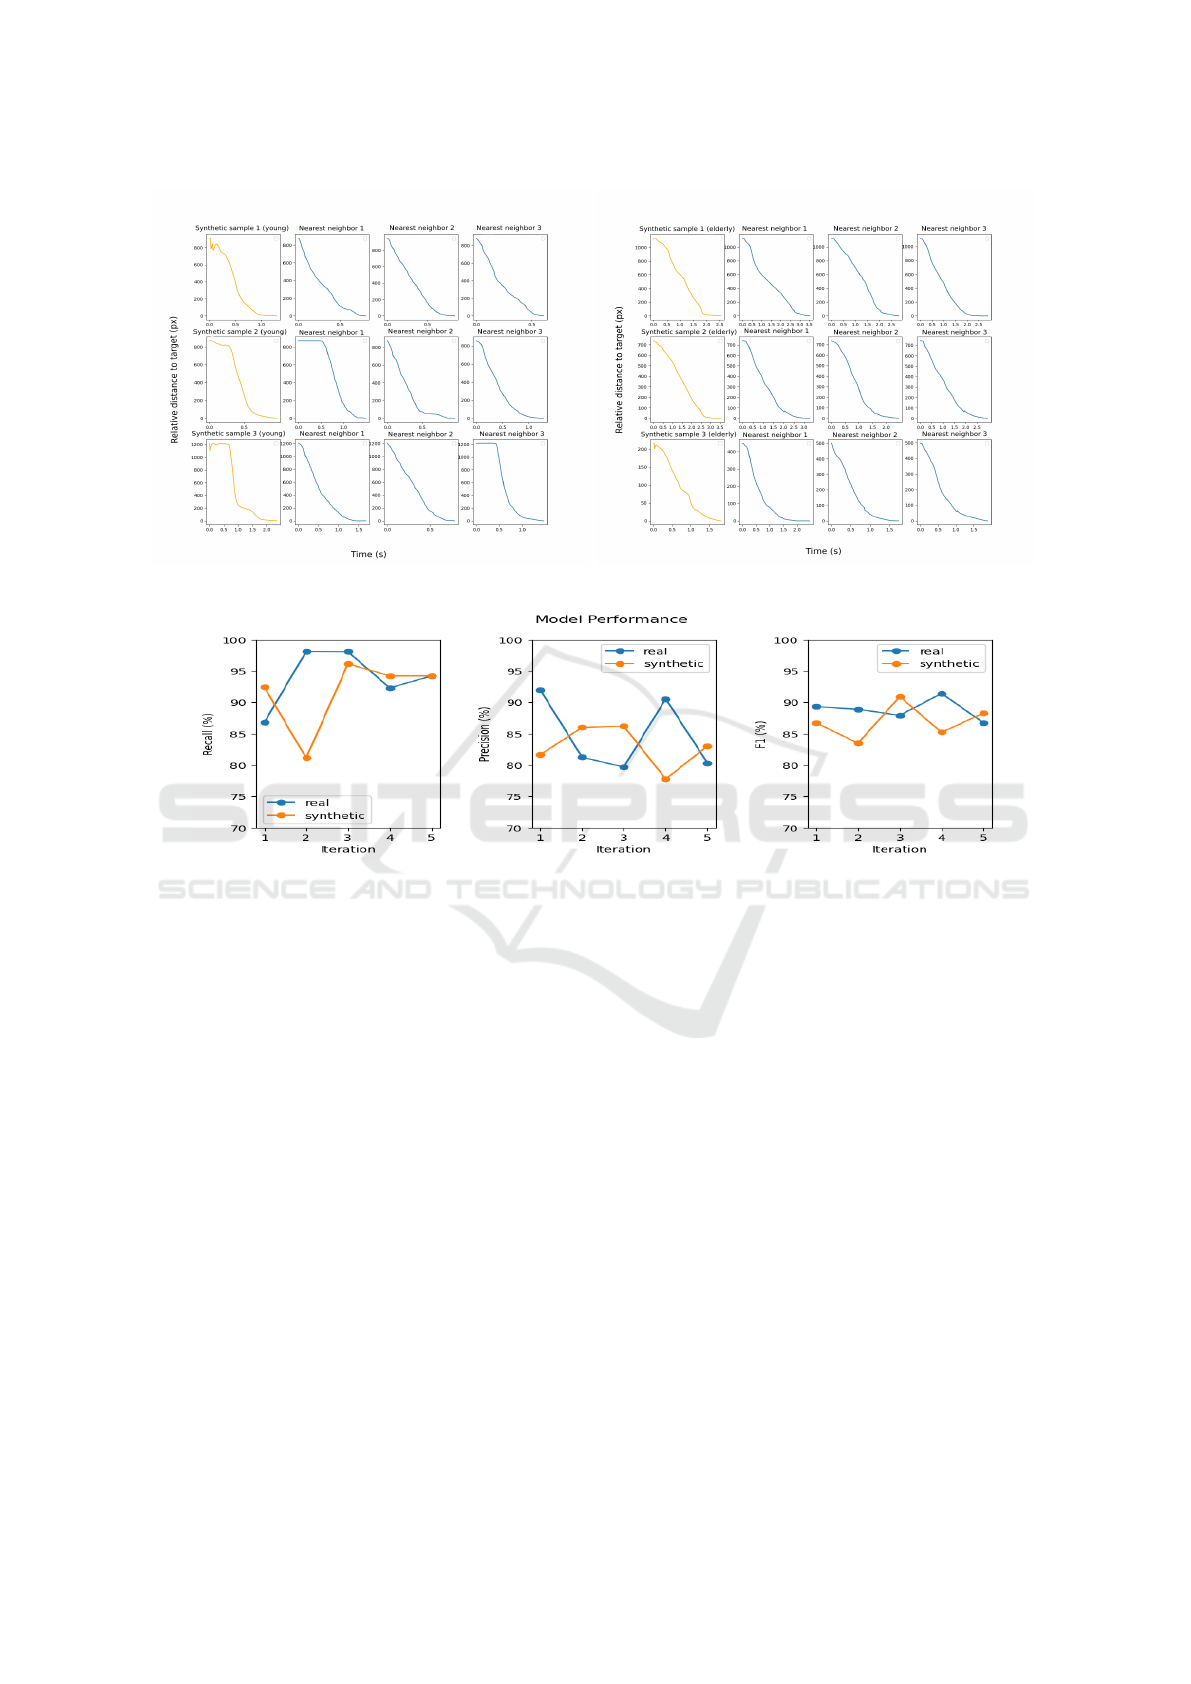
Figure 10: Nearest neighbours of the synthetic samples (Young left and Elderly right).
Figure 11: Model performance when trained and tested on both real and synthetic data.
ity. This is particularly relevant in healthcare do-
mains, where acquiring user data can be challenging
due to complexity, health and privacy concerns, and
regulatory constraints (Wang et al., 2021).
4.2 Answer to RQ2: Usability
Evaluation in Digital Healthcare
With technological advancement and the increase in
the use of healthcare apps (Allen, 2021; Quin, 2020),
the ease of use and accessibility of digital interfaces
have become more crucial (Ross et al., 2020). Our re-
search introduces a novel potential for usability eval-
uation of digital healthcare applications by generat-
ing synthetic UI interaction data to supplement lim-
ited datasets (Wang et al., 2021). This approach can
enhance efficiency by simulating diverse user interac-
tion patterns, which are typically challenging to cap-
ture with traditional data collection methods. It is par-
ticularly advantageous for including user groups of-
ten excluded due to ethical or other recruitment chal-
lenges (Maqbool and Herold, 2024).
The proposed framework can serve as a valuable
complement to usability testing, which often relies on
direct user interactions and faces challenges such as
limited participant scale and subjective data interpre-
tation. Our framework can help overcome these lim-
itations by simulating a wide range of user interac-
tions. This can be useful to mimic controlled exper-
iments, providing quantitative data related to execu-
tion time and, in the future, task completion and er-
ror rate. This dimension can enhance the understand-
ing gained from usability testing by offering objec-
tive, measurable data that can validate or expand upon
qualitative findings.
Utilizing GANs, our methodology also can ad-
dress ethical and privacy concerns (Wang et al.,
2021). The similarity of synthetic data to real user
interactions, as evidenced by our results, supports its
application in usability evaluation while minimizing
the need for extensive recruitment of volunteers from
hard-to-recruit populations. The research also re-
vealed that the synthetic datasets generated by GANs
for both elderly and younger user groups maintain sta-
tistical properties related to real interaction data. This
fidelity ensures that such setup can be used for fu-
Towards Using Synthetic User Interaction Data in Digital Healthcare Usability Evaluation
601

ture imitation learning so developers and designers
can predict and assess the accessibility of specific UI
elements for a wide range of user interactions in med-
ical contexts, although it could be generalized for any
other context.
Imitation learning (IL) models (Hussein et al.,
2017), enhanced by synthetic UI data, can permit high
precision simulation of real-user interactions with UI
elements. These models are both adjustable and pre-
dictive, allowing for the anticipation of user interac-
tions with new features designed with particular users
in mind, such as drag-and-drop functions for older
adults. These IL models can offer preliminary us-
ability evaluations for new UI prototypes, facilitating
a faster design process and enabling quick modifica-
tions based on data-driven insights. Such tools are
invaluable for addressing data collection challenges
and ensuring UI elements cater to the specific needs
of niche and sensitive user groups.
Furthermore, our proposed framework can aid
expert-based heuristic evaluations in a specific, tar-
geted manner. While heuristic evaluations offer in-
depth qualitative insights into usability, identifying is-
sues based on established principles, they can some-
times miss quantifiable aspects of user interaction.
Our framework can address this gap by providing
quantitative data, such as execution time. This data
can offer additional context to the issues identified
in heuristic evaluations. For example, if a heuristic
evaluation identifies a navigation issue, our frame-
work can quantify the impact of this issue in terms
of user efficiency or error frequency. This integrated
approach, however, is not a replacement for heuristic
evaluations but serves to deepen the insights derived
from them.
In summary, our investigation underlines the po-
tential and importance of synthetic data in mitigat-
ing the challenges associated with usability evalua-
tions, especially in digital healthcare. Furthermore, it
guides the foundation for leading further experiments
on the framework, as highlighted in Section 2. By ex-
ploring and understanding user interaction nuances,
for example, the preference for accuracy vs speed
among the elderly dealing with Parkinson’s, designers
can create more inclusive user interfaces. Thus, syn-
thetic data not only can serve as a cornerstone for fu-
ture healthcare UI development but also as a means to
deepen our understanding of user engagement across
various demographics.
4.3 Limitations of Study
This research focused only on the drag-and-drop UI
interaction, simplifying participant involvement in the
pilot experiment. While this made data collection
quicker, it may not capture the breadth of real-world
UI interactions. The experiment’s scenario does not
simulate real-world UI design tests, and only the dop-
pelGANger GAN architecture was utilized. In GAN
training, we excluded metadata, like hand dominance
or participant age. Limited hardware resources ex-
tended GAN training to 2 hours, restricting optimal
hyperparameter tuning. The study targets time series
representable UI interactions, which may not suit all
UI scenarios or problem settings.
This study offers an initial examination of a pro-
posed framework, highlighting its potential while ac-
knowledging its limitations. The framework, cur-
rently in its early stages of development, presents a
conceptual foundation that necessitates thorough em-
pirical validation and iterative refinement. Imple-
menting practical applications and empirical evidence
will influence the future direction of this research.
Such factors will inform the framework’s evolution,
providing a more comprehensive and applicable so-
lution. This iterative process is expected to address
initial shortcomings, thus ensuring the framework’s
relevance and effectiveness in its intended domain.
5 CONCLUSIONS
This paper investigates the use of GANs for creat-
ing synthetic user UI interaction data, particularly for
drag-and-drop actions, and its application in digital
healthcare usability evaluation. Our results affirm the
doppelGANger architecture’s efficacy in generating
high-quality synthetic UI interaction data, mirroring
real user patterns. Notably, the synthetic data is sim-
ilar to real data in classifying user interactions of dif-
ferent age groups using RNNs.
In healthcare, where gathering diverse user data is
often limited by ethical, practical, and privacy con-
cerns, especially for sensitive groups like the elderly,
GANs provide a practical solution. GANs produce
datasets that closely mirror actual interactions, mini-
mizing the need for recruiting large numbers of par-
ticipants from sensitive groups.
The consistent statistical properties of the syn-
thetic data with real datasets can aid in imitating di-
verse user interactions. This data can especially be
used in imitation learning models, offering a tool
to evaluate UI elements across diverse user groups
and predict interactions with newer features, such as
modified drag-and-drop button sizes for elderly users.
This research thus presents synthetic data generation
as a tool in the future of healthcare UI design, allow-
ing for fine-tuning UI elements to specific user pref-
HEALTHINF 2024 - 17th International Conference on Health Informatics
602

erences, such as the elderly’s emphasis on precision
over speed.
Future directions include working in the further
direction of the proposed usability evaluation frame-
work, exploring more UI interaction gestures, and
investigating if a unified GAN model can cover
multiple user groups. In this specific GAN con-
text, a comparative study on GAN architectures, like
TimeGAN (Yoon et al., 2019) and RCGAN (Esteban
et al., 2017a), could also be insightful.
ACKNOWLEDGEMENTS
This work was partly funded by Region V
¨
armland
through the DHINO project (Grant: RUN/220266)
and partly funded by Vinnova through the DigitalWell
Arena (DWA) project (Grant: 2018-03025).
REFERENCES
Ahmad Faudzi, M., Che Cob, Z., Omar, R., Sharudin, S. A.,
and Ghazali, M. (2023). Investigating the user inter-
face design frameworks of current mobile learning ap-
plications: A systematic review. Education Sciences,
13(1):94.
Alghamdi, A. M., Riasat, H., Iqbal, M. W., Ashraf, M. U.,
Alshahrani, A., and Alshamrani, A. (2022). Intel-
ligence and usability empowerment of smartphone
adaptive features. Applied Sciences, 12(23):12245.
Allen, S. (2021). New apps drive health care innovation,
access to care. IEEE pulse, 12(2):28–32.
Cresswell, K. M., Bates, D. W., and Sheikh, A. (2013). Ten
key considerations for the successful implementation
and adoption of large-scale health information tech-
nology. Journal of the American Medical Informatics
Association, 20(e1):e9–e13.
Dahmen, J. and Cook, D. (2019). Synsys: A synthetic data
generation system for healthcare applications. Sen-
sors, 19(5):1181.
Esteban, C., Hyland, S. L., and R
¨
atsch, G. (2017a). Real-
valued (medical) time series generation with recurrent
conditional gans. arXiv preprint arXiv:1706.02633.
Esteban, C., Hyland, S. L., and R
¨
atsch, G. (2017b). Real-
valued (medical) time series generation with recurrent
conditional gans.
Goodfellow, I. J., Pouget-Abadie, J., Mirza, M., Xu, B.,
Warde-Farley, D., Ozair, S., Courville, A., and Ben-
gio, Y. (2014). Generative adversarial networks.
Hussein, A., Gaber, M. M., Elyan, E., and Jayne, C. (2017).
Imitation learning: A survey of learning methods.
ACM Computing Surveys (CSUR), 50(2):1–35.
Khajouei, R., de JONGH, D., and Jaspers, M. W. (2009).
Usability evaluation of a computerized physician or-
der entry for medication ordering. In Medical Infor-
matics in a United and Healthy Europe, pages 532–
536. IOS Press.
Kingma, D. P. and Ba, J. (2017). Adam: A method for
stochastic optimization.
Kobayashi, M., Hiyama, A., Miura, T., Asakawa, C., Hi-
rose, M., and Ifukube, T. (2011). Elderly user evalu-
ation of mobile touchscreen interactions. In Campos,
P., Graham, N., Jorge, J., Nunes, N., Palanque, P., and
Winckler, M., editors, Human-Computer Interaction
– INTERACT 2011, pages 83–99, Berlin, Heidelberg.
Springer Berlin Heidelberg.
Lin, Z., Jain, A., Wang, C., Fanti, G., and Sekar, V. (2020).
Using GANs for sharing networked time series data.
In Proceedings of the ACM Internet Measurement
Conference. ACM.
Maqbool, B. and Herold, S. (2024). Potential effectiveness
and efficiency issues in usability evaluation within
digital health: A systematic literature review. Jour-
nal of Systems and Software, 208:111881.
Nurgalieva, L., Jara Laconich, J. J., Baez, M., Casati, F., and
Marchese, M. (2019). A systematic literature review
of research-derived touchscreen design guidelines for
older adults. IEEE Access, 7:22035–22058.
Quin (2020). Digital health habits in the uk: a
quin nationwide survey. Accessed Archive at
https://web.archive.org/web/20211005041902/-
https://quintech.io/what-do-the-uk-public-think-
about-health-apps/ on 2023-11-09.
Ross, A. S., Zhang, X., Fogarty, J., and Wobbrock, J. O.
(2020). An epidemiology-inspired large-scale analy-
sis of android app accessibility. ACM Transactions on
Accessible Computing (TACCESS), 13(1):1–36.
Serrano, W. (2018). Digital systems in smart city and infras-
tructure: Digital as a service. Smart cities, 1(1):134–
154.
Statista (2023). Number of smartphone users worldwide
from 2013 to 2028. Accessed: 2023-10-20.
Tavenard, R. (2021). An introduction to dynamic time
warping. Accessed: 2023-10-25.
Tsai, T.-H., Tseng, K. C., and Chang, Y.-S. (2017). Testing
the usability of smartphone surface gestures on differ-
ent sizes of smartphones by different age groups of
users. Computers in Human Behavior, 75:103–116.
Wang, Z., Myles, P., and Tucker, A. (2021). Generating and
evaluating cross-sectional synthetic electronic health-
care data: preserving data utility and patient privacy.
Computational Intelligence, 37(2):819–851.
Yoon, J., Jarrett, D., and Van der Schaar, M. (2019). Time-
series generative adversarial networks. Advances in
neural information processing systems, 32.
Zhang, D. and Adipat, B. (2005). Challenges, methodolo-
gies, and issues in the usability testing of mobile ap-
plications. International journal of human-computer
interaction, 18(3):293–308.
Towards Using Synthetic User Interaction Data in Digital Healthcare Usability Evaluation
603
