
Predictive Biomarkers in PD-1/PD-L1 Immunotherapy Response:
A Machine Learning Approach Using Gene Sequencing Data
Carolina Castaño
1a
, Isis Bonet
1b
, Joseph Pinto
2c
and Jhajaira Araujo
2d
1
EIA University, Variante al Aeropuerto José María Córdova, Envigado, Colombia
2
AUNA Ideas, Lima, Peru
Keywords: Cancer Immunotherapy, PD-1/PD-L1 Inhibitors, Predictive Biomarkers, Transcriptomic Analysis,
Artificial Intelligence, Machine Learning, Agnostic Prediction Models, RNA Sequencing.
Abstract: Cancer, a leading cause of premature death globally, has seen a surge in new cases, projected to reach 28.4
million by 2040. Immunotherapy with immune checkpoint inhibitors (ICIs) like PD-1/PD-L1 inhibitors
presents a promising treatment avenue. However, patient response rates vary, prompting the search for
predictive biomarkers. Existing markers, often derived from transcriptomic analyses, exhibit moderate
accuracy, hindered by cancer heterogeneity and tissue specificity. Artificial intelligence models, classified
into regression, classification, and deep learning, have shown promise. Despite their potential, the limitations
of current biomarkers require exploring combined predictions with multiple markers, considering various
biological mechanisms. In this study, a machine learning model using RNA sequencing data from 546 patients
with urothelial, renal, thymic, melanoma, non-small cell carcinoma, and oral cavity carcinoma from nine
different cohorts, obtained in public databases, identified 55 genes influencing response classification. The
GradientBoosting model demonstrated superior predictive performance compared to previous reports, with
an AUC of 0.95, a recall of 0.84, and a specificity of 0.90. Clustering algorithms using SHapley Additive
exPlanations values from the model, revealed nine sample groups, each with a majority class and eight of
them associated with different types of cancer, demonstrating the potential for agnostic prediction models.
1 INTRODUCTION
According to the World Health Organization (WHO),
cancer is the leading cause of death before age of 70
in 112 out of 183 countries and ranks third or fourth
in the remaining 23 countries. The incidence of new
cancer cases in 2020 was 19.3 million and is expected
to increase to 28.4 million by 2040 (Sung et al.,
2021). This increase is attributed to the growth of the
elderly population and the prevalence of risk factors
associated with economic development. Cancer is
often referred to as the disease of the modern age
(Bray et al., 2018). Immunotherapy with immune
checkpoint inhibitors (ICI), such as such targeting
programmed cell death protein 1 (PD-1),
programmed death-ligand 1 (PD-L1), has emerged as
a promising therapeutic approach. ICIs stimulate the
a
https://orcid.org/0000-0003-0208-6402
b
https://orcid.org/0000-0002-3031-2334
c
https://orcid.org/0000-0002-7744-1635
d
https://orcid.org/0000-0002-9639-8070
immune system to target cancer cells in tumors
without identified genetic targets (Reck et al., 2013).
While ICIs have shown remarkable responses in some
cancer patients, the selection of patients who benefit
remains low, with varying response rates and clinical
outcomes (Kornepati et al., 2022). To improve
personalized clinical decisions and treatment
procedures, predictive biomarkers for individual ICI
responses are crucial (Hwang et al., 2020). Various
biomarkers have been proposed, based on
transcriptomic analysis (Topalian et al., 2016), with
the majority obtained from traditional statistical tests,
and a few, in recent years, derived from machine
learning techniques using features extracted from
gene expression quantification, including IFN-γ
pathway (Yu et al., 2021), tumor-infiltrating
lymphocytes (Paijens et al., 2021), tumor mutation
Castaño, C., Bonet, I., Pinto, J. and Araujo, J.
Predictive Biomarkers in PD-1/PD-L1 Immunotherapy Response: A Machine Learning Approach Using Gene Sequencing Data.
DOI: 10.5220/0012427500003657
Paper published under CC license (CC BY-NC-ND 4.0)
In Proceedings of the 17th International Joint Conference on Biomedical Engineering Systems and Technologies (BIOSTEC 2024) - Volume 1, pages 379-390
ISBN: 978-989-758-688-0; ISSN: 2184-4305
Proceedings Copyright © 2024 by SCITEPRESS – Science and Technology Publications, Lda.
379

burden (TMB) (Chan et al., 2019), T cell receptor
(Han et al., 2020), CTLA-4 promoter
hypomethylation (Klümper et al., 2021), DNA repair
machinery (Chabanon et al., 2016), microsatellite
instability (Bonneville et al., 2017) neoantigen
presentation (Abbott et al., 2021), gender differences
(Ye et al., 2020), and gut microbiome (Liang et al.,
2022). To predict the response to immunotherapy,
artificial intelligence models fall into three categories.
The first category includes regression models for
predicting progression-free or overall survival time,
with techniques like LASSO and Cox regression
being prominent (Jia et al., 2023; T. Li et al., 2023; F.
Song et al., 2023; J. Song et al., 2022). The second
category comprises machine learning-based
classification models, primarily using algorithms like
Random Forest, Support Vector Machines, and
artificial neural networks, with genetic signatures
obtained from differential expression analysis or
protein-protein interaction network analysis (Chen et
al., 2021; Huang et al., 2022; Kong et al., 2022; Uhlik
et al., 2023). Lastly, deep learning classification
models, particularly deep neural networks (DNNs),
have shown potential (Kang et al., 2022). However,
these biomarkers are limited by their moderate
accuracy, cancer heterogeneity, and tissue specificity
(Sun et al., 2021).
There is a need to explore how combined
prediction with multiple biomarkers associated with
different biological mechanisms can enhance model
performance in terms of specificity and sensitivity, to
be more effective in clinical applications. The
limitations of proposed biomarkers may result from
small study cohorts and incomplete analysis of the
mechanisms involved in ICI response. This response
depends on several mechanisms involved in the
immune processes of tumor control by both the host
and the tumor, necessitating the analysis of both the
tumor and the microenvironment (Liberini et al.,
2021). Cancer is a heterogeneous disease, even within
the same anatomical site. Important factors, such as
cell composition and signalling pathways exploited
by the tumor to escape the immune system, can vary
between patients. Therefore, comprehensive
approaches that combine different involved
mechanisms are required. In this context,
transcriptomic information can be harnessed for this
purpose (Lapuente-Santana et al., 2021).
Conventional methods based on differential
expression do not allow for comprehensive analysis,
as different molecular features in each tumor's profile
need to be considered to predict its response to
immunotherapy accurately. Artificial intelligence can
be invaluable in this context due to its ability to find
associations among a large number of variables,
enabling the prediction of responses that encompass
different mechanisms.
In this study, a machine learning-based
computational model was developed to predict the
response to PD1/PD-L1 immune checkpoint
inhibitors in solid tumors using RNA sequencing
data. From the model, 55 genes were identified that
participate in the classification of the response, and
additionally, the relevance of each one in the model
was determined. Using this information and applying
clustering algorithms, 9 patient clusters were
identified, some of these groups showing a positive
response and others showing a negative response to
immunotherapy. Eight of these clusters contain
samples from various types of cancer included in the
study: melanoma, renal cancer, thymic carcinoma,
urothelial cancer, non-small cell lung carcinoma, and
squamous cell carcinoma of the oral cavity; only one
of the clusters showed specificity for melanoma.
These results show that there are common evasion
mechanisms between different types of cancer and
that it is possible to use agnostic prediction models
for the response to immunotherapy with PD-1 / PD-
L1 checkpoint inhibitors.
2 METHODS
2.1 Acquisition of Transcriptomic
Information from Public Databases
Data were collected from 546 patients with advanced
or metastatic solid tumors, along with anonymized
clinical information. Biopsies for RNA sequencing
were obtained from these patients before receiving
PD-1 or PD-L1 immunotherapy, and their responses
were classified according to RECIST 1.1 criteria.
Raw RNA-seq data were obtained from nine
cohorts, including six from the GEO database,
comprising 49 melanoma patients treated with anti-
PD-1 from the study by Riaz, et al. (Accession
PRJNA356761) (Riaz et al., 2017), 28 melanoma
patients treated with anti-PD-1 from the study by
Hugo, et al. (Accession PRJNA312948) (Hugo et al.,
2016), 6 melanoma patients treated with anti-PD-1
from the study by Auslander, et al. (Accession
PRJNA476140) (Auslander et al., 2018), 8 thymic
carcinoma patients treated with anti-PD-1 from the
study by HE, et al. (Accession PRJNA753518), 27
nonsmall cell lung carcinoma patients treated with
anti-PD-1 or anti-PD-L1 from the study by Jung, et
al. (Accession PRJNA557841) (Jung et al., 2019),
and 11 squamous cell carcinoma of the oral cavity
BIOINFORMATICS 2024 - 15th International Conference on Bioinformatics Models, Methods and Algorithms
380

patients treated with anti-PD1 from the study by Liu,
et al. (Accession PRJNA744780) (S. Liu et al., 2021).
Two cohorts were obtained from the ENA database,
including 33 melanoma patients treated with anti-PD-
1 from the study by Gide, et al. (Accession
PRJEB23709) (Gide et al., 2019) and 7 melanoma
patients treated with anti-PD-1 or anti-PD-L1 from
the study by Du, et al. (Accession PRJNA706446)
(Du et al., 2021). Two cohorts were obtained from the
EGA database, including 296 urothelial cancer
patients treated with anti-PD-L1 from Mariathasan, et
al.'s database (project EGAS00001002556, requires
access authorization) (Mariathasan et al., 2018) and
81 renal cancer patients treated with anti-PD-L1 from
McDermott, et al.'s study (project
EGAS00001002928, requires access authorization)
(McDermott et al., 2018). The RNA-seq data
obtained for each patient are paired in all cases,
meaning there are two fastq.gz files for each patient
since both the 5' end and the 3' end of an RNA
fragment were sequenced. Patients with paired data
were selected to gain more information and provide
greater reliability in subsequent processes.
2.2 Quantification of Expression from
RNA-Seq Data
The cleaning of the FASTQ format files was
performed using Cutadapt, STAR software was used
for read alignment and the abundance of each
transcript was quantified using FeatureCounts
software.
2.2.1 Data Cleaning
For the initial cleaning, the software Cutadapt 4.5 was
used with the following parameters: -q quality-cutoff
30: sequences with a quality score below 30 were
removed. --max-n 0: Sequences with the presence of
the base "N" or unknown bases were eliminated. -m
minimum-length 40: Sequences with a length less
than 40 bases were discarded.
2.2.2 Read Alignment
To perform read mapping, the STAR 2.7 tool and the
reference genome GRCh38.p14 in FASTA format,
downloaded from the NCBI, were used. The output
format was configured as BAM organized by
coordinates. --chimSegmentMin 12 set the minimum
length required for read segments to be considered as
potential splices in the alignment.
2.2.3 Expression Quantification
The software FeatureCounts 2.0.2 was used for
transcript counting, along with the annotation file
containing information about the genomic features to
be counted in GTF format, downloaded from NCBI
for the GRCh38.p14 genome. --countReadPairs was
used to count read pairs instead of individual reads for
a more accurate analysis. -t exon was used to count
the number of reads that align to exons (coding
regions of DNA) to estimate gene and isoform
expression. -g gene_id was used to employ the gene
identifier (gene_id) as the primary column for
labeling the counting results.
2.3 Principal Component Analysis
Principal Component Analysis (PCA), using the
Python Sklearn library implementation, was
conducted to identify the presence of batch effects.
Prior to this, Variance Stabilizing Transformation
(VST) was performed on the raw counts, using
DESeq2 software package in R. The normalization
process involved the following steps: 1. A
DESeqDataSet object was created from the count
matrix using the DESeqDataSetFromMatrix()
function. In the colData parameter, a DataFrame was
provided with the response for each patient and their
respective cohort. The condition column in the
DataFrame was specified in the design parameter. 2.
The DESeq() function was applied to the
DESeqDataSet object to estimate the dispersion,
calculate the size factors, and fit a negative binomial
regression model. 3. Transcripts with a total
expression sum across all samples less than 5 were
removed. 4. The vst() function was applied to the
DESeqDataSet object, with the blind=FALSE
parameter to consider the previously calculated size
factors.
2.4 Batch Effect Correction
Batch effect correction was performed using the
Combat-seq implementation from the Bioconductor
package in R. The correction was applied to the raw
data, following the developer's guidelines (Zhang et
al., 2020). In the "batch" parameter, different cohorts
per sample were specified, and in the "group"
parameter, the response type per sample was
indicated according to the previously defined
response strategy in the methodology (0 for no
response and 1 for response). Subsequently, the data
were normalized using VST.
Predictive Biomarkers in PD-1/PD-L1 Immunotherapy Response: A Machine Learning Approach Using Gene Sequencing Data
381

2.5 Differential Expression Analysis
Differential expression analysis was performed to
identify transcripts with the greatest expression
differences between patients who respond and those
who do not respond to immunotherapy, according to
the previously defined response strategy in the
methodology. For this purpose, the data with batch-
effect correction, but without VST, were used, as the
DESeq2 software employs its own normalization
process.
The results of the differential expression analysis
were obtained using the function results
(DESeqDataSet). The parameters p-adjusted = 0.05
and lfcThreshold = 0.25 were set for the differential
analysis of responders vs. non-responders.
Gene Set Enrichment Analysis (GSEA) was
performed to identify enriched biological pathways
by those genes with significant differential expression
(lfcThreshold = 0.1), using the KEGG canonical
pathways knowledge base with a q-value of 0.05.
Analysis was also carried out for the top 5 cohorts
with the highest number of patients.
2.6 Machine Learning Models for
Classification
To develop the classification algorithm, the following
procedure was implemented: 1. 10-fold cross
validation was developed using the StratifiedKFold
(n_splits=10, shuffle=True, random_state=11). In
each fold, the SMOTE algorithm (Synthetic Minority
Oversampling Technique) was used to balance the
data in the training and test sets separately. Various
machine learning models were trained and tested
using the Python Sklearn library, consistently
yielding better results with the GradientBoosting
algorithm. 2. SHapley Additive exPlanations (SHAP)
was used to identify the features that contribute the
most to the GradientBoosting model in the training
data. A new data set was generated from features with
contributions greater than or equal to 0.01. 3.
Accuracy, AUC, sensitivity, and specificity metrics,
along with confusion matrices, were obtained for
each fold. The mean accuracy and AUC across folds
were calculated, and a confusion matrix and general
metrics were obtained.
This procedure was tested with different initial
datasets, various normalization methods, in the
complete count matrix or the transcripts obtained
from differential expression analysis (padjust = 0.05
and lfcThreshold = 0.1).
Later, the adjustment of the 'n_estimators' and
'criterion' parameters of the GradientBoosting
algorithm was performed using the GridSearchCV()
method from the sklearn library. Subsequently, ten-
fold cross-validation was conducted using the
datasets resulting from the feature selection with the
SHAP method for the data processed with Combat-
seq, Combat-seq and Log2 transformation, Combat-
seq and TPM-Log2 normalization, and Combat-seq
with VST normalization. The Gradient Boosting
Classifier algorithm was trained with the parameters
n_estimators=100 and criterion='friedman_mse'.
2.7 Clustering
Based on the data generated by SHAP, the Kmeans,
AffinityPropagation, and AgglomerativeClustering
algorithms from the Python Sklearn library were
tested to identify groups of patients with similarities
in genes relevant to classification. Tests were
conducted with distance metrics such as "euclidean,"
"manhattan," "chebyshev," "minkowski,"
"seuclidean," "mahalanobis," and "cosine" as the
similarity parameter. Once the clusters were created,
the majority class (0 for non-responders or 1 for
responders) was identified in each one, and the
corresponding value was assigned to each cluster.
With these new assignments, the Rand index metric
was used for clustering performance evaluation.
Finally, heat maps were generated for each of the
clusters.
3 RESULTS
3.1 Batch Effect Correction
Figure 1 shows PCA before Batch effect correction, a
separation by cohorts into two main groups is
observed, one of them corresponds to the cohorts
obtained from the EGA and ENA databases, and the
second group corresponds to the cohorts obtained
from the GEO database. Figure 2 illustrates the
removal of batch effect using Combat-seq through
PCA.
3.2 Differential Expression Analysis
As a result of the differential expression analysis (p-
adjusted = 0.05 and lfcThreshold = 0.25), 54 genes
were found to be overexpressed in the responsive
group, and 64 were underexpressed. Figure 3 displays
the volcano plot generated from this analysis.
The top 10 genes with the highest Log Fold
Change (LFC) or overexpressed in patients
responding to immunotherapy were LOC105377177,
BIOINFORMATICS 2024 - 15th International Conference on Bioinformatics Models, Methods and Algorithms
382
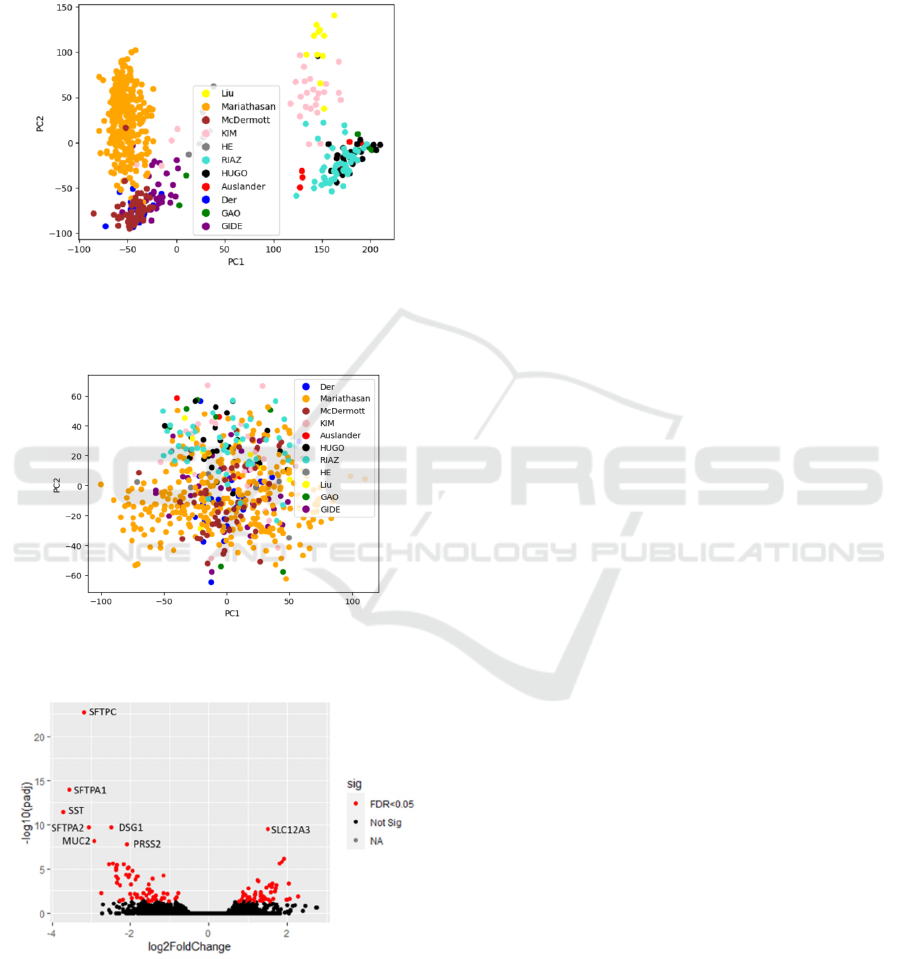
H2BC12L, IGKV1D-33, APOH, SEPTIN7P11,
IGHV3-53, REN, C2orf80, UBE2NL and DUSP13.
The top 10 genes with the highest -LFC or
underexpressed in patients responding to
immunotherapy were SST, SFTPA1, SFTPC, MUC2,
BPIFA1, GKN1, DSG1, and FGFBP1.
Figure 1: PCA of quantification matrix with VST but
without batch effect correction, identifying the original
studies.
Figure 2: PCA of quantification matrix with batch effect
removal using Combat-seq, identifying the original studies.
Figure 3: PCA of quantification matrix with batch effect
removal using Combat-seq, identifying the original studies.
KEEG molecular pathways enriched with highly
expressed genes (q=0.05) in patients responding to
immunotherapy are “hsa04612 Antigen processing
and presentation” and “hsa04650 Natural killer cell
mediated cytotoxicity”, also enriched in 4 cohorts and
3 cohorts respectively, when analysing the 5 cohorts
with the highest number of patients. KEEG molecular
pathways enriched with low expressed genes
(q=0.05) in patients responding to immunotherapy
are “hsa00980 Metabolism of xenobiotics by
cytochrome P450”, “hsa00982 Drug metabolism -
cytochrome P450”, “hsa04510 Focal adhesion”,
“hsa00830 Retinol metabolism” and “hsa04512
ECM-receptor interaction”, also enriched in 4, 3, 3, 2
and 3 cohorts respectively, when analysing the 5
cohorts with the highest number of patients.
Pathways showing enrichment with
overexpressed genes are clearly related to
immunological processes. Similarly, an association
between pathways enriched with underexpressed
genes and prognosis in cancer has been found in the
literature (Harvey & Morgan, 2014; Hu & Chen,
2012; Nersisyan et al., 2021; Zhao & Guan, 2009).
3.3 Machine Learning Models for
Classification
Using the Pycaret library in Python, different
classification algorithms were tested based on various
knowledge bases. It was found that the algorithm with
the best AUC results across the trials was
GradientBoosting. Additionally, it was identified that
with batch effect correction using Combat-seq, the
best accuracy and AUC results were obtained (0.78
AUC), surpassing the implementation of Limma in
DESeq2 (0.67 AUC) and EdgeR (0.68 AUC).
However, the models obtained have a recall lower
than 0.5, so it became necessary to explore different
feature selection techniques.
Using the Sklearn library in Python and 10-fold
cross-validation and SHAP for features selection,
different classification algorithms were tested based
on various knowledge bases, once again finding
better performance with the GradientBoosting
algorithm. Data without batch effect correction,
whether unnormalized or normalized using various
techniques (Log2, TPM, TPM-Log2, VST), yielded
AUC results between 0.79 and 0.86. Datasets with
batch effect correction using the Limma
implementation in DESeq2 and in EdgeR obtained
AUC values of 0.83 and 0.84, respectively. Datasets
with Batch effect correction using Combat-seq
without normalization or with subsequent
normalization using different techniques (Log2,
TPM, TPM-Log2, VST) obtained AUC results
between 0.89 and 0.91 and with sensitivity results
between 0.80 and 0.82, as well as specificity results
Predictive Biomarkers in PD-1/PD-L1 Immunotherapy Response: A Machine Learning Approach Using Gene Sequencing Data
383
between 0.82 and 0.86. From the tests conducted with
the dataset containing 1230 differentially expressed
genes (padjust = 0.05 and lfcThreshold = 0.1), a lower
performance was identified, indicating that it is not a
good feature selection method. Many of the genes
selected through the functions of the SHAP library in
the models with the complete dataset do not belong to
the set of differentially expressed genes.
In Table 1 the results are presented after adjusting
the parameters of the GradientBoosting algorithm for
the datasets: Combat-seq, Combat-seq log2, Combat-
seq and TPM log2 normalization, and Combat-seq
with VST. The best result was obtained for the dataset
with Combat-seq and VST normalization, with an
average accuracy of 0.88+/-0.045, an average AUC
of 0.95+/-0.027, a recall of 0.84, and a specificity of
0.92.
The genes obtained for the model trained on data
with Combat-seq batch effect correction and VST
normalization can be observed in Appendix, obtained
using the SHAP library in Python, which displays
features in order of importance in the model and
indicates whether high values of each gene contribute
to a negative response to immunotherapy (red values
towards the right) or a positive response (red values
towards the left).
The most relevant genes for the model are: SFTPC,
SLC6A12, CSRP3, KCNC2, DPYSL5, QRSL1,
LOC107985745, EPHA8, LOC101926984,
NEUROG2-AS1, CXCL13, LOC102724334,
LOC107985221, IGLV1-41, TMEM151A, TRIM48,
SERPINB2, GABRR1, LOC124908054 y TUBB6.
Some of these genes have been previously reported in
the literature for their association with the response to
immunotherapy under different biological
mechanisms, like SFTPC (Jin et al., 2022), CSRP3
(S. Li et al., 2023), DPYSL5 which has positive
interaction with Fibroblast growth factor receptor
FGRFR3 related with PD-L1 control (Jing et al.,
2021), QRSL1 (Morgan & Tergaonkar, 2022),
EPHA8 apoptosis inhibitor (Wang et al., 2021),
related to tumorigenesis and angiogenesis(X. Liu et
al., 2016), CXCL13 which modulates cancer and
immune cells to promote lymphocyte infiltration,
activation by tumor antigens, and differentiation to
increase the antitumor immune response (Hsieh et al.,
2022), TRIM48 member of TRIM family proteins
that participate in the ubiquitin-proteasome
degradation system as E3-ubiquitin ligases and play
pivotal regulatory roles in the occurrence and
development of tumors, including tumor immune
escape (Gu et al., 2023), SERPINB2 a regulator of
inflammatory processes which has been described in
the context of macrophage activation and cellular
senescence (Sen et al., 2020) and GABRR1 is
associated with the GABAergic signaling pathway, as
emerging studies have revealed its involvement not
only in traditional neurotransmission but also in
tumorigenesis and the regulation of tumor immunity
(Yang et al., 2023).
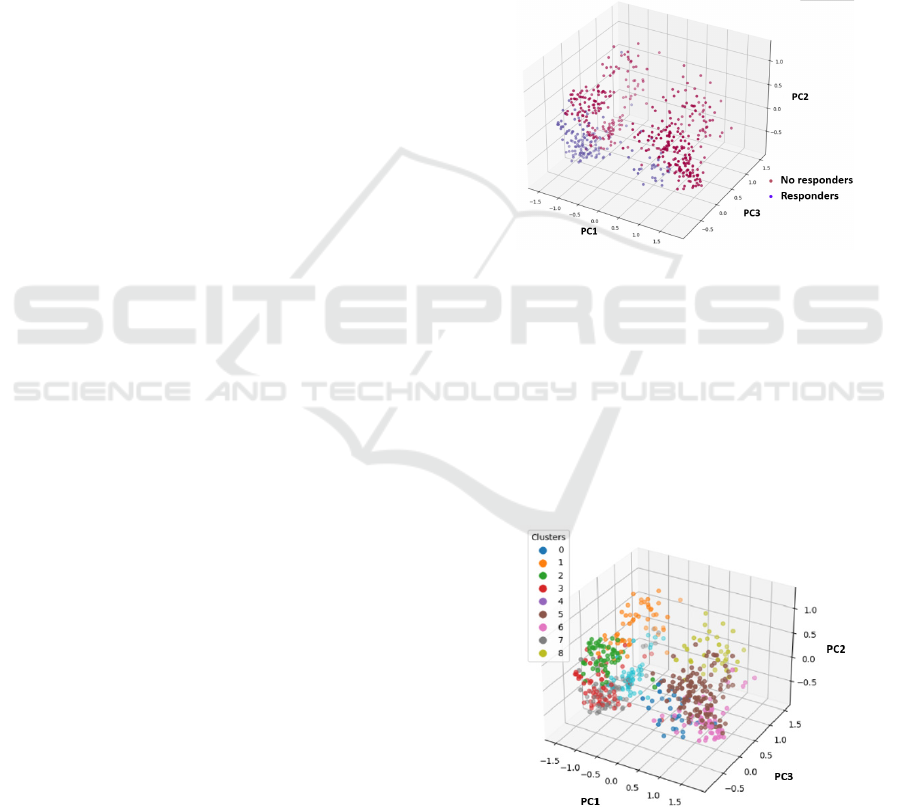
3.4 Clustering
Using the data values generated by SHAP for the 55
relevant genes, PCA was performed, allowing the
identification of responders and non-responders as
separate groups, as shown in Figure 4.
Figure 4: PCA of SHAP values for the 55 relevant genes.
Table 2 shows the percentage of patients who
respond and do not respond in each of the clusters and
the number of samples per cluster. All clusters have a
percentage above 80% for the majority class and
contain different types of cancer, except for cluster 0,
which has 82% of melanoma samples and only 62%
of the majority class, which in this case corresponds
to responders. In Figure 5 the nine clusters are
displayed using PCA to facilitate visualization.
Figure 5: Nine clusters generated from the SHAP values of
the 55 relevant genes in the GradientBoosting model, PCA
employed for visualization.
BIOINFORMATICS 2024 - 15th International Conference on Bioinformatics Models, Methods and Algorithms
384

Table 1: Performance of the GradientBoosting algorithm on different datasets after feature selection using the SHAP method.
Dataset Accurac
y
AUC Recall Specificit
y
Combat-seq - VST 0.88+
/
-0.045 0.95+
/
-0.027 0.84 0.90
Combat-se
q
0.869 +
/
- 0.08 0.949+
/
- 0.0558 0.83 0.92
Combat-se
q
lo
g
2 0.85 +
/
- 0.068 0.94 +
/
- 0.038 0.80 0.91
Combat-se
q
TPM lo
g
2 0.85+
/
- 0.075 0.924+
/
-0.07 0.78 0.90
Table 2: Percentage of patients with negative and positive responses and number of patients by cancer type in each cluster.
Cluster
percentage
of
responders
percentage
of non-
responders
Number of
urothelial
samples
Number
of renal
samples
Number of
melanoma
samples
Number
of lung
samples
Number
of oral
samples
Number
of thymic
samples
Total of
patients
0 62% 38% 2 24 3 29
1 2% 98% 26 7 11 2 3 2 51
2 12% 88% 34 9 13 1 1 58
3 80% 20% 39 10 13 1 1 1 65
4 2% 98% 91 16 14 6 3 130
5 11% 88% 43 8 4 2 1 1 59
6 80% 20% 37 15 10 7 2 3 74
7 0% 100% 8 1 19 5 33
8 2% 98% 16 15 15 1 47
In Figure 6 heatmaps are displayed for the first
fifteen samples of each cluster where the majority
class consists of responding patients, while in Figure
7 heatmaps for the first fifteen samples of each cluster
where the majority class consists of non-responding
patients are shown. As can be seen in the different
heatmaps, very negative SFTPC SHAP values are
found in clusters where the majority class is non-
responders; this occurs when this gene is
overexpressed. Positive SHAP values for SFTPC,
accompanied by negative SHAP values of SLC6A12,
CSRP3, KCNC2, DPYSL5, or QRSL1, are present in
clusters 1, 2, and 8 with a majority class of non-
responders, in which all the genes are
underexpressed.
Positive SHAP values for SFTPC, accompanied
by negative SHAP values of SLC6A12, CSRP3,
KCNC2, DPYSL5, or QRSL1, are present in clusters
1, 2, and 8 with a majority class of non-responders, in
which all the genes are underexpressed. On the
contrary, positive SHAP values for SFTPC,
accompanied by positive SHAP values of SLC6A12,
CSRP3, KCNC2, DPYSL5, or QRSL1, are present in
clusters 3 and 6 with a majority class of positive
response, in which these genes are overexpressed.
Cluster 0 does not have a defined pattern and requires
further analysis to find other associated factors in
melanoma.
4 CONCLUSIONS
In this study, a Gradient Boosting algorithm was
trained for predicting the response to PD-1/PD-L1
immune checkpoint inhibitors in solid tumors using
RNA-seq data, achieving an AUC of 0.95. This
performance surpasses previously reported predictive
models in the literature, which typically have AUC
values between 0.66 and 0.79, as well as FDA-
approved biomarkers (068 – 0.79 AUC). The Python
SHAP library proved valuable in identifying the 55
genes used in the model. The SFTPC gene emerged
as the most relevant for classification, identified in
both the differential expression analysis and the
model. High expression of SFTPC is consistently
associated with non-response to ICI. Other relevant
genes in the models were SLC6A12, CSRP3,
KCNC2, DPYSL5, and QRSL1, but they are not part
of the top differentially expressed genes.
Differential expression analysis is not the most
suitable technique for feature selection, as the model
trained with differentially expressed genes exhibited
lower performance metrics. This may be attributed to
the diverse biological mechanisms involved in
immunotherapy response, leading to gene expression
differences within each class (responders and non-
responders).
Predictive Biomarkers in PD-1/PD-L1 Immunotherapy Response: A Machine Learning Approach Using Gene Sequencing Data
385
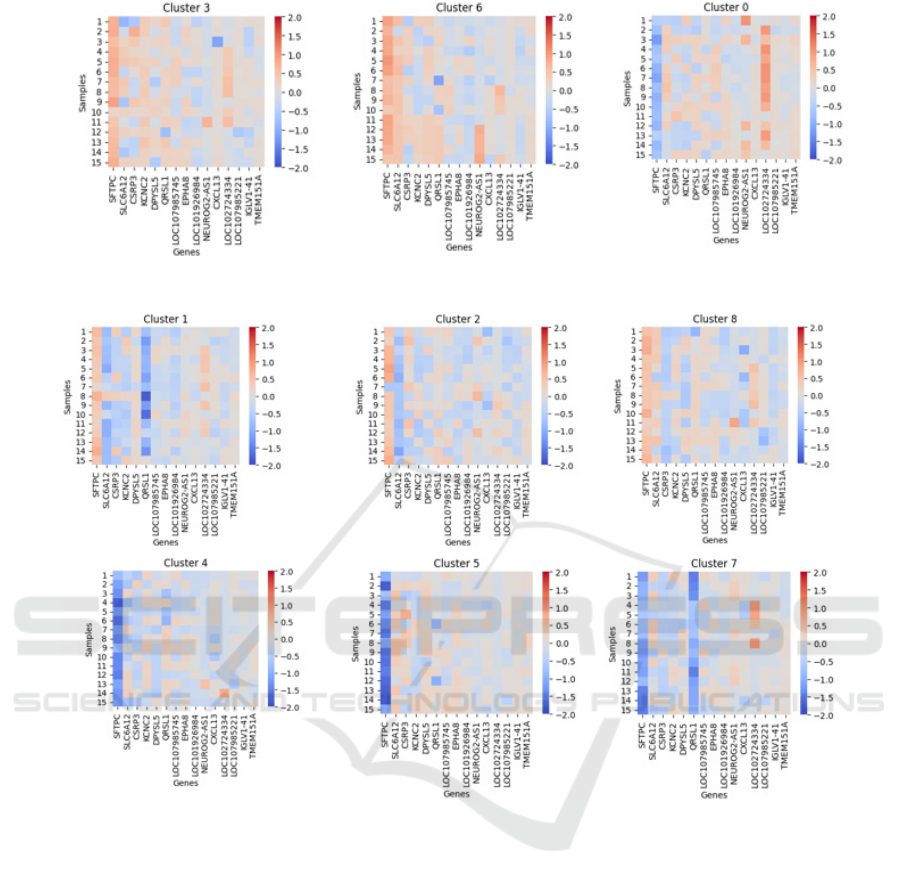
Figure 6: Heatmaps for the clusters with the majority class showing a positive response to PD-1/PD-L1 immunotherapy.
Figure 7: Heatmaps for the clusters with the majority class showing a negative response to PD-1/PD-L1 immunotherapy.
Affinity Propagation algorithm was employed to
identify common expression profiles among samples,
resulting in 9 clusters, all with a majority class
percentage greater than 80% and containing different
cancer types. This confirms the potential for finding
common biomarkers across various cancer types for
predicting ICI response. Three clusters with a
majority class of non-responders exhibit very
negative SHAP values for the SFTPC gene,
confirming that overexpression of this gene is
indicative of a poor prognosis for response. Three
clusters with a majority of non-responders have
positive SHAP values for SFTPC, similar to two
clusters with a majority of responders. However, in
the non-responder clusters, there are generally
negative SHAP values for genes SLC6A12, CSRP3,
KCNC2, DPYSL5, or QRSL1, indicating that low
expression values of these genes may have a poor
prognosis. Specifically, non-responder Cluster 1
exhibits negative SHAP values for the QRSL1 gene,
and non-responder Cluster 2 shows negative SHAP
values for the SLC6A12 gene. Further analysis is
needed to examine the differences in the expression
profiles of each cluster, especially Cluster 0, which
has 82% of melanoma samples and only 62% of the
majority class, corresponding to responders. The
relationship between these expression profiles and the
molecular pathways enriched with differentially
expressed genes has not been explored.
It is suggested to conduct validation studies with the
genes discovered in the present work, using new
datasets. Future studies are required to analyse the
expression profiles and associated biological
pathways, aiming to deepen our understanding of the
BIOINFORMATICS 2024 - 15th International Conference on Bioinformatics Models, Methods and Algorithms
386

mechanisms of evasion and response to immune
checkpoint inhibitors and identify genes that can
enhance the performance of the proposed prediction
model.
REFERENCES
Abbott, C. W., Boyle, S. M., Pyke, R. M., McDaniel, L. D.,
Levy, E., Navarro, F. C. P., Mellacheruvu, D., Zhang,
S. V., Tan, M., Santiago, R., Jang, S., & Chen, R.
(2021). Prediction of immunotherapy response in
melanoma through combined modeling of neoantigen
burden and immune-related resistance mechanisms.
Clinical Cancer Research, 27(15), 4265–4276.
https://doi.org/10.1158/1078-0432.CCR-20-4314
Auslander, N., Zhang, G., Lee, J. S., Frederick, D. T., Miao,
B., Moll, T., Tian, T., Wei, Z., Madan, S., Sullivan, R.
J., Boland, G., Flaherty, K., Herlyn, M., & Ruppin, E.
(2018). Robust prediction of response to immune
checkpoint blockade therapy in metastatic melanoma.
Nature Medicine, 24(10), 1545–1549.
https://doi.org/10.1038/s41591-018-0157-9
Bonneville, R., Krook, M. A., Kautto, E. A., Miya, J.,
Wing, M. R., Chen, H.-Z., Reeser, J. W., Sameek, L., &
Roychowdhury, Y. (2017). Landscape of Microsatellite
Instability Across 39 Cancer Types.
http://ocg.cancer.gov/
Bray, F., Ferlay, J., Soerjomataram, I., Siegel, R. L., Torre,
L. A., & Jemal, A. (2018). Global cancer statistics
2018: GLOBOCAN estimates of incidence and
mortality worldwide for 36 cancers in 185 countries.
CA: A Cancer Journal for Clinicians, 68(6), 394–424.
https://doi.org/10.3322/caac.21492
Chabanon, R. M., Pedrero, M., Lefebvre, C., Marabelle, A.,
Soria, J. C., & Postel-Vinay, S. (2016). Mutational
landscape and sensitivity to immune checkpoint
blockers. In Clinical Cancer Research (Vol. 22, Issue
17, pp. 4309–4321). American Association for Cancer
Research Inc. https://doi.org/10.1158/1078-0432.CCR-
16-0903
Chan, T. A., Yarchoan, M., Jaffee, E., Swanton, C.,
Quezada, S. A., Stenzinger, A., & Peters, S. (2019).
Development of tumor mutation burden as an
immunotherapy biomarker: Utility for the oncology
clinic. In Annals of Oncology (Vol. 30, Issue 1, pp. 44–
56). Oxford University Press.
https://doi.org/10.1093/annonc/ mdy495
Chen, Z., Wang, M., De Wilde, R. L., Feng, R., Su, M.,
Torres-de la Roche, L. A., & Shi, W. (2021). A
Machine Learning Model to Predict the Triple Negative
Breast Cancer Immune Subtype. Frontiers in
Immunology, 12.
https://doi.org/10.3389/fimmu.2021.749459
Du, K., Wei, S., Wei, Z., Frederick, D. T., Miao, B., Moll,
T., Tian, T., Sugarman, E., Gabrilovich, D. I., Sullivan,
R. J., Liu, L., Flaherty, K. T., Boland, G. M., Herlyn,
M., & Zhang, G. (2021). Pathway signatures derived
from on-treatment tumor specimens predict response to
anti-PD1 blockade in metastatic melanoma. Nature
Communications, 12(1). https://doi.org/10.1038/
s41467-021-26299-4
Gide, T. N., Quek, C., Menzies, A. M., Tasker, A. T.,
Shang, P., Holst, J., Madore, J., Lim, S. Y., Velickovic,
R., Wongchenko, M., Yan, Y., Lo, S., Carlino, M. S.,
Guminski, A., Saw, R. P. M., Pang, A., McGuire, H.
M., Palendira, U., Thompson, J. F., … Wilmott, J. S.
(2019). Distinct Immune Cell Populations Define
Response to Anti-PD-1 Monotherapy and Anti-PD-
1/Anti-CTLA-4 Combined Therapy. Cancer Cell,
35(2), 238-255.e6.
https://doi.org/10.1016/J.CCELL.2019.01.003
Gu, J., Chen, J., Xiang, S., Zhou, X., & Li, J. (2023).
Intricate confrontation: Research progress and
application potential of TRIM family proteins in tumor
immune escape. In Journal of Advanced Research.
Elsevier B.V.
https://doi.org/10.1016/j.jare.2023.01.011
Han, J., Duan, J., Bai, H., Wang, Y., Wan, R., Wang, X.,
Chen, S., Tian, Y., Wang, D., Fei, K., Yao, Z., Wang,
S., Lu, Z., Wang, Z., & Wang, J. (2020). TCR repertoire
diversity of peripheral PD-1þCD8þ T cells predicts
clinical outcomes after immunotherapy in patients with
non–small cell lung cancer. Cancer Immunology
Research, 8(1), 146–154. https://doi.org/10.1158/2326-
6066.CIR-19-0398
Harvey, R. D., & Morgan, E. T. (2014). Cancer,
Inflammation, and Therapy: Effects on Cytochrome
P450–Mediated Drug Metabolism and Implications for
Novel Immunotherapeutic Agents. Clinical
Pharmacology & Therapeutics, 96(4), 449–457.
https://doi.org/10.1038/ clpt.2014.143
Hsieh, C. H., Jian, C. Z., Lin, L. I., Low, G. S., Ou, P. Y.,
Hsu, C., & Ou, D. L. (2022). Potential Role of
CXCL13/CXCR5 Signaling in Immune Checkpoint
Inhibitor Treatment in Cancer. Cancers, 14(2).
https://doi.org/10.3390/cancers14020294
Huang, J., Yuan, L., Huang, W., Liao, L., Zhu, X., Wang,
X., Li, J., Liang, W., Wu, Y., Liu, X., Yu, D., Zheng,
Y., Guan, J., Zhan, Y., & Liu, L. (2022). LATPS, a
novel prognostic signature based on tumor
microenvironment of lung adenocarcinoma to better
predict survival and immunotherapy response.
Frontiers in Immunology, 13.
https://doi.org/10.3389/fimmu.2022. 1064874
Hugo, W., Zaretsky, J. M., Sun, L., Song, C., Moreno, B.
H., Hu-Lieskovan, S., Berent-Maoz, B., Pang, J.,
Chmielowski, B., Cherry, G., Seja, E., Lomeli, S.,
Kong, X., Kelley, M. C., Sosman, J. A., Johnson, D. B.,
Ribas, A., & Lo, R. S. (2016). Genomic and
Transcriptomic Features of Response to Anti-PD-1
Therapy in Metastatic Melanoma. Cell, 165(1), 35–44.
https://doi.org/10.1016/ j.cell.2016.02.065
Hu, K., & Chen, F. (2012). Identification of significant
pathways in gastric cancer based on protein-protein
interaction networks and cluster analysis.
www.sbg.org.br
Hwang, S., Kwon, A. Y., Jeong, J. Y., Kim, S., Kang, H.,
Park, J., Kim, J. H., Han, O. J., Lim, S. M., & An, H. J.
Predictive Biomarkers in PD-1/PD-L1 Immunotherapy Response: A Machine Learning Approach Using Gene Sequencing Data
387

(2020). Immune gene signatures for predicting durable
clinical benefit of anti-PD-1 immunotherapy in patients
with non-small cell lung cancer. Scientific Reports,
10(1). https://doi.org/10.1038/s41598-019-57218-9
Jia, H., Tang, W.-J., Sun, L., Wan, C., Zhou, Y., & Shen,
W.-Z. (2023). Pan-cancer analysis identifies
proteasome 26S subunit, ATPase (PSMC) family
genes, and related signatures associated with prognosis,
immune profile, and therapeutic response in lung
adenocarcinoma. Frontiers in Genetics, 13.
https://doi.org/10.3389/fgene. 2022.1017866
Jing, W., Wang, G., Cui, Z., Xiong, G., Jiang, X., Li, Y., Li,
W., Han, B., Chen, S., & Shi, B. (2021). FGFR3
Destabilizes PD-L1 via NEDD4 to Control T-cell-
Mediated Bladder Cancer Immune Surveillance.
Cancer Research, 82(1), 114–129.
https://doi.org/10.1158/0008-5472.CAN-21-2362
Jin, X., Hu, Z., Sui, Q., Zhao, M., Liang, J., Liao, Z., Zheng,
Y., Wang, H., & Shi, Y. (2022). A Novel Prognostic
Signature Revealed the Interaction of Immune Cells in
Tumor Microenvironment Based on Single-Cell RNA
Sequencing for Lung Adenocarcinoma. Journal of
Immunology Research, 2022. https://doi.org/10.1155/
2022/6555810
Jung, H., Kim, H. S., Kim, J. Y., Sun, J. M., Ahn, J. S., Ahn,
M. J., Park, K., Esteller, M., Lee, S. H., & Choi, J. K.
(2019). DNA methylation loss promotes immune
evasion of tumours with high mutation and copy
number load. Nature Communications, 10(1).
https://doi.org/10.1038/ s41467-019-12159-9
Kang, Y., Vijay, S., & Gujral, T. S. (2022). Deep neural
network modeling identifies biomarkers of response to
immune-checkpoint therapy. IScience, 25(5).
https://doi.org/10.1016/j.isci.2022.104228
Klümper, N., Ralser, D. J., Zarbl, R., Schlack, K., Schrader,
A. J., Rehlinghaus, M., Hoffmann, M. J., Niegisch, G.,
Uhlig, A., Trojan, L., Steinestel, J., Steinestel, K.,
Wirtz, R. M., Sikic, D., Eckstein, M., Kristiansen, G.,
Toma, M., Hölzel, M., Ritter, M., … Dietrich, D.
(2021). CTLA4 promoter hypomethylation is a
negative prognostic biomarker at initial diagnosis but
predicts response and favorable outcome to anti-PD-1
based immunotherapy in clear cell renal cell carcinoma.
Journal for ImmunoTherapy of Cancer, 9(8).
https://doi.org/10.1136/JITC-2021-002949
Kong, J., Ha, D., Lee, J., Kim, I., Park, M., Im, S.-H., Shin,
K., & Kim, S. (2022). Network-based machine learning
approach to predict immunotherapy response in cancer
patients. Nature Communications, 13(1), 3703.
https://doi.org/10.1038/s41467-022-31535-6
Kornepati, A. V. R., Vadlamudi, R. K., & Curiel, T. J.
(2022). Programmed death ligand 1 signals in cancer
cells. In Nature Reviews Cancer (Vol. 22, Issue 3, pp.
174–189). Nature Research.
https://doi.org/10.1038/s41568-021-00431-4
Lapuente-Santana, Ó., van Genderen, M., Hilbers, P. A. J.,
Finotello, F., & Eduati, F. (2021). Interpretable systems
biomarkers predict response to immune-checkpoint
inhibitors. Patterns, 2(8). https://doi.org/10.
1016/j.patter.2021.100293
Liang, H., Jo, J.-H., Zhang, Z., MacGibeny, M. A., Han, J.,
Proctor, D. M., Taylor, M. E., Che, Y., Juneau, P.,
Apolo, A. B., Gulley, J. L., & Kong, H. H. (2022).
Predicting cancer immunotherapy response from gut
microbiomes using machine learning models.
Oncotarget, 13(1), 876–889.
https://doi.org/10.18632/oncotarget. 28252
Liberini, V., Mariniello, A., Righi, L., Capozza, M.,
Delcuratolo, M. D., Terreno, E., Farsad, M., Volante,
M., Novello, S., & Deandreis, D. (2021). Nsclc
biomarkers to predict response to immunotherapy with
checkpoint inhibitors (Ici): From the cells to in vivo
images. In Cancers (Vol. 13, Issue 18). MDPI.
https://doi.org/10.3390/cancers13184543
Li, S., Liu, L., Qu, Y., Yuan, L., Zhang, X., Ma, Z., Bai, H.,
& Wang, J. (2023). Comprehensive Analyses and
Immunophenotyping of LIM Domain Family Genes in
Patients with Non-Small-Cell Lung Cancer.
International Journal of Molecular Sciences, 24(5).
https://doi.org/10. 3390/ijms24054524
Li, T., Chen, S., Zhang, Y., Zhao, Q., Ma, K., Jiang, X.,
Xiang, R., Zhai, F., & Ling, G. (2023). Ensemble
learning-based gene signature and risk model for
predicting prognosis of triple-negative breast cancer.
Functional and Integrative Genomics, 23(2).
https://doi.org/10.1007/s10142-023-01009-z
Liu, S., Knochelmann, H. M., Lomeli, S. H., Hong, A.,
Richardson, M., Yang, Z., Lim, R. J., Wang, Y.,
Dumitras, C., Krysan, K., Timmers, C., Romeo, M. J.,
Krieg, C., O’Quinn, E. C., Horton, J. D., Dubinett, S.
M., Paulos, C. M., Neskey, D. M., & Lo, R. S. (2021).
Response and recurrence correlates in individuals
treated with neoadjuvant anti-PD-1 therapy for
resectable oral cavity squamous cell carcinoma. Cell
Reports Medicine, 2(10).
https://doi.org/10.1016/j.xcrm.2021.100411
Liu, X., Xu, Y., Jin, Q., Wang, W., Zhang, S., Wang, X.,
Zhang, Y., Xu, X., & Huang, J. (2016). EphA8 is a
prognostic marker for epithelial ovarian cancer. In
Oncotarget (Vol. 7, Issue 15).
www.impactjournals.com/ oncotarget/
Mariathasan, S., Turley, S. J., Nickles, D., Castiglioni, A.,
Yuen, K., Wang, Y., Kadel, E. E., Koeppen, H.,
Astarita, J. L., Cubas, R., Jhunjhunwala, S.,
Banchereau, R., Yang, Y., Guan, Y., Chalouni, C., Ziai,
J., Şenbabaoǧlu, Y., Santoro, S., Sheinson, D., …
Powles, T. (2018). TGFβ attenuates tumour response to
PD-L1 blockade by contributing to exclusion of T cells.
Nature, 554(7693), 544–548.
https://doi.org/10.1038/nature25501
McDermott, D. F., Huseni, M. A., Atkins, M. B., Motzer,
R. J., Rini, B. I., Escudier, B., Fong, L., Joseph, R. W.,
Pal, S. K., Reeves, J. A., Sznol, M., Hainsworth, J.,
Rathmell, W. K., Stadler, W. M., Hutson, T., Gore, M.
E., Ravaud, A., Bracarda, S., Suárez, C., … Powles, T.
(2018). Clinical activity and molecular correlates of
response to atezolizumab alone or in combination with
bevacizumab versus sunitinib in renal cell carcinoma.
Nature Medicine, 24(6), 749–757.
https://doi.org/10.1038/s41591-018-0053-3
BIOINFORMATICS 2024 - 15th International Conference on Bioinformatics Models, Methods and Algorithms
388

Morgan, D., & Tergaonkar, V. (2022). Unraveling B cell
trajectories at single cell resolution. In Trends in
Immunology (Vol. 43, Issue 3, pp. 210–229). Elsevier
Ltd. https://doi.org/10.1016/j.it.2022.01.003
Nersisyan, S., Novosad, V., Engibaryan, N., Ushkaryov, Y.,
Nikulin, S., & Tonevitsky, A. (2021). ECM–Receptor
Regulatory Network and Its Prognostic Role in
Colorectal Cancer. Frontiers in Genetics, 12.
https://doi.org/10.3389/fgene.2021.782699
Paijens, S. T., Vledder, A., de Bruyn, M., & Nijman, H. W.
(2021). Tumor-infiltrating lymphocytes in the
immunotherapy era. In Cellular and Molecular
Immunology (Vol. 18, Issue 4, pp. 842–859). Springer
Nature. https://doi.org/10.1038/s41423-020-00565-9
Reck, M., Heigener, D. F., Mok, T., Soria, J.-C., & Rabe,
K. F. (2013). Lung Cancer 1 Management of non-small-
cell lung cancer: recent developments. In
www.thelancet.com (Vol. 382). www.thelancet.com
Riaz, N., Havel, J. J., Makarov, V., Desrichard, A., Urba,
W. J., Sims, J. S., Hodi, F. S., Martín-Algarra, S.,
Mandal, R., Sharfman, W. H., Bhatia, S., Hwu, W. J.,
Gajewski, T. F., Slingluff, C. L., Chowell, D., Kendall,
S. M., Chang, H., Shah, R., Kuo, F., … Chan, T. A.
(2017). Tumor and Microenvironment Evolution
during Immunotherapy with Nivolumab. Cell, 171(4),
934-949.e15.
https://doi.org/10.1016/j.cell.2017.09.028
Sen, P., Helmke, A., Liao, C. M., Sörensen-Zender, I.,
Rong, S., Bräsen, J.-H., Melk, A., Haller, H., von
Vietinghoff, S., & Schmitt, R. (2020). SerpinB2
Regulates Immune Response in Kidney Injury and
Aging. Journal of the American Society of Nephrology,
31(5), 983–995.
https://doi.org/10.1681/ASN.2019101085
Song, F., Wang, C.-G., Mao, J.-Z., Wang, T.-L., Liang, X.-
L., Hu, C.-W., Zhang, Y., Han, L., & Chen, Z. (2023).
PANoptosis-based molecular subtyping and HPAN-
index predicts therapeutic response and survival in
hepatocellular carcinoma. Frontiers in Immunology,
14. https://doi.org/10.3389/fimmu.2023.1197152
Song, J., Yang, R., Wei, R., Du, Y., He, P., & Liu, X.
(2022). Pan-cancer analysis reveals RIPK2 predicts
prognosis and promotes immune therapy resistance via
triggering cytotoxic T lymphocytes dysfunction.
Molecular Medicine, 28(1). https://doi.org/10.1186/
S10020-022-00475-8
Sung, H., Ferlay, J., Siegel, R. L., Laversanne, M.,
Soerjomataram, I., Jemal, A., & Bray, F. (2021). Global
Cancer Statistics 2020: GLOBOCAN Estimates of
Incidence and Mortality Worldwide for 36 Cancers in
185 Countries. CA: A Cancer Journal for Clinicians,
71(3). https://doi.org/10.3322/caac.21660
Sun, S., Xu, L., Zhang, X., Pang, L., Long, Z., Deng, C.,
Zhu, J., Zhou, S., Wan, L., Pang, B., & Xiao, Y. (2021).
Systematic assessment of transcriptomic biomarkers for
immune checkpoint blockade response in cancer
immunotherapy. Cancers, 13(7).
https://doi.org/10.3390/ cancers13071639
Topalian, S. L., Taube, J. M., Anders, R. A., & Pardoll, D.
M. (2016). Mechanism-driven biomarkers to guide
immune checkpoint blockade in cancer therapy. In
Nature Reviews Cancer (Vol. 16, Issue 5, pp. 275–287).
Nature Publishing Group.
https://doi.org/10.1038/nrc.2016.36
Uhlik, M., Pointing, D., Iyer, S., Ausec, L., Štajdohar, M.,
Cvitkovič, R., Žganec, M., Culm, K., Santos, V. C.,
Pytowski, B., Malafa, M., Liu, H., Krieg, A. M., Lee,
J., Rosengarten, R., & Benjamin, L. (2023). Xerna
TM
TME Panel is a machine learning-based transcriptomic
biomarker designed to predict therapeutic response in
multiple cancers. Frontiers in Oncology, 13.
https://doi.org/10.3389/FONC.2023.1158345
Wang, G. H., Ni, K., Gu, C., Huang, J., Chen, J., Wang, X.
D., & Ni, Q. (2021). EphA8 inhibits cell apoptosis via
AKT signaling and is associated with poor prognosis in
breast cancer. Oncology Reports, 46(2).
https://doi.org/10.3892/OR.2021.8134
Yang, Y., Ren, L., Li, W., Zhang, Y., Zhang, S., Ge, B.,
Yang, H., Du, G., Tang, B., Wang, H., & Wang, J.
(2023). GABAergic signaling as a potential therapeutic
target in cancers. In Biomedicine and Pharmacotherapy
(Vol. 161). Elsevier Masson s.r.l.
https://doi.org/10.1016/j. biopha.2023.114410
Ye, Y., Jing, Y., Li, L., Mills, G. B., Diao, L., Liu, H., &
Han, L. (2020). Sex-associated molecular differences
for cancer immunotherapy. Nature Communications,
11(1). https://doi.org/10.1038/s41467-020-15679-x
Yu, M., Peng, Z., Qin, M., Liu, Y., Wang, J., Zhang, C.,
Lin, J., Dong, T., Wang, L., Li, S., Yang, Y., Xu, S.,
Guo, W., Zhang, X., Shi, M., Peng, H., Luo, X., Zhang,
H., Zhang, L., … Sun, S. (2021). Interferon-γ induces
tumor resistance to anti-PD-1 immunotherapy by
promoting YAP phase separation. Molecular Cell,
81(6), 1216-1230.e9.
https://doi.org/10.1016/J.MOLCEL.2021.01.010
Zhang, Y., Parmigiani, G., & Johnson, W. E. (2020).
ComBat-seq: Batch effect adjustment for RNA-seq
count data. NAR Genomics and Bioinformatics, 2(3).
https://doi.org/10.1093/nargab/lqaa078
Zhao, J., & Guan, J.-L. (2009). Signal transduction by focal
adhesion kinase in cancer. Cancer and Metastasis
Reviews, 28(1–2), 35–49.
https://doi.org/10.1007/s10555-008-9165-4
Predictive Biomarkers in PD-1/PD-L1 Immunotherapy Response: A Machine Learning Approach Using Gene Sequencing Data
389
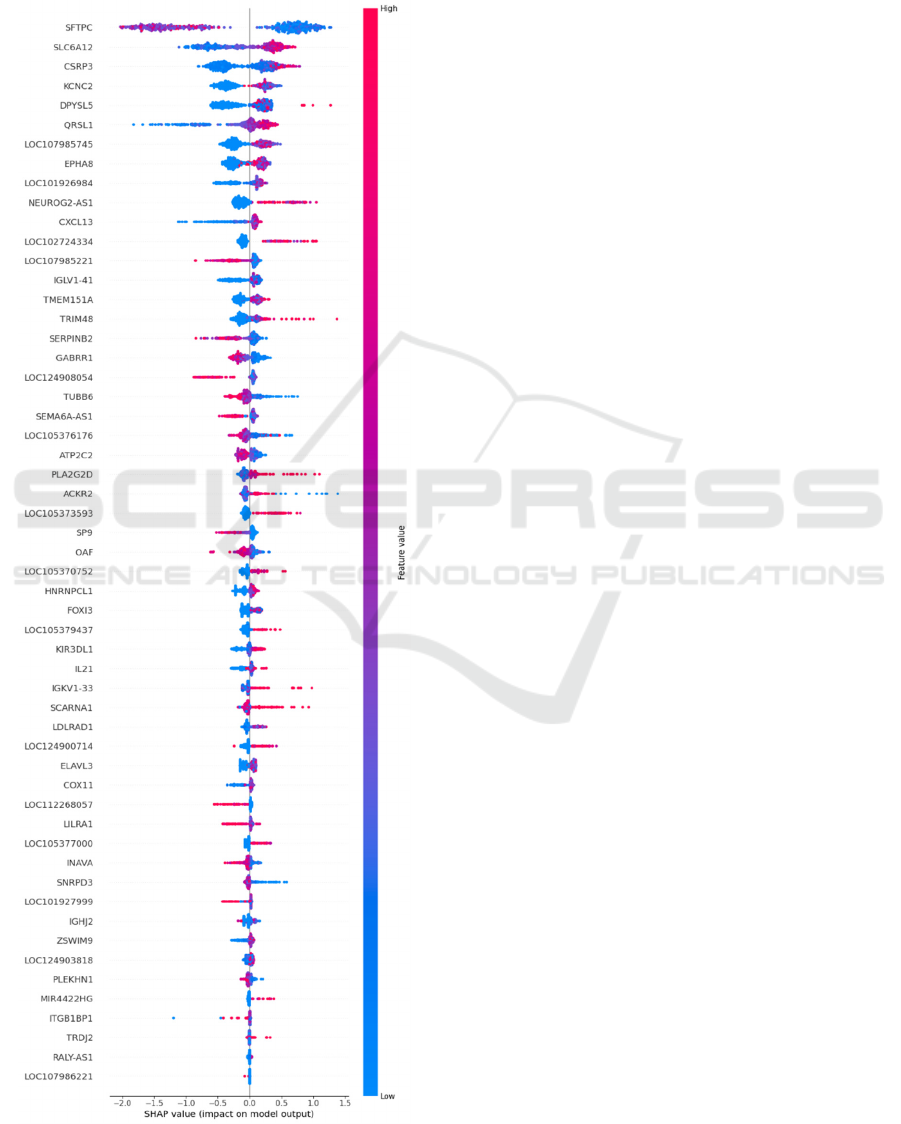
APPENDIX
Shap Values for the Genes Relevant in
the Prediction Model
BIOINFORMATICS 2024 - 15th International Conference on Bioinformatics Models, Methods and Algorithms
390
